

In looking for ways to maintain a bullish stance and generate income while protecting from a downside disaster, the standard collar (long stock, long protective put and short a higher strike call to pay for the put) is the standard approach. And while there is no reason to re-invent the wheel, there is a small twist we can apply to address the one obvious drawback of having profits capped to the upside.
By selling a call credit spread rather than writing a covered call, we can unlock the potential gains of a strong move higher. For lack of a better name, I’ll defer to Charles Cottle, one of the great option minds of this generation, who labeled this strategy a SlingShot. Adding the protective put makes this a hedged position.
The basic construction of the Slingshot Hedge consists of for every 100 shares (for our purposes a long term at-the-money call), buy one long term out-of-the-money put to button up the risk to the downside. Next, sell two nearer-term out-of-the-money call vertical spreads. Depending on how much time there is to go and implied volatility levels, you should generate enough of a credit to pay for the put you just bought.
Within a given range, the Slingshot acts much like a collar. The benefit comes on a sharp move higher. Once the price moves above the long (higher) strike of the credit call spread, the position becomes similar to a “naked” long with delta approaching 1.0.
Depending on the configuration, if the underlying stock doubled, a naked stock would make 100% profit from its current trading level. By comparison, the slingshot will generate approximately 50% to 75% on the same move. And remember, the downside is still protected, limiting the losses on a large decline.
The main drawback or danger would be if the price of was in between the call credit strikes with the worst case landing at the higher strike on expiration. Of course, if that scenario was playing out an adjustment would be in order.
The Slingshot Hedge is a versatile strategy that can be employed using a myriad of ratios, along with embedded calendar spreads to further enhance strategy selection
The Application
This strategy makes sense versus a typical collar — only if you think the underlying is capable of annual gains in excess of 20% or more. At this point of the stock and economic recovery, it is unlikely the S&P 500, or any broad index, is unlikely to post such gains.
But there are certain sectors might have potential, and use the appropriate ETF. I think the housing market presents such a possibility, and we can use the S&P Homebuilders (XHB) as our investment vehicle. This assumes a higher level of risk but also stands to deliver alpha on a portion of the portfolio.
The Investment Thesis
The latest jobs data of 221,000 added to the payrolls, and more importantly, the rise in wages, suggests the employment picture is truly getting on a sound footing. Job security is probably the number one factor when considering purchasing a home. This is coupled with the likelihood that rates will stay low by historical standards. For the foreseeable future, housing may be poised for a sustainable recovery beyond the speculative/investor-driven buying we witnessed over the past few years.
The bull case is bolstered by the fact that household formations have now built up demand for reasons cited above affordability, especially given that the rental market has seen very large price increases, should finally motivate millennials to move out of their parents’ homes and start a family of their own.
For those that cite the demographic trend toward a move into urban centers I say two things: It really doesn’t undermine a bullish housing thesis as many of the larger homebuilders and the XHB’s components have exposure to multi-family dwellings. And, for anyone that has experienced the joy of watching a toddler find their feet and vocal chords that appeal to a high rise or urban loft, pales to the benefits of a backyard and ease of a bike ride around the block.
After a steep sell-off at the end of 2018, XHB is basically back to where it was a year ago.
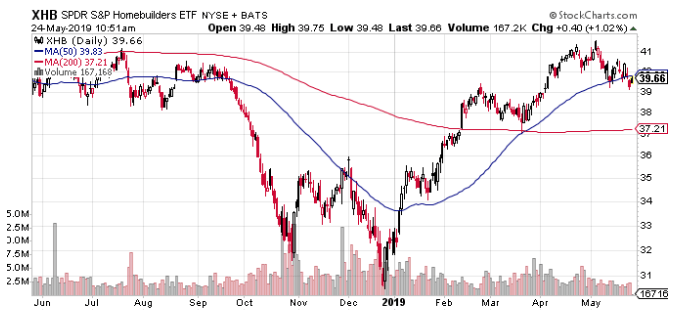
Assuming interest rates stay low the above trends in jobs, and household formation takes place, I can see XHB enjoying double-digit percentage gains in the second half of the year.
The Position
With shares of XHB currently $39.25.
-Buy 1 January 2020 $39 call for $3.00 a contract
-Buy 1 January 2020 $32 put for $0.70 a contract
And
-Sell 2 July 2019 $41 calls at $0.55 a contract
-Buy 2 July 2019 $43 calls at $0.25 a contract
The two call spreads bring in a $0.60 net credit. That covers 88% of the cost of the put. The total initial cost of the package is $3.10
The position’s current Delta is 0.15 but with a positive gamma.
The current Theta is +0.01.
While it’s never great to extrapolate or assume a repeatable event, it is indeed worth noting. The call spreads pays for 91% of the puts on the first quarterly cycle.
Assuming an unchanged share price and executing writing three additional call spreads on quarterly rolls, this would finance 35% of the call purchase.
An approximate 5% quarterly return would be realized if XHB climbs to the lower, short strike (in this case $35) on each expiration cycle.
On a move above $43, the profit potential is theoretically unlimited.
The position will be managed through the rolling of the call spreads, depending on time and price.
About the Author: Steve Smith

Steve has more than 30 years of investment experience with an expertise in options trading. He’s written for TheStreet.com, Minyanville and currently for Option Sensei. Learn more about Steve’s background, along with links to his most recent articles. More...
9 "Must Own" Growth Stocks For 2019
Get Free Updates
Join thousands of investors who get the latest news, insights and top rated picks from StockNews.com!
Top Stories on StockNews.com

Best & Worst Performing Mega Cap Stocks for July 22, 2025
HDB leads the way today as the best performing mega cap stock, closing up 4.22%.
Best & Worst Performing Mega Cap Stocks for July 21, 2025
IBKR leads the way today as the best performing mega cap stock, closing up 7.77%.
Best & Worst Performing Mega Cap Stocks for July 18, 2025
ABBNY leads the way today as the best performing mega cap stock, closing up 9.07%.
Best & Worst Performing Mega Cap Stocks for July 17, 2025
JNJ leads the way today as the best performing mega cap stock, closing up 6.19%.