

U.S stocks are enjoying an unprecedented performance over emerging markets. Can it continue, or is now the time to rotate your money overseas?
Historically, when stocks are in bull mode, bullish money managers will position themselves to take on more speculative positions, such as higher beta names including increasing exposure to emerging markets.
On the other hand, investors are positioning themselves for lower stock prices, which are riskier — assets such as emerging market stocks tend to underperform, particularly relative to developed markets.
You can see that the relative performance from two prior periods in which, after the S&P makes a new low but the emerging markets don’t, the emerging market then goes on to outperform the U.S.

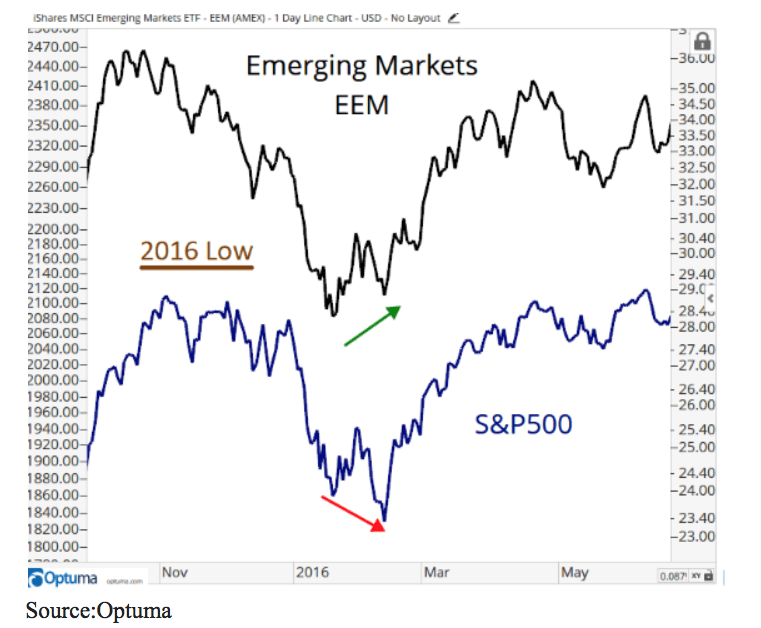

Essentially, when the S&P500 is making lower lows but Emerging Markets are simultaneously making higher lows, it’s been evidence of risk appetite for stocks with markets continuing to rally for years after the divergence. But, what we have seen over the past year is not quite following the pattern.
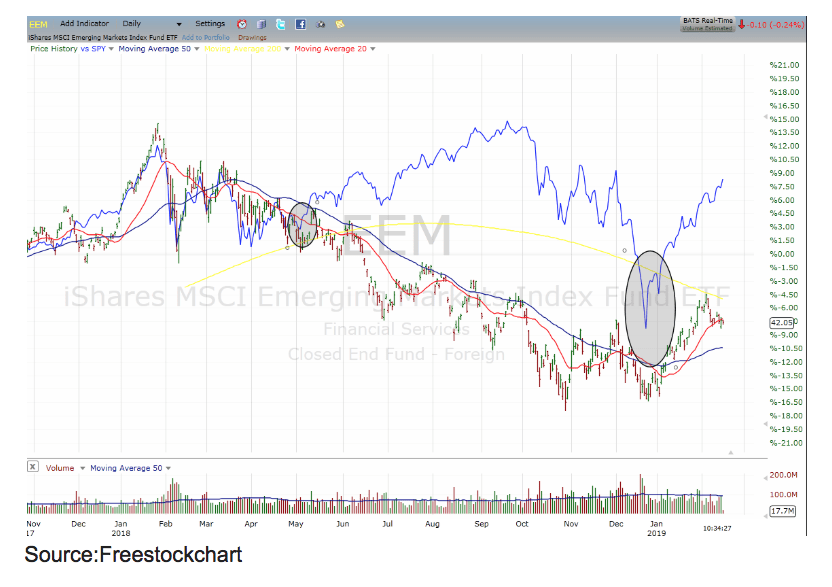
You can see that the extreme decoupling that occurred between the S&P 500 Index (blue line) and Emerging Market Index (EEM) had begun in May, but then the sell-off last fall was far steeper in U.S. stocks, causing a brief convergence in performance.
Like past patterns, emerging markets did not make a new low, suggesting that when the U.S. rebounded, emerging markets would outperform. But instead, the recent rebound has sent U.S. stocks sprinting away and well ahead of emerging markets.
One difference from prior periods is that through it’s growing economy, China now represents over 35% of the emerging market index, and its stock market has done very poorly, dropping some 30% over the past six months, and not showing many rebounds of late. This creates a big drag on the overall index.
It appears that negative sentiment may overshoot as emerging markets currencies have sold off by more than debt, and equity outflows would generally imply.
On the other side of the coin, the flows into emerging market equities recorded outflows from June through November but turned positive in January.
Emerging markets equities now have the lowest valuations of any major asset class and free cash flow yields estimated at 5%–7% over the next 12–15 months. Their discount to developed markets has deepened to the 30% range.
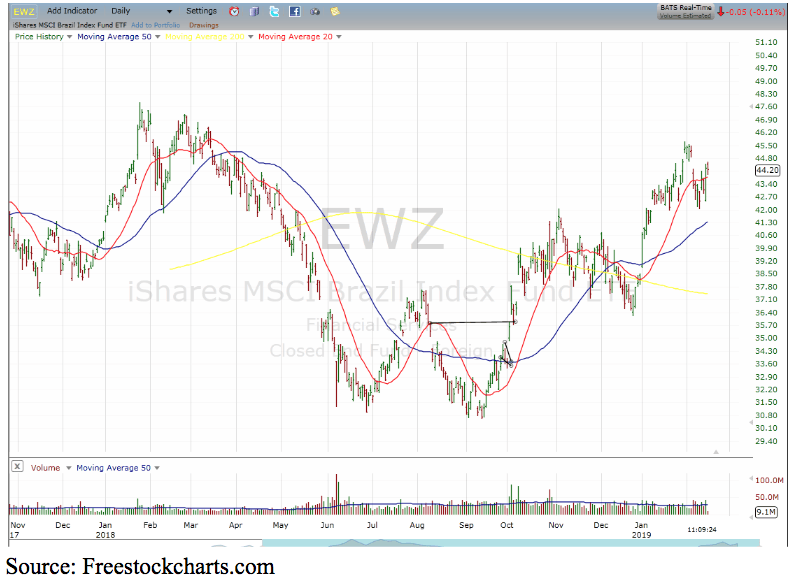
Some individual emerging markets, bottomed before the U.S., and are enjoying a bigger rebound. For example, Brazil is some 45% since the October low — well ahead of the S&P 500’s 20% rebound from it’s December low.
If we resume historical patterns, I would expect other emerging markets, from India and eventually China, to begin outperforming the U.S.
About the Author: Steve Smith

Steve has more than 30 years of investment experience with an expertise in options trading. He’s written for TheStreet.com, Minyanville and currently for Option Sensei. Learn more about Steve’s background, along with links to his most recent articles. More...
9 "Must Own" Growth Stocks For 2019
Get Free Updates
Join thousands of investors who get the latest news, insights and top rated picks from StockNews.com!
Top Stories on StockNews.com

Best & Worst Performing Stock Industries for July 26, 2024
Led by ticker KGJI, "Fashion & Luxury" was our best performing stock industry of the day, with a 1,299.75% gain.
Best & Worst Performing Mid Cap Stocks for July 26, 2024
GSHD leads the way today as the best performing mid cap stock, closing up 29.21%.
Best & Worst Performing Small Cap Stocks for July 26, 2024
KGJI leads the way today as the best performing small cap stock, closing up 100,000.00%.
Best & Worst Performing Large Cap Stocks for July 26, 2024
NOW leads the way today as the best performing large cap stock, closing up 13.40%.