

Hangzhou, China-based e-commerce giant Alibaba Group Holding Limited (BABA - Get Rating) recently reported a solid quarterly revenue. For the quarter that ended June 30, BABA reported revenue of 234.16 billion yuan or $32.29 billion, indicating a 14% year-over-year growth and topped the analysts’ estimate of 224.92 billion yuan.
The tech giant also experiences a lot of attention from smart money, with 14.6% of its shares held by institutions. As of June 30, 536 institutional holders have increased positions in the company, while 137 have opened new positions.
Given this backdrop, let’s look at the trends of BABA’s financial metrics to understand why it could be wise to wait for a better entry point in the stock.
An In-Depth Analysis of Alibaba Group’s Financial Performance from 2020 to 2023
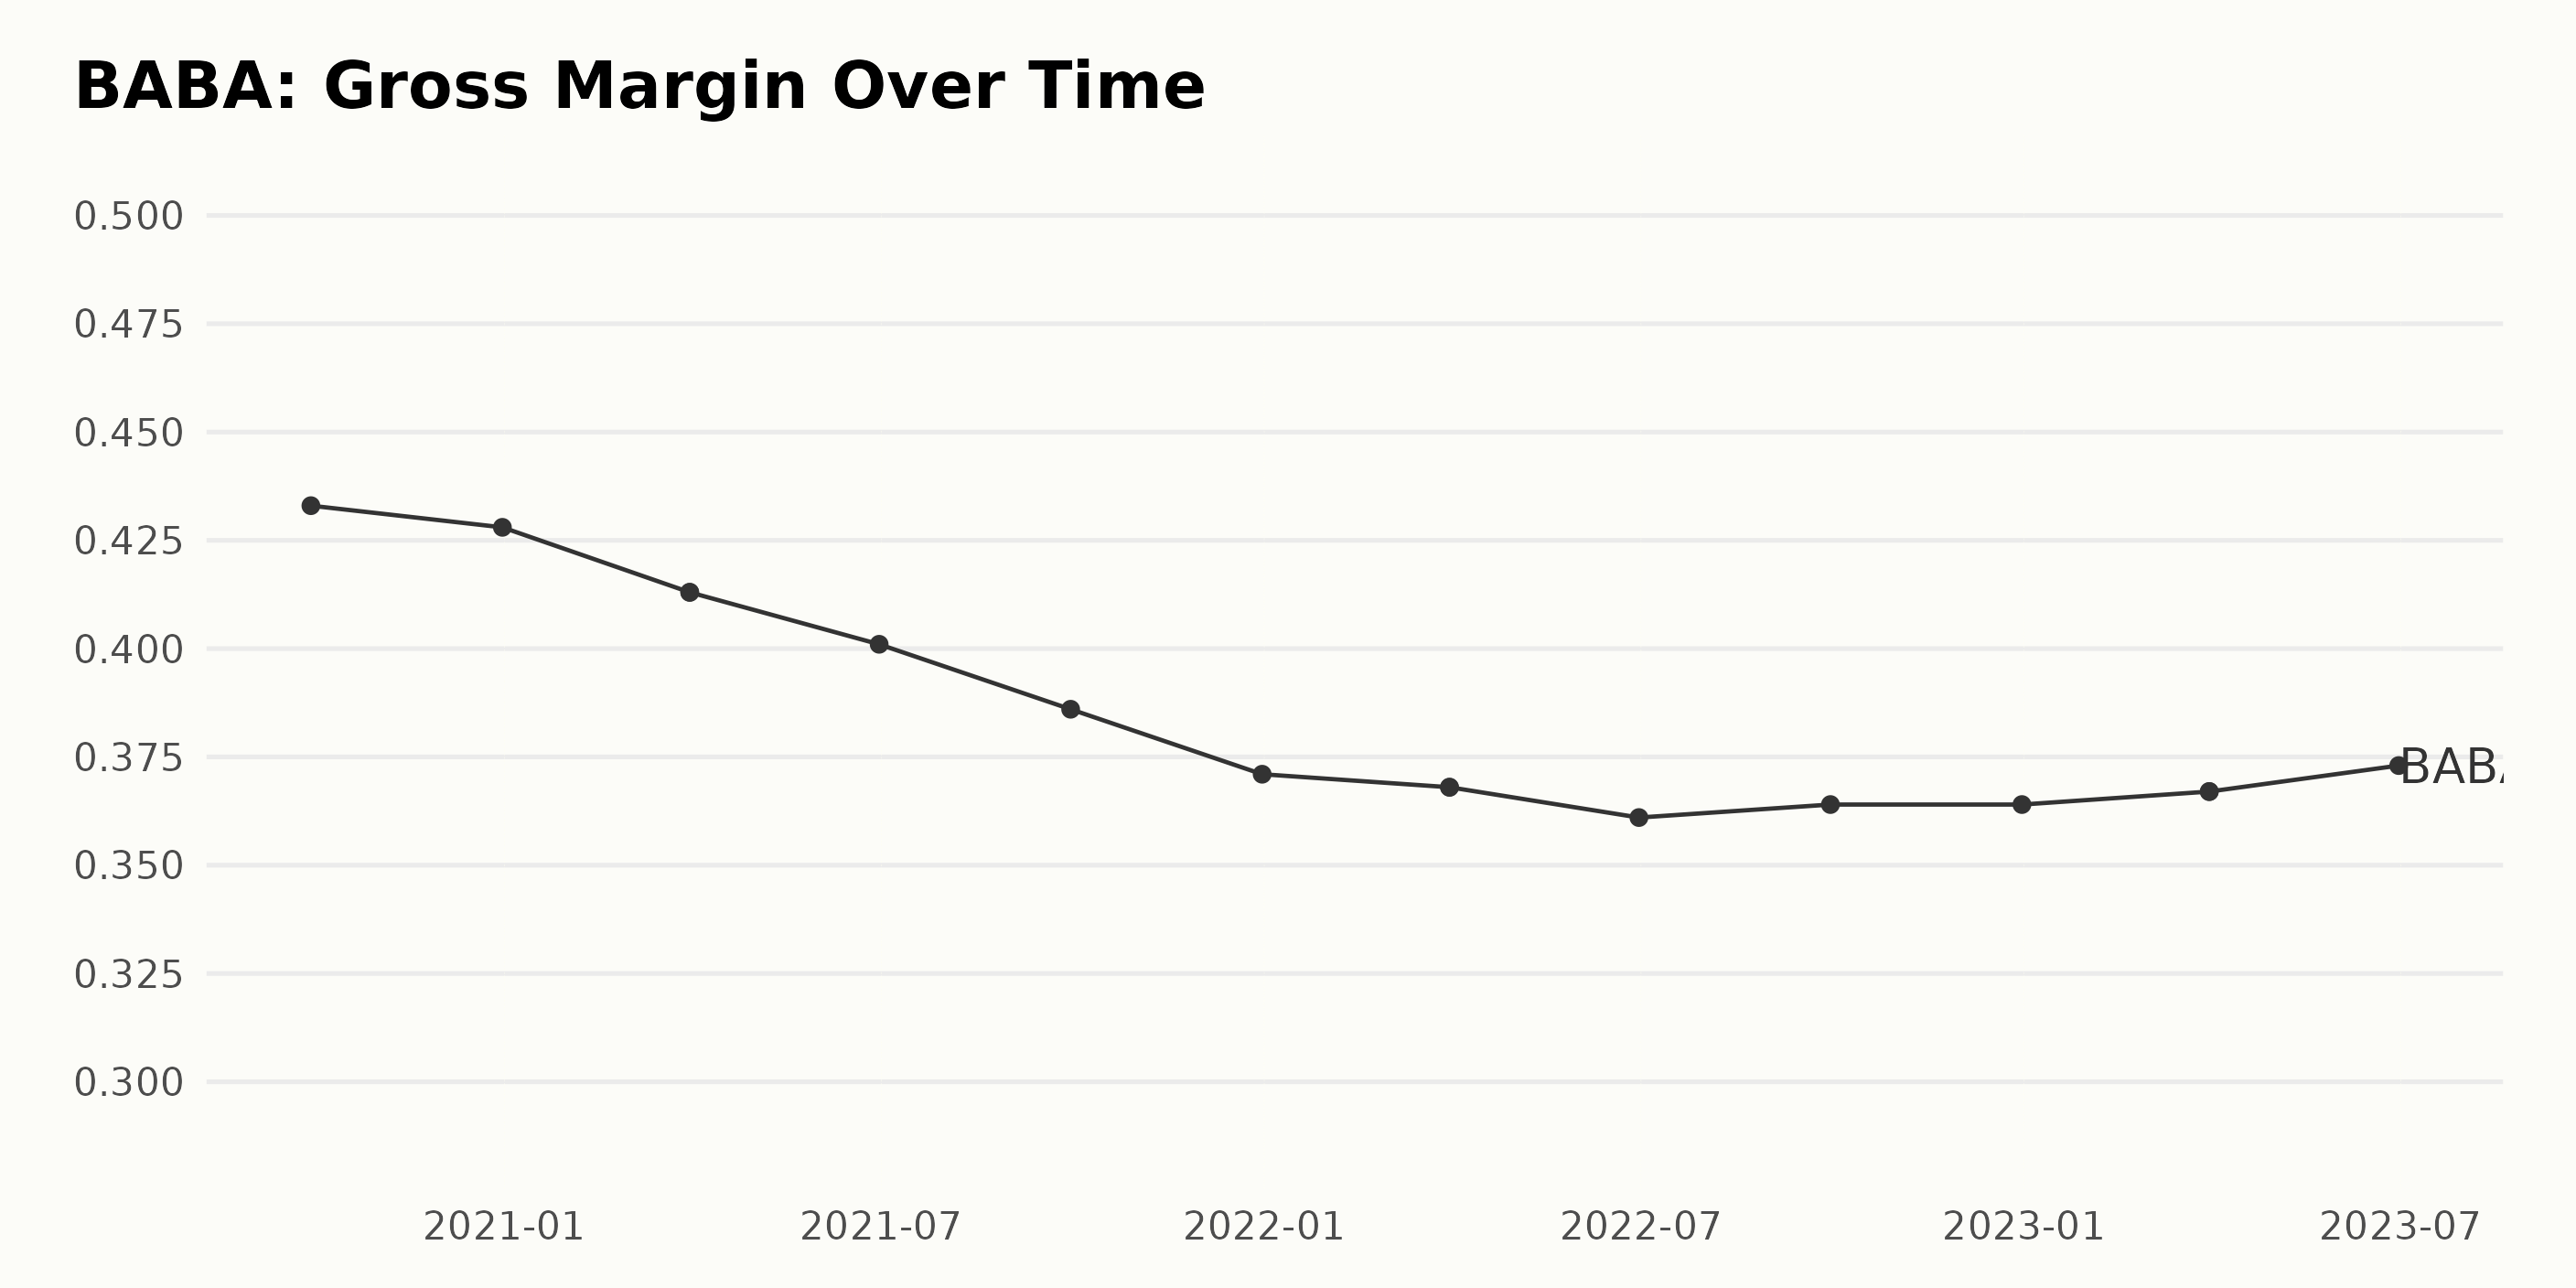
The gross margin for BABA has been experiencing a declining trend over the last three years. Here is a summary of the fluctuations during this period:
- September 30, 2020: The gross margin was at 43.3%. This was the highest value recorded in the series.
- 2021: Throughout this year, there was a consistent downward trend. From a gross margin of 42.8% in December 2020, it dropped to 38.6% by September 2021.
- 2022: The downward trend continued into 2022. Starting at 37.1% in December 2021, it slightly rebounded to 36.4% by September of that year before dropping again to 36.1% in June 2022.
- 2023 Brief Recovery: In 2023, a minor recovery was observed, with the gross margin rising from 36.7% in March to 37.3% by June.
Showing a gross margin reduction from 43.3% in September 2020 to 37.3% in June 2023. This decline represents a drop of approximately six percentage points over the observed period, signifying a decreasing growth rate in Margins for the company.
Overall, recent data indicates a slightly negative trajectory for BABA’s margin performance with a short-term upswing towards the end of the dataset.
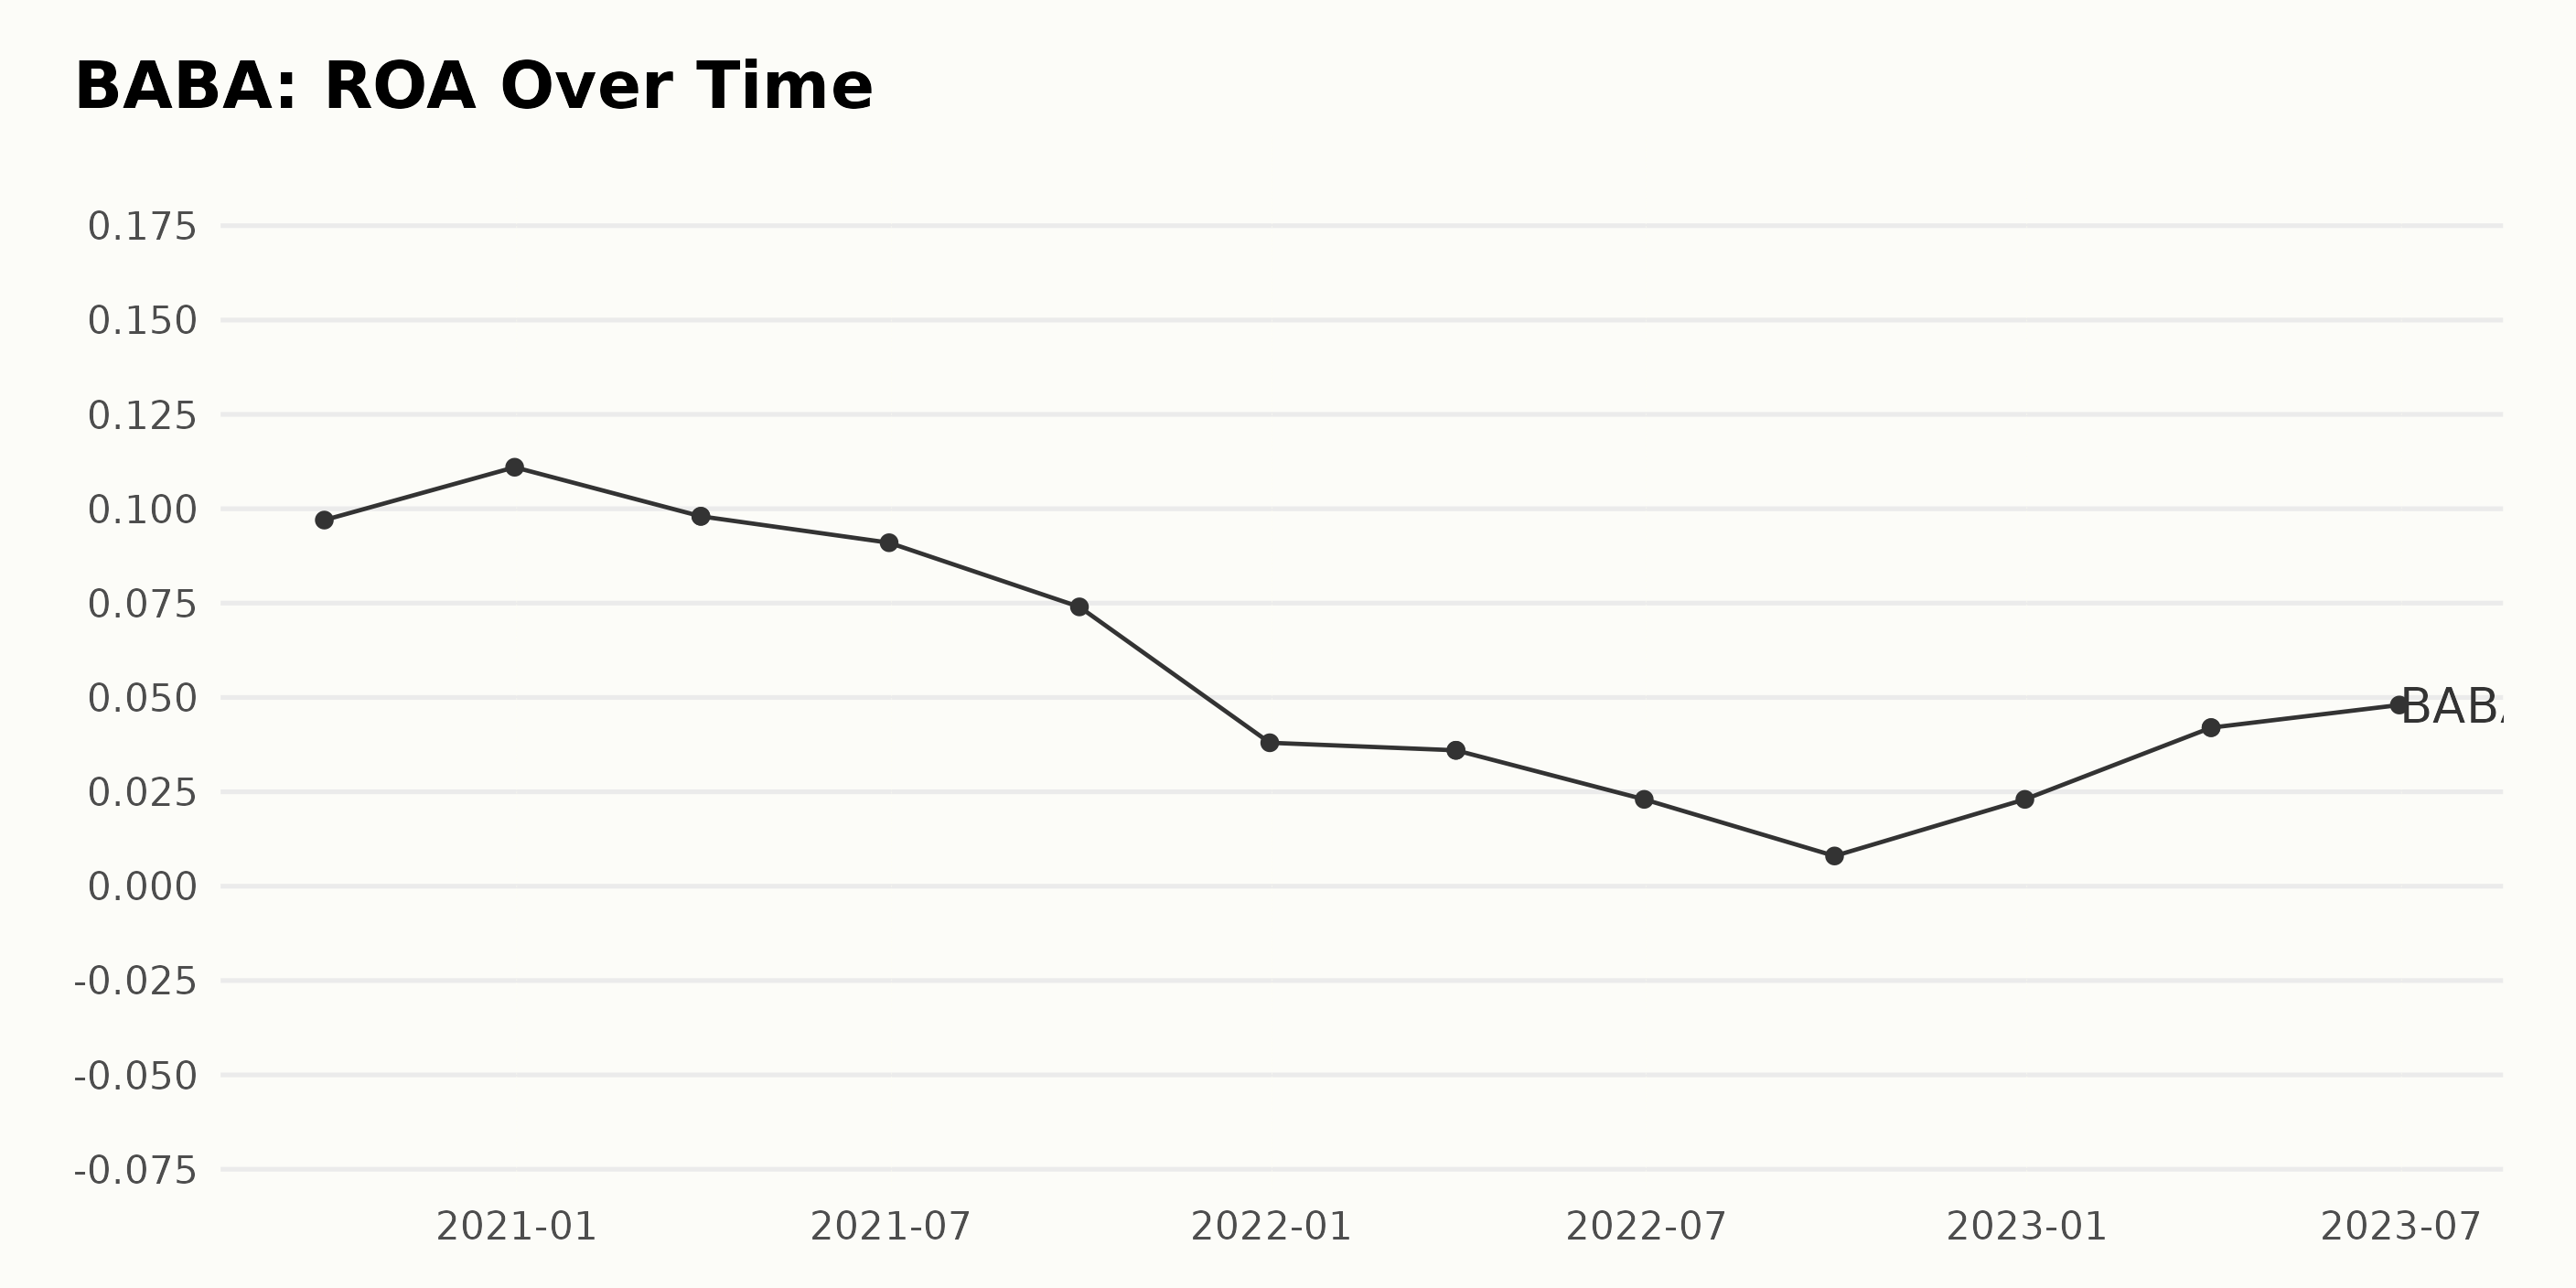
The Return On Assets (ROA) for BABA has experienced significant fluctuations in the past years.
- On September 30, 2020, the ROA was at 9.7%.
- This value slightly increased to 11.1% by the end of the year (December 31, 2020).
- The first and second quarters of 2021 showed a downward trend, with March 31 registering 9.8%, then decreasing further to 7.4% by June 30 and 9.1% by September.
- By the end of 2021, the ROA significantly dropped to 3.8% on December 31.
- The first quarter of 2022 continued this declining pattern, hitting 3.6% on March 31. Nonetheless, the values in the second quarter showed a relative decrease, reaching 2.3% on June 30.
- The most significant slide was registered in September, where the ROA dropped to a low of 0.8%.
- However, an upward trend re-emerged by the end of 2022, with the value hiking up to 2.3% on December 31.
- The first quarter of 2023 showed a continuous improvement in the ROA, recording 4.2% in March.
- This positive progression continued into the second quarter, with June registering an enhanced performance of 4.8% in ROA.
In summary, over the measured period, the ROA has decreased from an initial value of 9.7% to the current value of 4.8%. This measures a decline of about 50.5%. Despite the overall decrease, recent data does show a promising upward trend since the last quarter of 2022.
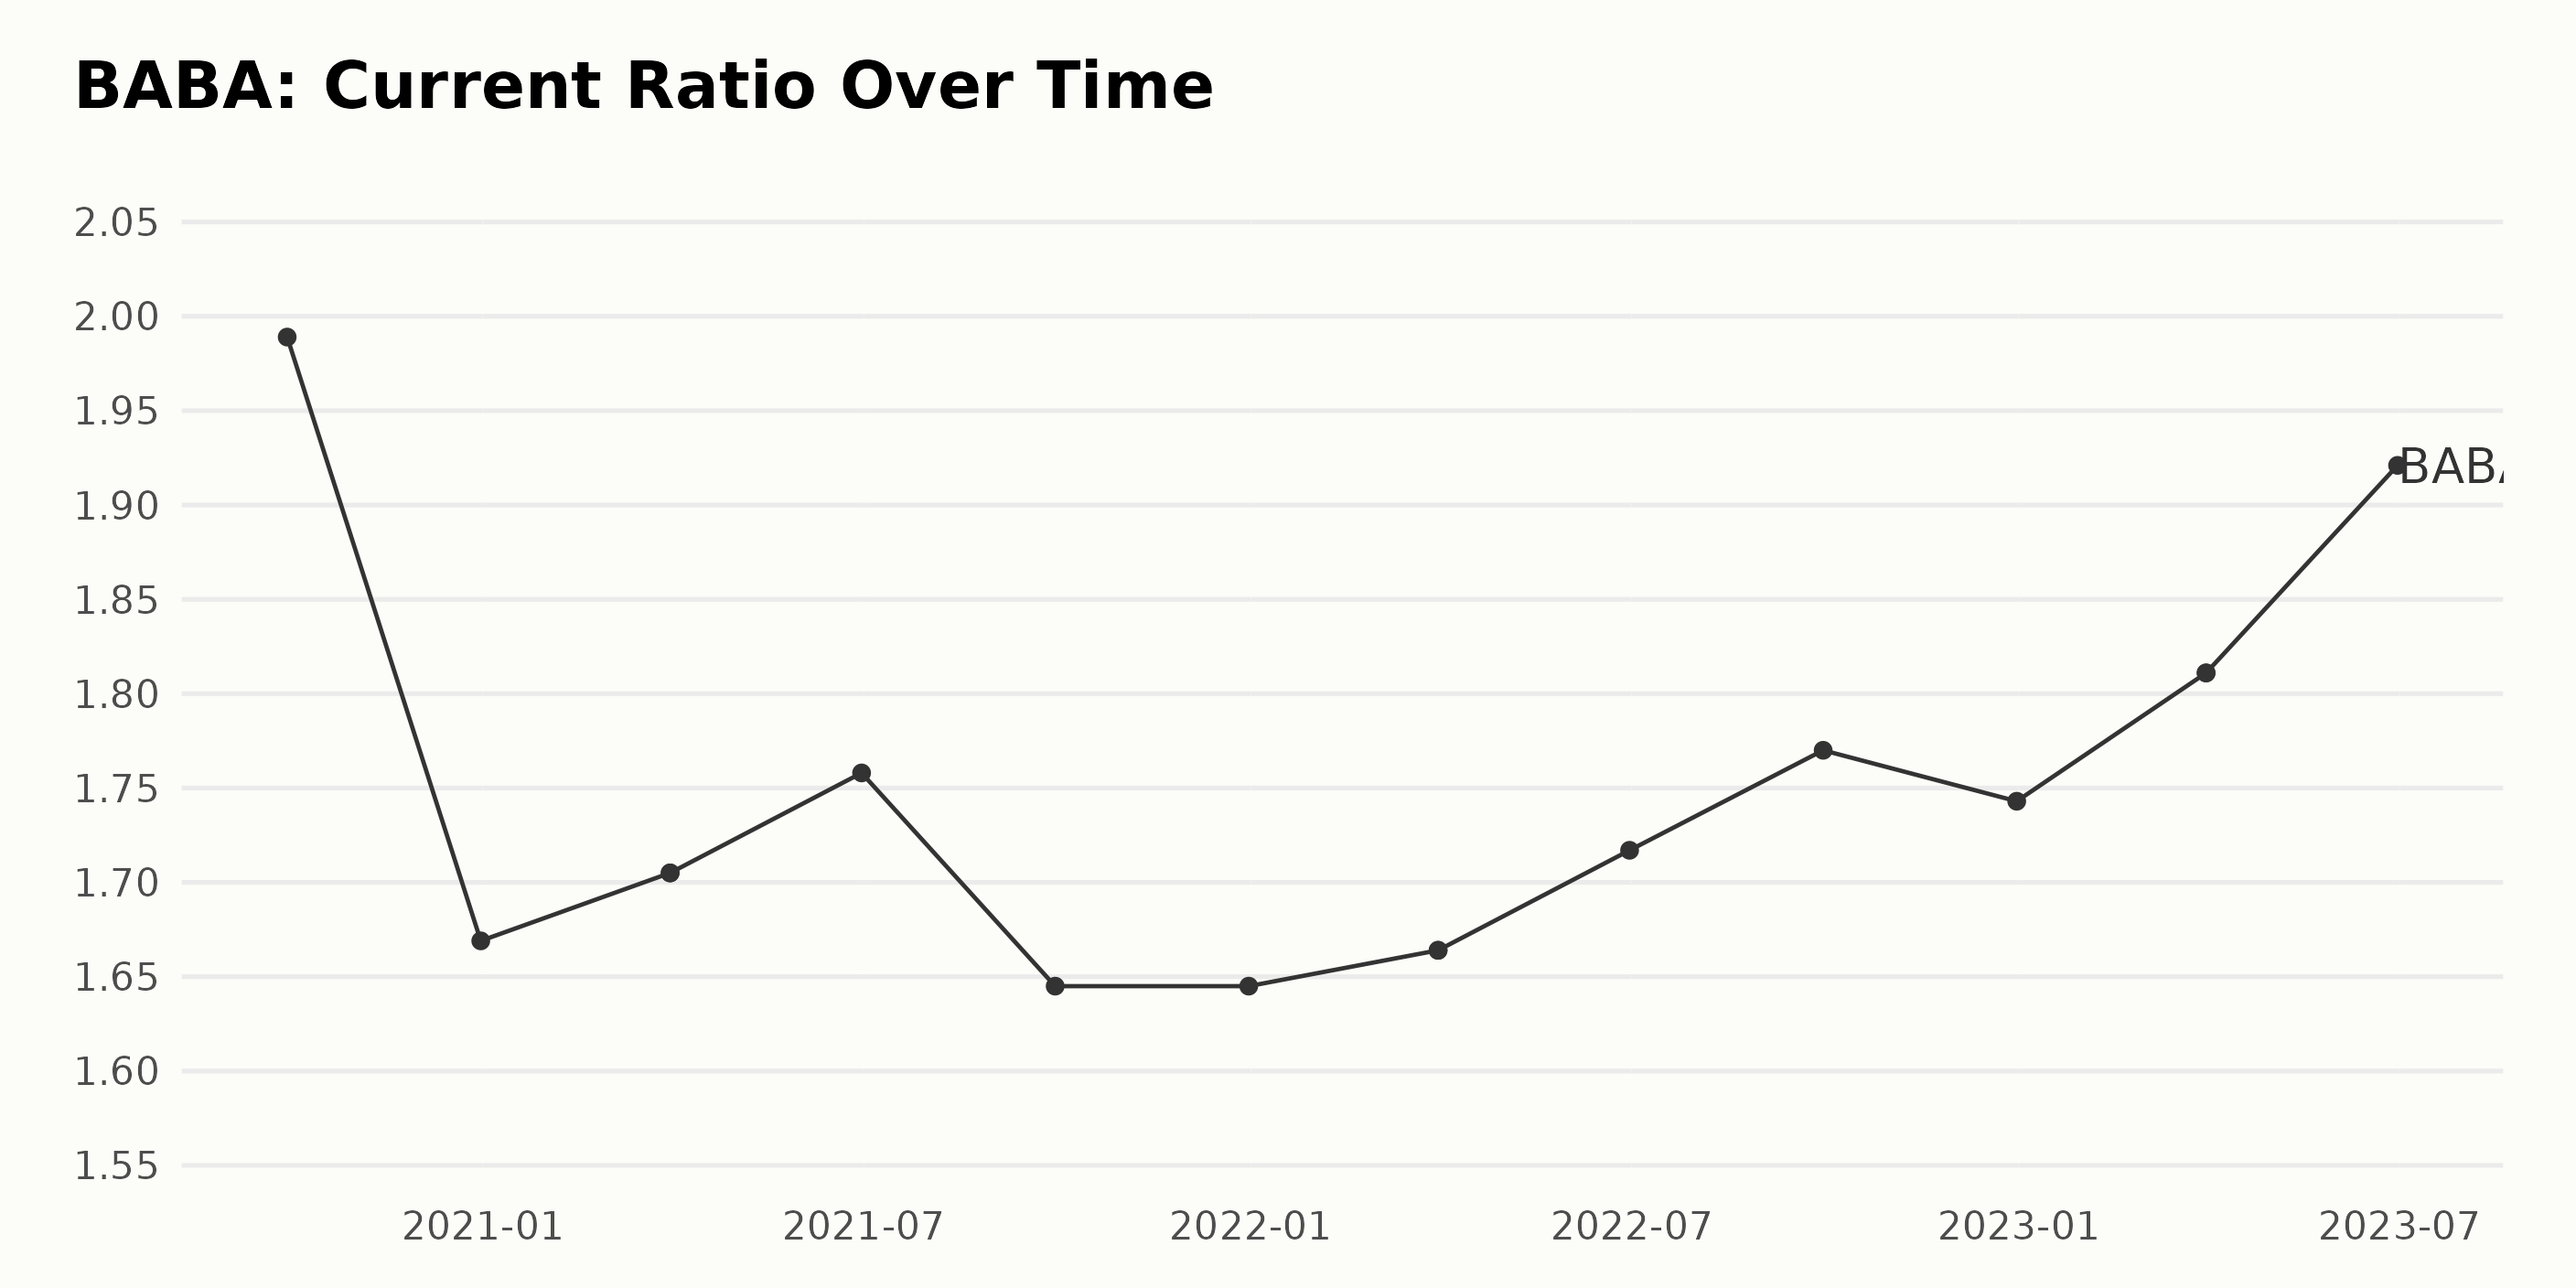
Over the past few years, the current ratio of BABA has experienced both upward and downward fluctuations. However, there has been a slight overall growth trend. Here are the significant points gathered from the data:
- Starting from September 2020, the current ratio was 1.99.
- The ratio dipped to the lowest point during this period on December 31, 2020, and September 30, 2021, at approximately 1.67.
- From December 2020, it saw an uneven recovery punctuated by minor setbacks until it rebounded to 1.81 by the end of March 2023.
- The current ratio peaked at 1.92 on June 30, 2023, marking the highest value in the series.
By calculating the growth from the first value in September 2020 (1.99) to the final value in June 2023 (1.92), we find a slight decrease over time, equivalent to roughly -3.5%.
Although there have been dips and recoveries in between, including a noticeable dip toward the end of 2020 and September 2021, with subsequent recoveries, the most recent data suggests a gradual increase from the beginning of 2022, climaxing at 1.92 on June 30, 2023. We note an overall uptrend, particularly from early 2022 to mid-2023, despite the slight negative growth rate when comparing the first and last values.
BABA’s analyst price target shows a trend of continuous adjustments over time, with a more significant downward trend in the long run. A quick summary of the trend and fluctuations is as follows:
Long-term Downward Trend: The analyst price target of BABA started at $254.5 in November 2021 and fell to $140.3 by August 2023. This represents a decline of approximately 44.9%. The largest drop occurred between May 2022 and July 2022, where the value dropped from $180 to $145, a decrease of 19.4%.
Short-term Fluctuations: Within this long-term downward trend, there have been multiple instances of minor rises and plateaus. Significant ones include when the price target increased from $209 in February 2022 to $216.9 in March 2022, an increase of 3.8%. The price target remained constant at $160 for about a month between June 2022 and July 2022 and $144.5 from October 2022 to November 2022.
Recent Trend: The analyst price target seems to have stabilized slightly in recent months, fluctuating around $140 to $145 from December 2022 onwards. It finally settled at $140.3 in August 2023. These figures illustrate a turbulent period for BABA, with a strong general trend of declining price targets from analysts, albeit small periods of stability or minor growth.

Alibaba’s Share Prices in 2023: A Trajectory of Volatility and Resilient Recovery
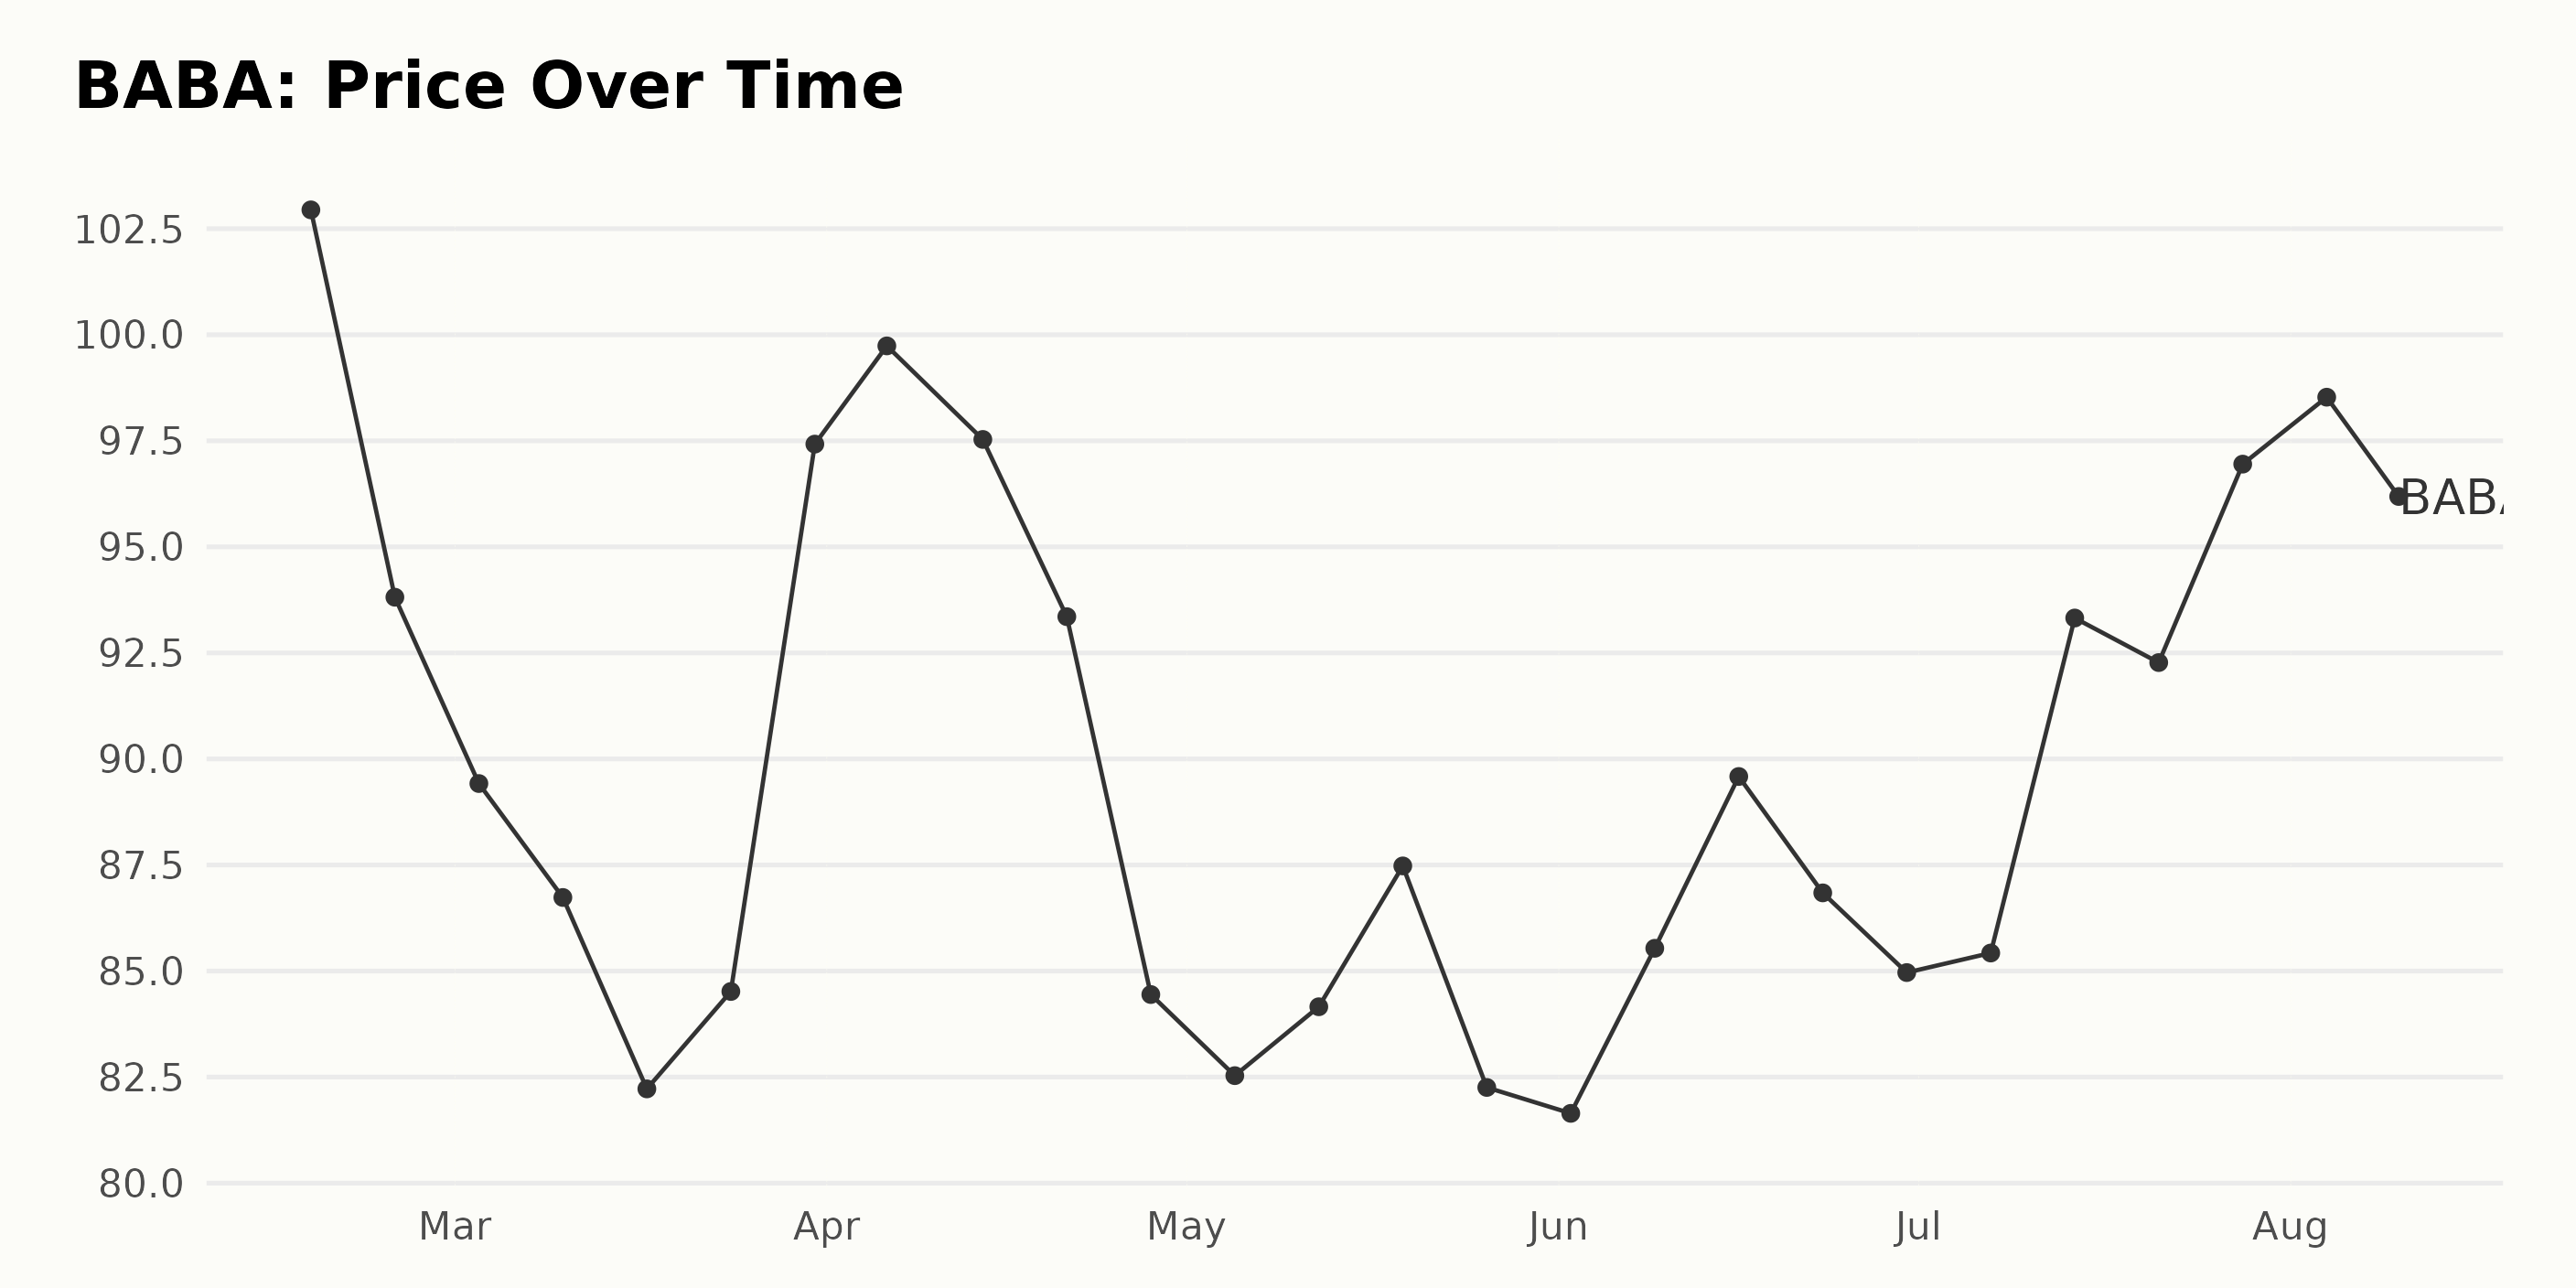
The trend in the share prices for BABA from February to August 2023 shows a general trend of volatility and fluctuation. However, upon close observation, a decelerating negative growth rate is visible initially, followed by a slight recovery. Here’s a breakdown:
- On February 17, 2023, the share price was $102.94.
- Through the remainder of February and March 2023, the price underwent a marked decrease reaching as low as $82.22 on March 17. However, there was a spike towards the end of the month, with the price rising to $97.42 on March 31.
- During April 2023, the price experienced another round of volatility, first rising, then falling again, concluding the month at $84.45 on April 28.
- Between May and early June 2023, the price continued its decline, hitting a low of $81.64 on June 2, suggesting a decelerating negative growth rate.
- From mid-June to August 2023, the trend shifted, with the share price generally increasing, barring a few slumps, and ended at $99.21 on August 10, suggesting a recovery period.
In conclusion, the data shows that BABA had a rollercoaster of a year in terms of its share price performance. Despite several downturns, a moderately positive trend in the latter months could indicate improving investor confidence.
Here is a chart of BABA’s price over the past 180 days.
Assessing Alibaba’s Performance: Trends in Quality, Momentum, and Growth Metrics
The POWR Ratings grade of BABA, a stock from the China category, has shown some fluctuations over the months. Let’s analyze it based on the provided data.
- BABA started with a C (Neutral) grade in February 2023, holding the #27 rank among the 45 stocks in the China category.
- Over the weeks until mid-May 2023, while its grade remained at C (Neutral), the rank within the category showed an inconsistent pattern, fluctuating between #19 and #27.
- In the week of May 20, 2023, there was a positive change when its POWR Grade improved to B (Buy). The stock also bettered its rank to #15.
- This improvement, however, was not stable as the grade dithered between B (Buy) and C (Neutral) in the subsequent weeks.
As for the latest values:
- POWR Grade: C (Neutral)
- Rank in Category: #19 out of 45.
Though the POWR grade has oscillated between B (Buy) and C (Neutral), BABA has managed to maintain its position predominantly better than the #20 position for most of the year, which is relatively good considering the benchmark of 45 stocks in the category.
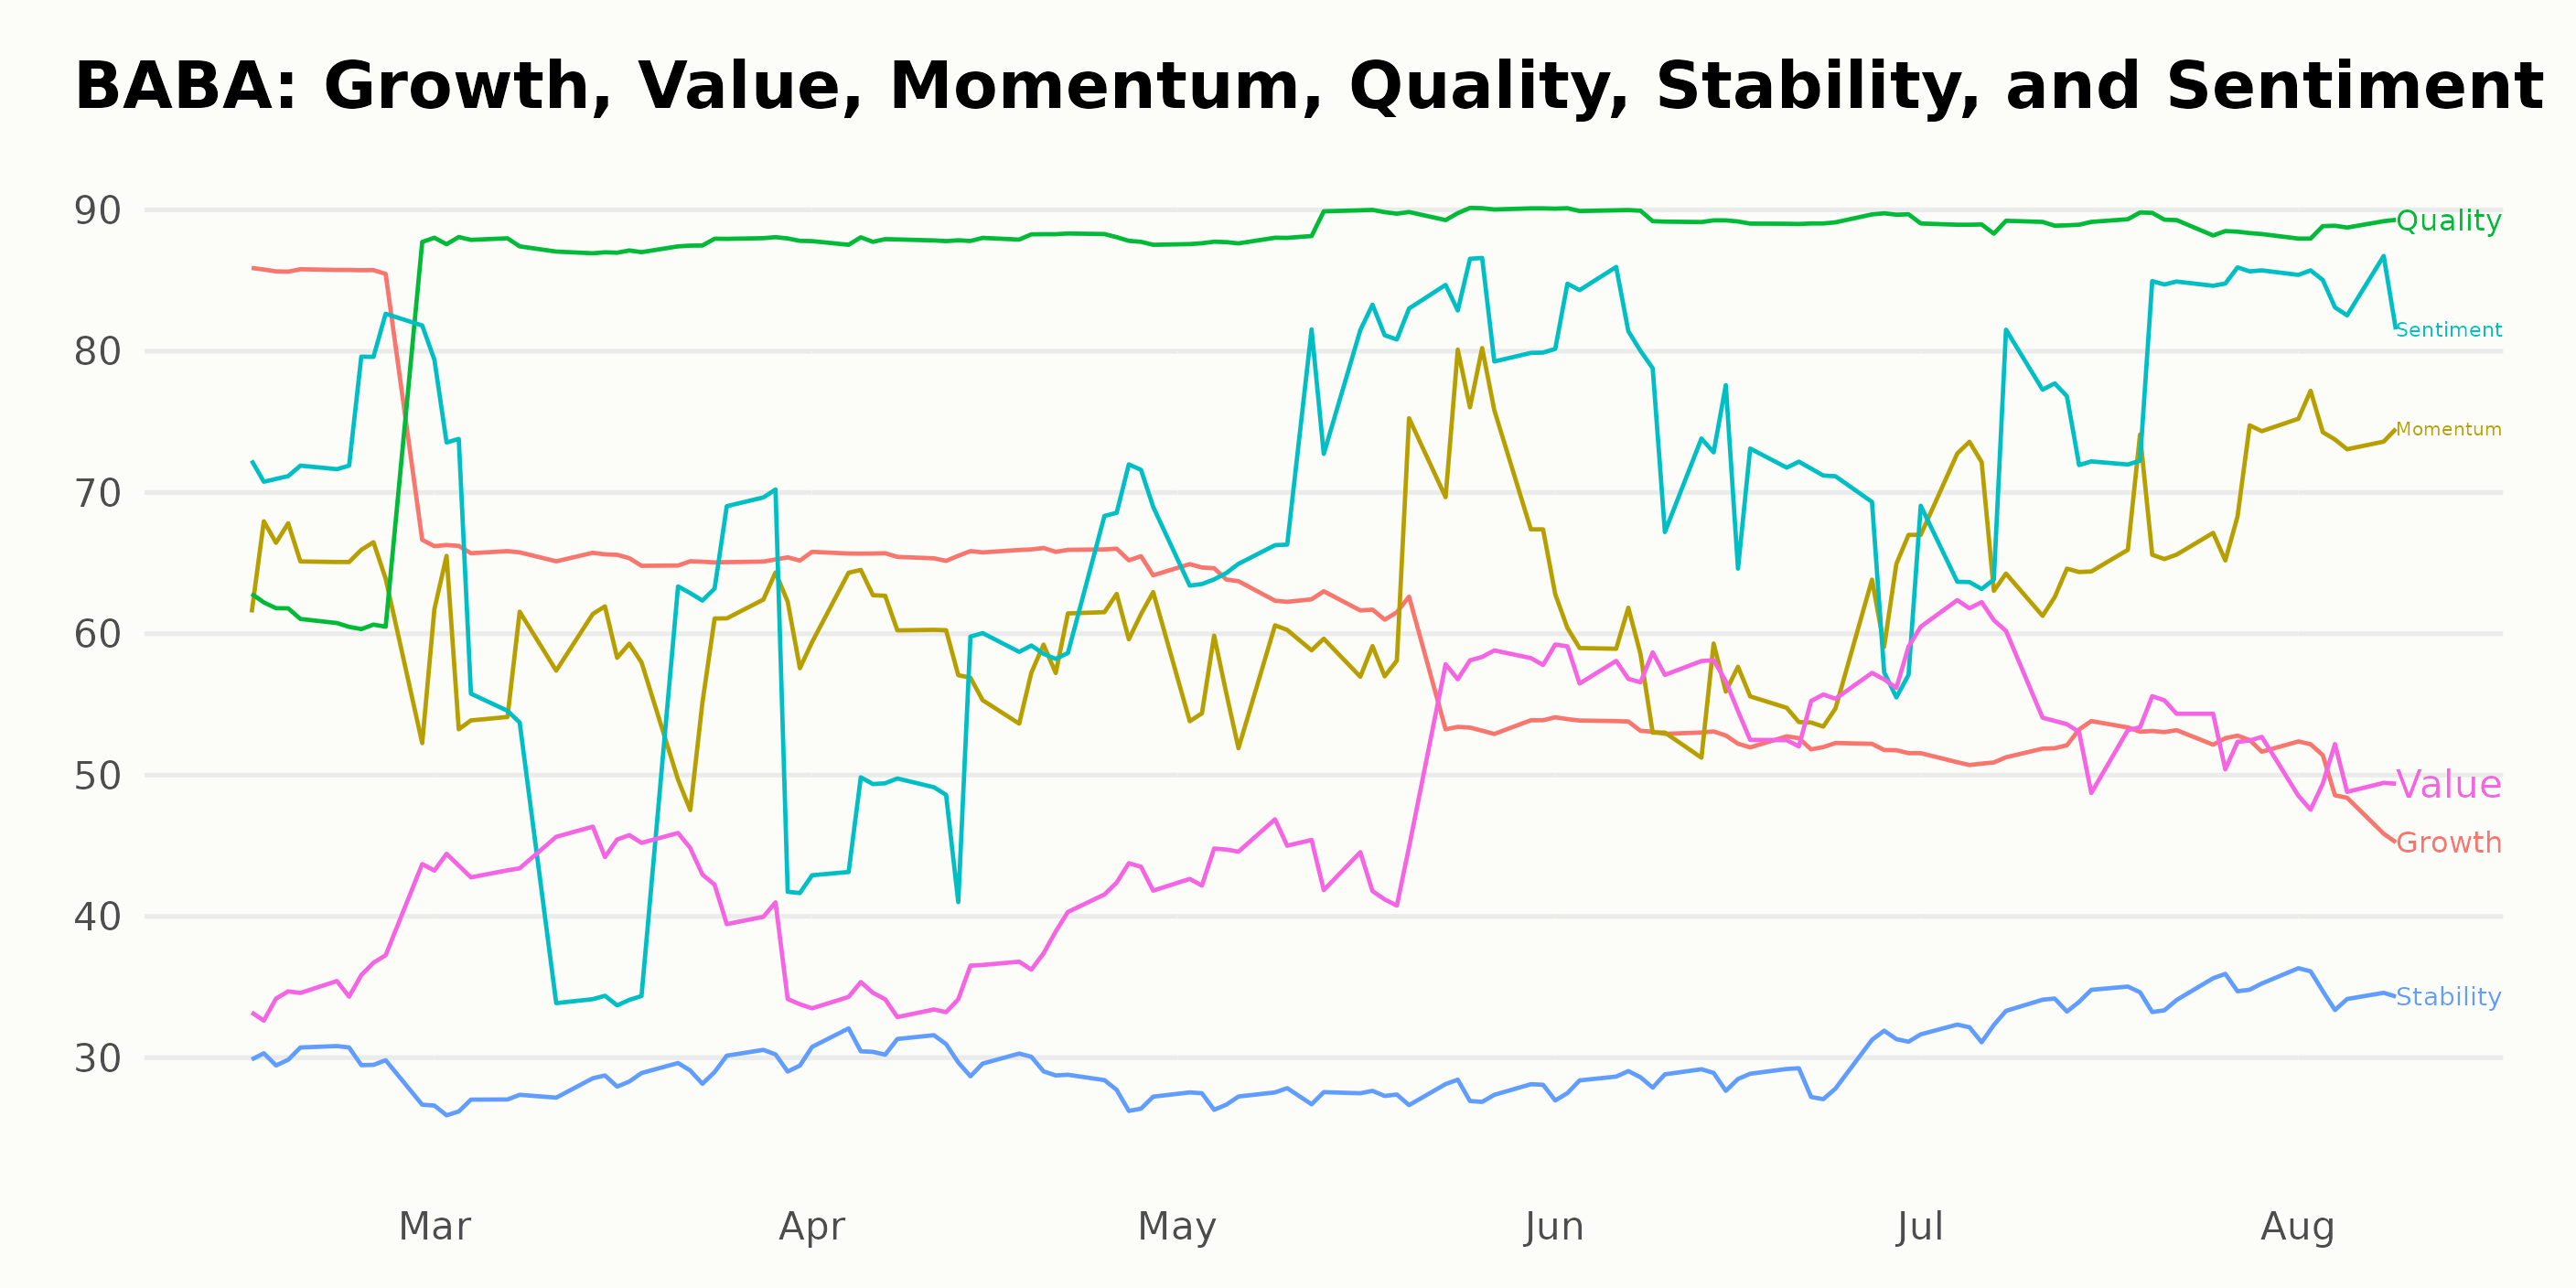
The POWR Ratings for BABA highlight significant trends across various dimensions. The three dimensions that are most noteworthy in this particular case are Quality, Momentum, and Growth.
Quality: The Quality ratings for BABA show a consistent upward trajectory.
- February 2023: 64
- March 2023: 88
- April 2023: 88
- May 2023: 89
- June 2023: 89
- July 2023: 89
- August 2023: 89
The continued high ratings in Quality underline the strength of the corporation’s fundamentals, even in a volatile market environment.
Momentum: Another notable dimension is Momentum, which has seen a general rise over time.
- February 2023: 64
- March 2023: 58
- April 2023: 60
- May 2023: 64
- June 2023: 58
- July 2023: 67
- August 2023: 75
The increase in momentum indicators typically suggests an established trend, signifying that the stock is gaining strength over the period.
Growth: The Growth dimension has seen varied ratings but showed a general downward trend:
- February 2023: 84
- March 2023: 65
- April 2023: 66
- May 2023: 60
- June 2023: 53
- July 2023: 52
- August 2023: 49
Though the growth dimension started quite strong in February 2023, it followed a downward slope, causing some concerns related to the company’s future revenue and earnings performance.
How does Alibaba Group Holding Limited (BABA) Stack Up Against its Peers?
Other stocks in the China sector that may be worth considering are FinVolution Group (FINV - Get Rating), Tarena International, Inc. (TEDU - Get Rating), and China Automotive Systems, Inc. (CAAS - Get Rating) – they have better POWR Ratings.
What To Do Next?
Discover 10 widely held stocks that our proprietary model shows have tremendous downside potential. Please make sure none of these “death trap” stocks are lurking in your portfolio:
Want More Great Investing Ideas?
BABA shares were trading at $95.14 per share on Friday afternoon, down $4.07 (-4.10%). Year-to-date, BABA has gained 8.00%, versus a 17.14% rise in the benchmark S&P 500 index during the same period.
About the Author: Anushka Dutta

Anushka is an analyst whose interest in understanding the impact of broader economic changes on financial markets motivated her to pursue a career in investment research. More...
More Resources for the Stocks in this Article
| Ticker | POWR Rating | Industry Rank | Rank in Industry |
| BABA | Get Rating | Get Rating | Get Rating |
| FINV | Get Rating | Get Rating | Get Rating |
| TEDU | Get Rating | Get Rating | Get Rating |
| CAAS | Get Rating | Get Rating | Get Rating |


