
In the most recent quarter, CGI Inc. (GIB) launched a comprehensive cost optimization program to enhance operational efficiencies. This strategic move involves refining its global real estate portfolio, increasing automation usage, and globalization of delivery, with a particular focus on administrative functions.
In the quarter, GIB exceeded projections in both revenue and earnings by a substantial 6.3% and 5.5%, respectively. Additionally, the company observed an 8% year-over-year revenue increment and a 14.7% EPS growth.
“We are taking the actions necessary to strengthen further our capacity to continue delivering value for shareholders. This includes cost optimization and strategic investments to advance the next wave of innovation and growth,” said George D. Schindler, President and Chief Executive Officer.
However, the company’s stock price has been experiencing a decline lately, and I believe this is not the most favorable entry point in the stock. In order to better comprehend the situation, it would be advantageous to examine some of its critical financial metrics in greater detail.
CGI Group Inc.’s Financial Health: Analyzing Growth and Stability of Key Metrics
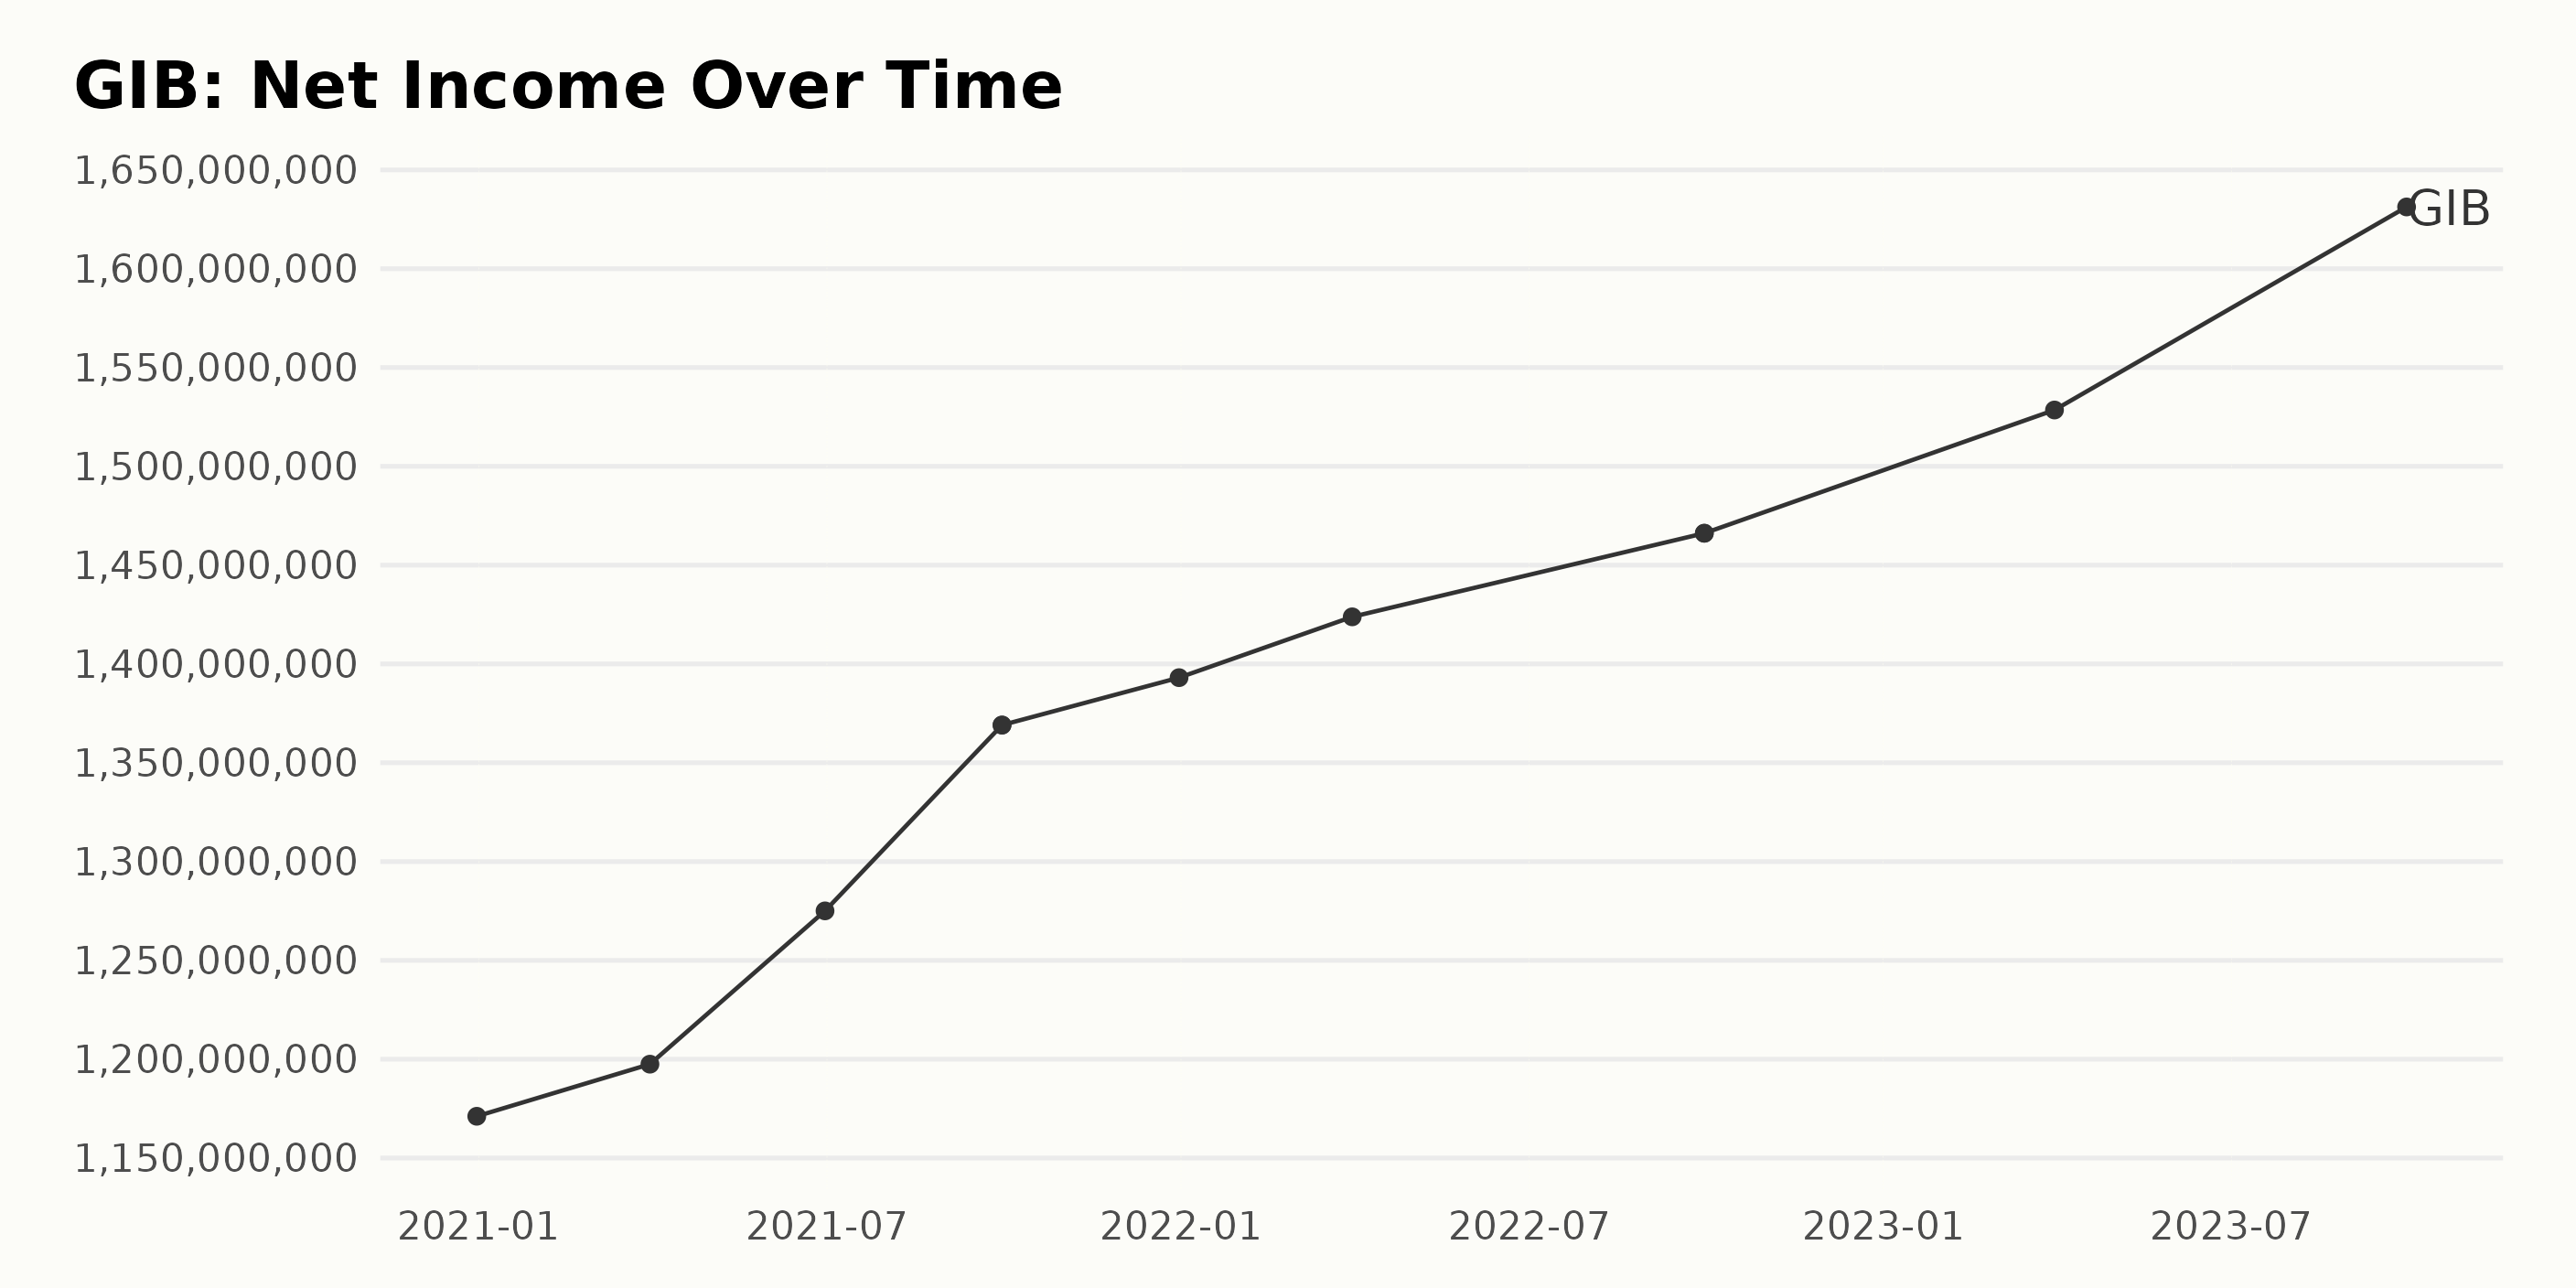
The trailing-12-month Net Income of GIB has been on a steady upward trend over the past few years, according to the provided series of data. Some key points to note are:
- Starting at $1.17 billion as of December 31, 2020, the net income showed consistent quarterly growth throughout the period considered.
- The highest recorded net income was as recent as September 30, 2023, with a value of $1.63 billion.
- Net Income for the company increased significantly by about $460 million from $1.17 billion in December 2020 to $1.63 billion in September 2023.
- This represents a substantial overall growth rate of approximately 39% between December 2020 and September 2023.
- No major fluctuations were noticed during this period; an increasing pattern was prevalent.
- Recent data in 2023 reveals that GIB’s net income has been maintaining steady growth, inching from $1.52 billion as of March 31, 2023, to $1.63 billion as of September 30, 2023.
Overall, CGI Group Inc.’s financial health appears strong, with steady growth in its net income over the observed period. The continued trend indicates a positive financial outlook for the company, barring any unforeseen circumstances.
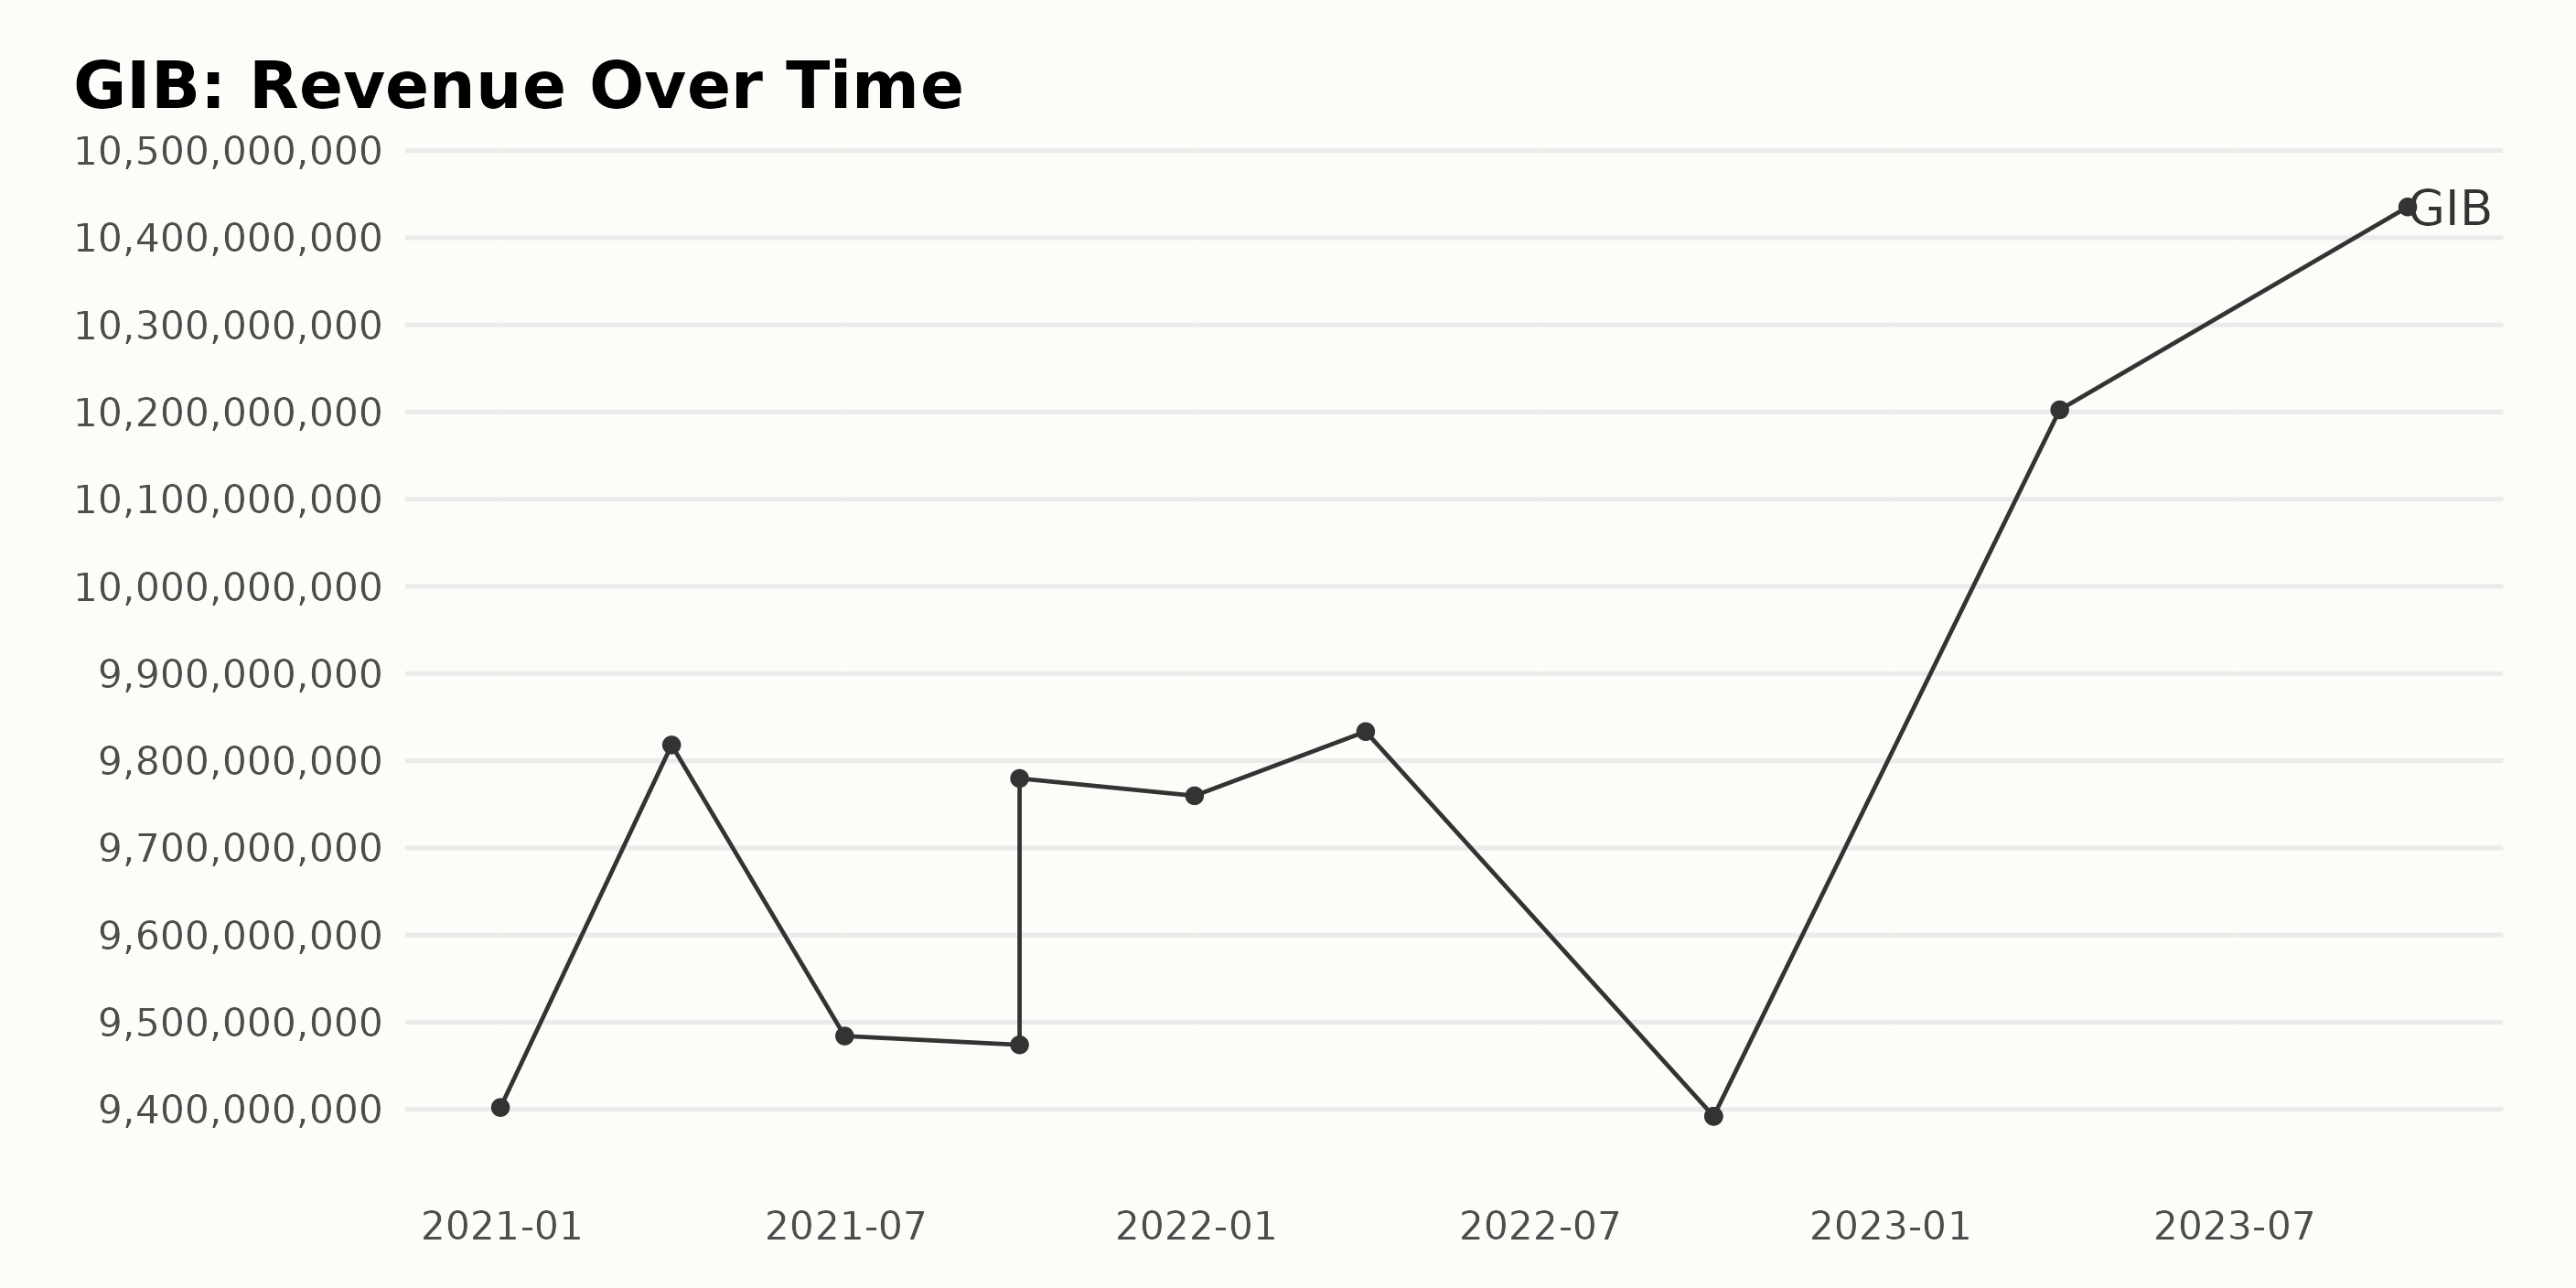
The trend and fluctuations of the trailing-12-month revenues of GIB can be summarized as follows:
- On December 31, 2020, the Revenue was $9.40 billion.
- It then saw a growth to $9.82 billion by March 31, 2021.
- The Revenue experienced a dip to $9.48 billion by June 30, 2021, which marginally decreased further to $9.47 billion by September 30, 2021.
- The Revenue again increased to $9.78 billion on the same date, maintaining near this level at $9.76 billion by December 31, 2021.
- The first quarter of 2022 showed a slight rise to $9.83 billion.
- However, by September 30, 2022, there was a reduction to $9.39 billion, which remained constant on the same date.
- By March 31, 2023, there was a significant jump in Revenue to $10.20 billion, which again increased to $10.44 billion by September 30, 2023.
From these data points, it can be observed that GIB’s revenue experienced fluctuations throughout the years 2020 to 2023, with periods of increase and decrease. However, when considering the period from December 31, 2020, to September 30, 2023, the revenue demonstrated a net growth rate. Specifically, the last value ($10.44 billion) reflected a substantial increase from the first value ($9.40 billion). However, more emphasis should be placed on the recent data, noting the significant growth from $9.39 billion in September 2022 to $10.44 billion in September 2023. This represents a considerable growth over a year. In conclusion, recent data suggests a potentially positive future trend in GIB’s revenue.
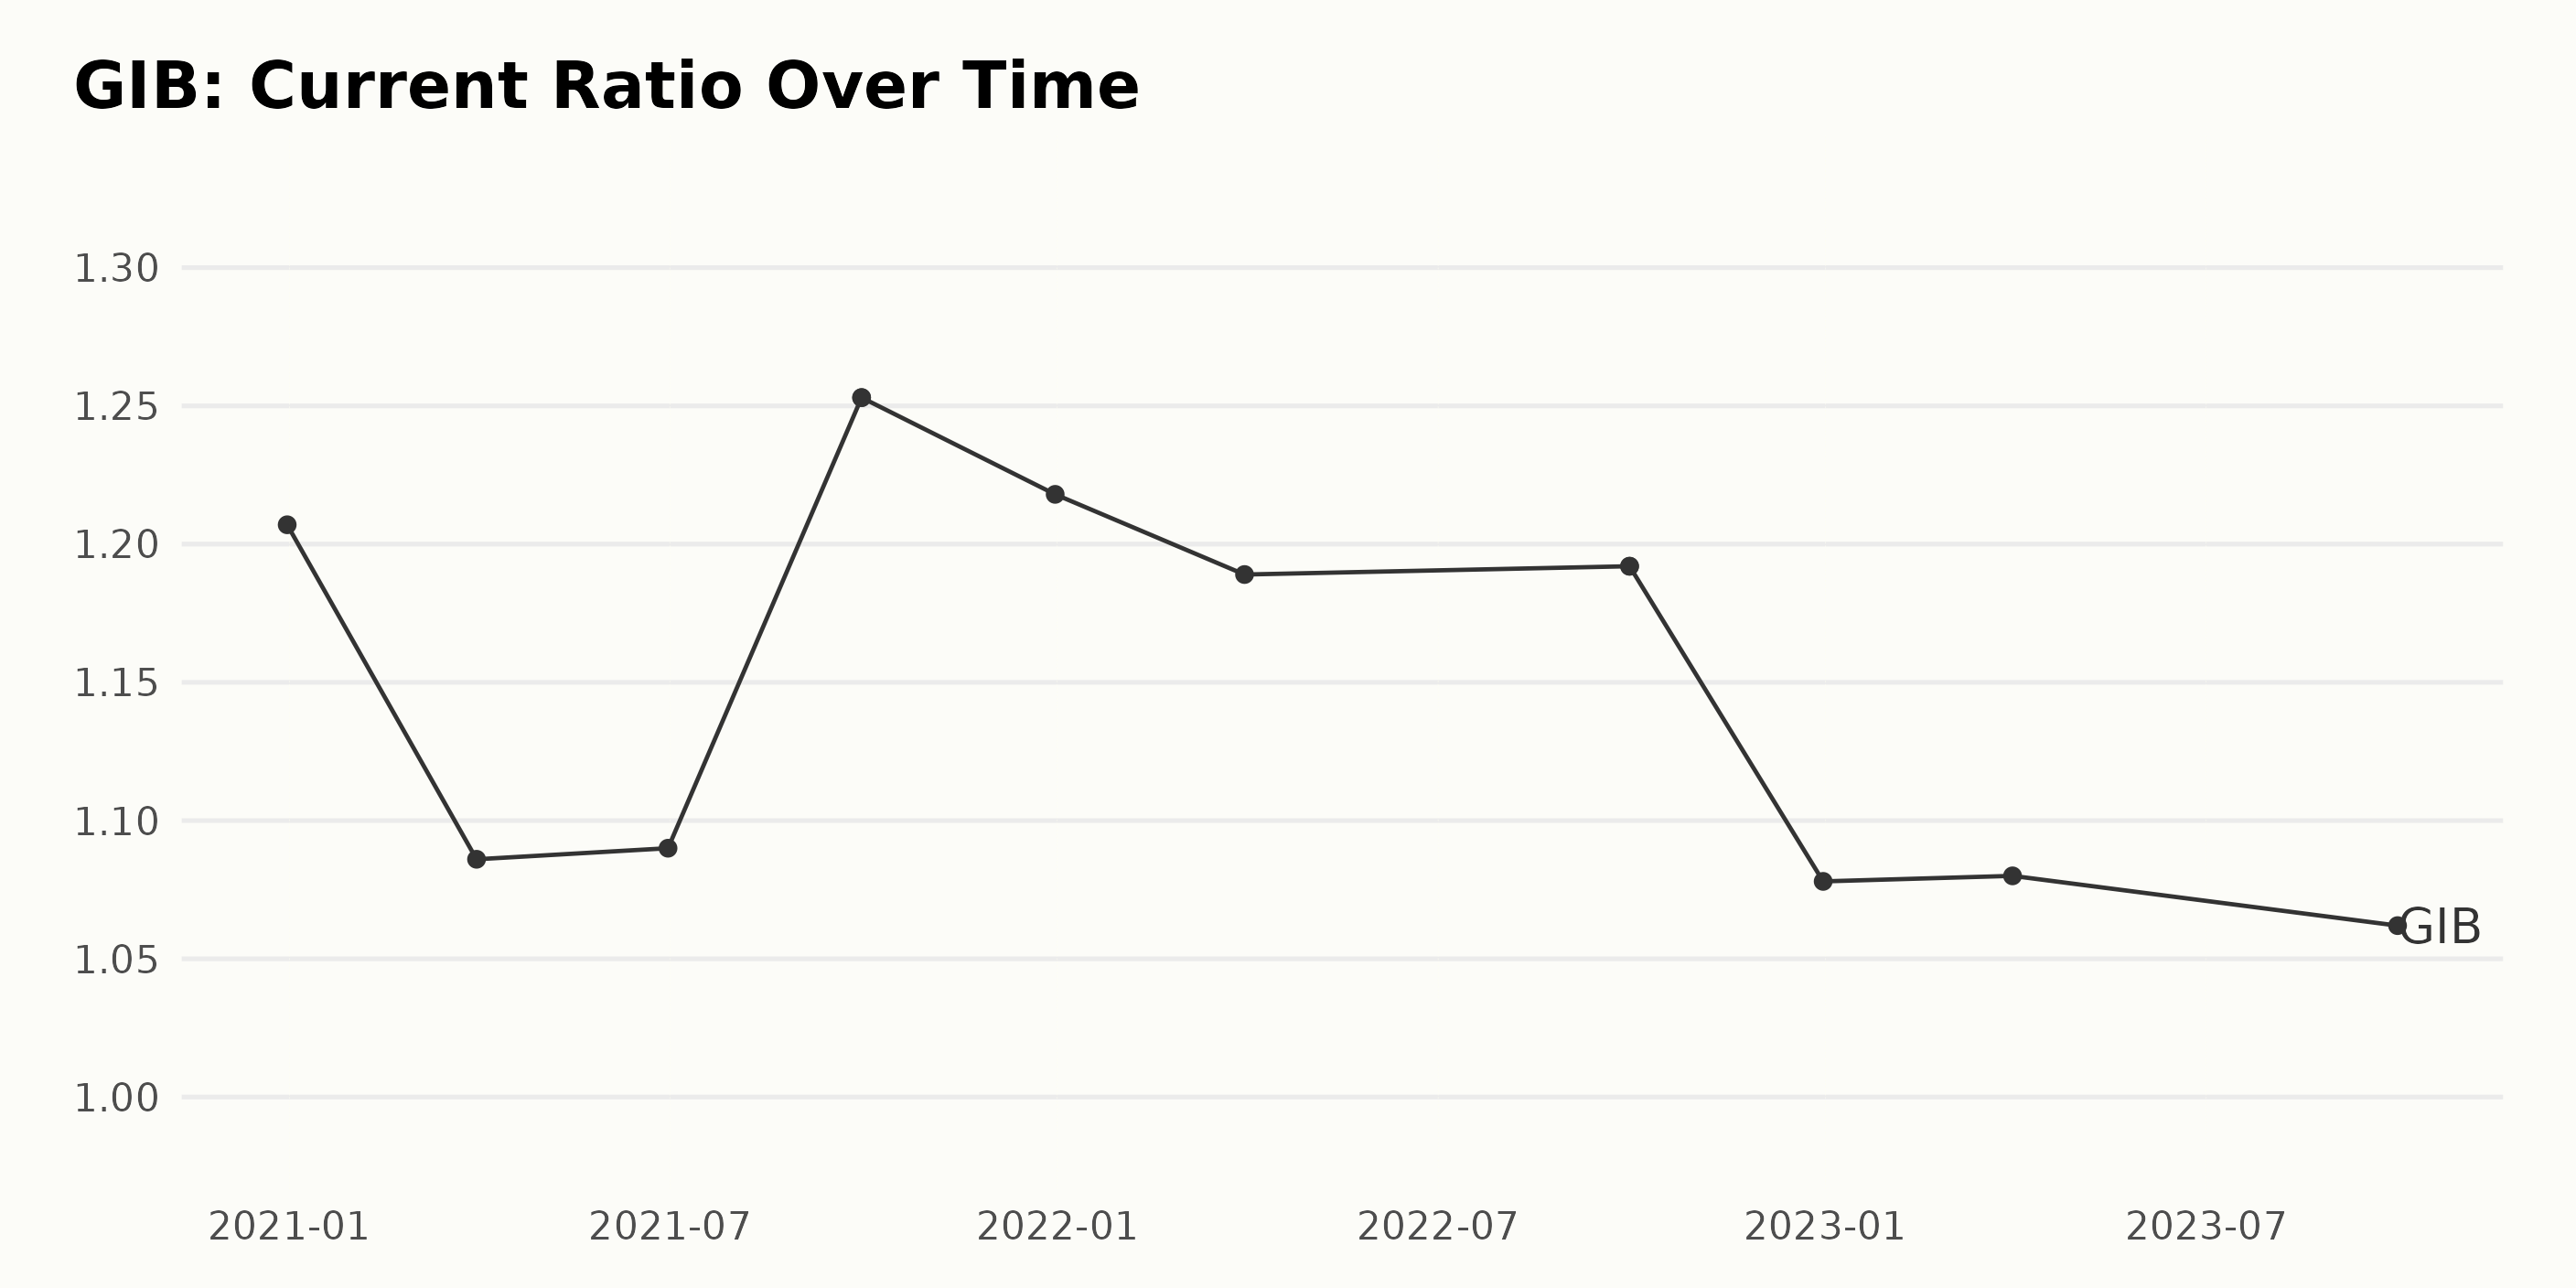
The data series reflects the fluctuation in the Current Ratio of GIB over the course of several years.
- At the start of the observed period, on December 31, 2020, CGI Group Inc. had a Current Ratio of 1.21.
- The Current Ratio then fell slightly to 1.09 by June 30, 2021, before it experienced a notable rise to 1.25 as of September 30, 2021, which remained the same in the following quarter.
- Subsequently, the ratio began to gradually decrease, reaching 1.19 on March 31, 2022 and remaining nearly the same at 1.19 by the end of September 2022.
- However, there was a substantial decrease towards the end of 2022, with the Current Ratio falling to 1.08 on December 31.
- The mild fluctuation persisted into 2023, where the Current Ratio marginally rose to 1.08 as of March 31, before seeing a small dip to 1.06 by September 30.
From the starting point to the most recent value, the Current Ratio has experienced a decrease of approximately -11%. This suggests that the ability of CGI Group Inc. to cover its short-term obligations has slightly weakened over this period.
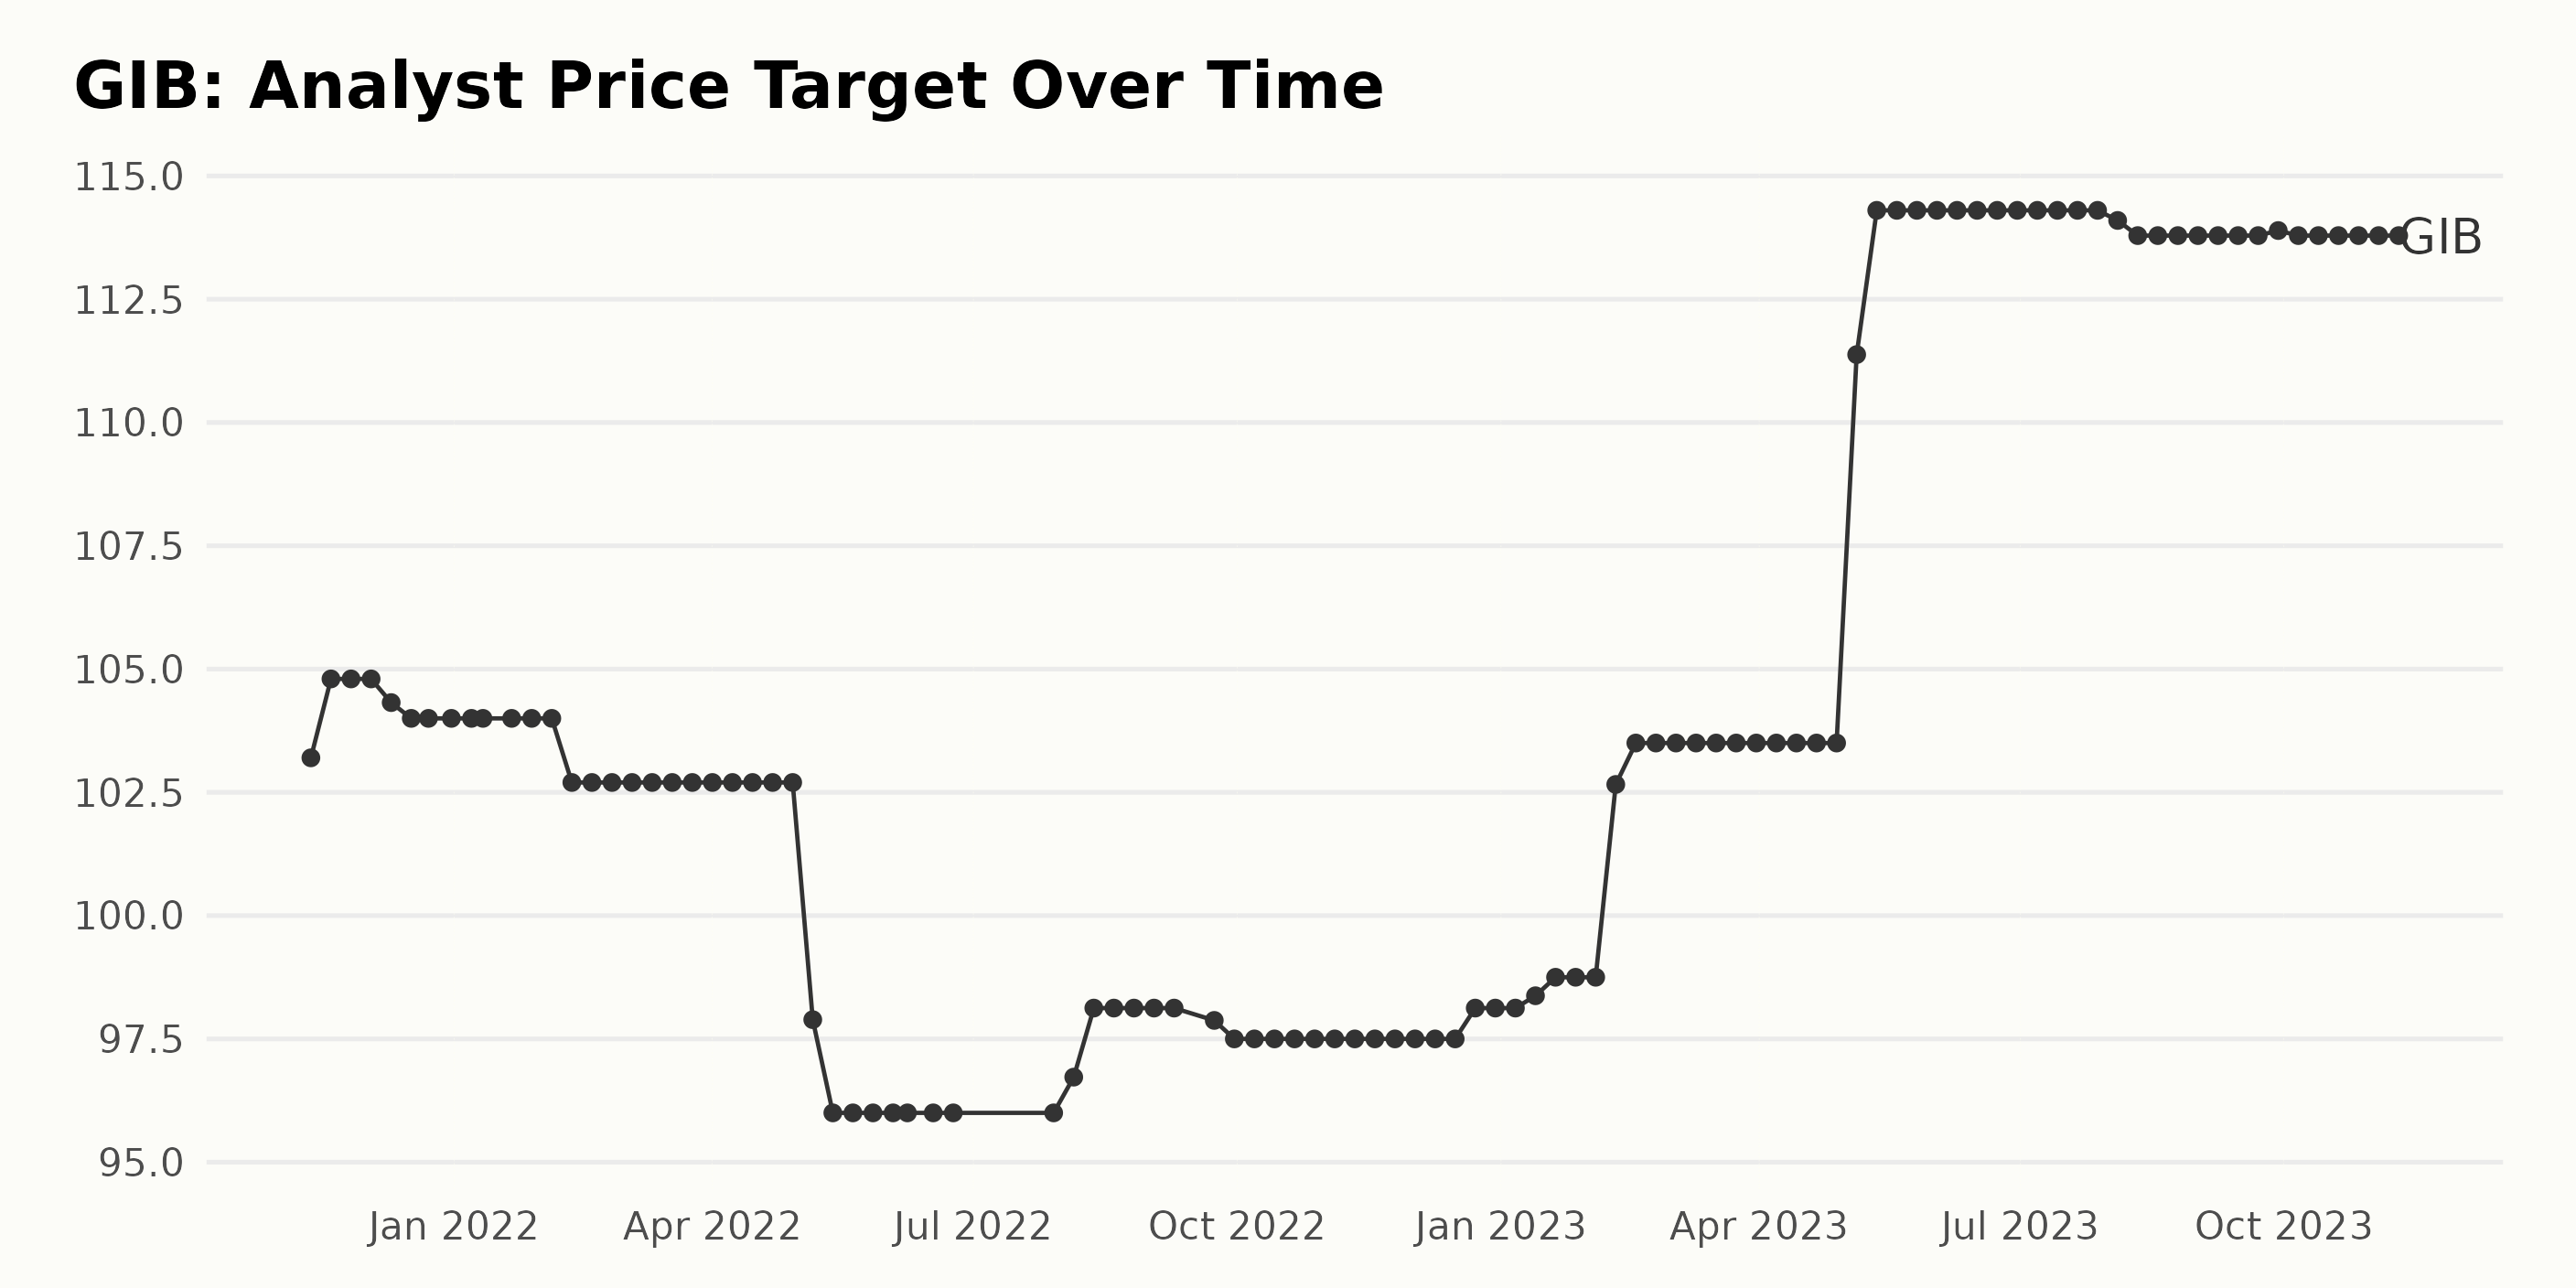
The Analyst Price Target of GIB has seen both stable periods and fluctuations over the timeframe provided.
- The series began on November 12, 2021, with a price target of $103.20.
- There was a slight increase to $104.80 by November 19, 2021, which remained stable until mid-December.
- The price target then gradually decreased to $102.70 in February 2022 and further reduced to $96 by May 2022, after which it remained stable until early August 2022.
- In August 2022, the price target saw minor fluctuations and steadily increased to hit $103.5 in February 2023.
- From May 2023 onwards, there was a notable increase with the price peaking at $114.30.
- After this peak, the price target experienced a slight decline but has been largely stable around $113.79 since August 2023, with minor fluctuations up to the last recorded date on November 10, 2023.
Overall, there appears to be a positive growth rate from the beginning of the series to the end. Calculated from the first value ($103.2) and the last value ($113.79), the net growth is approximately 10.3%. More recent data from 2023 indicates a modest decrease from the peak price target, but the value seems to have stabilized around $113.79.
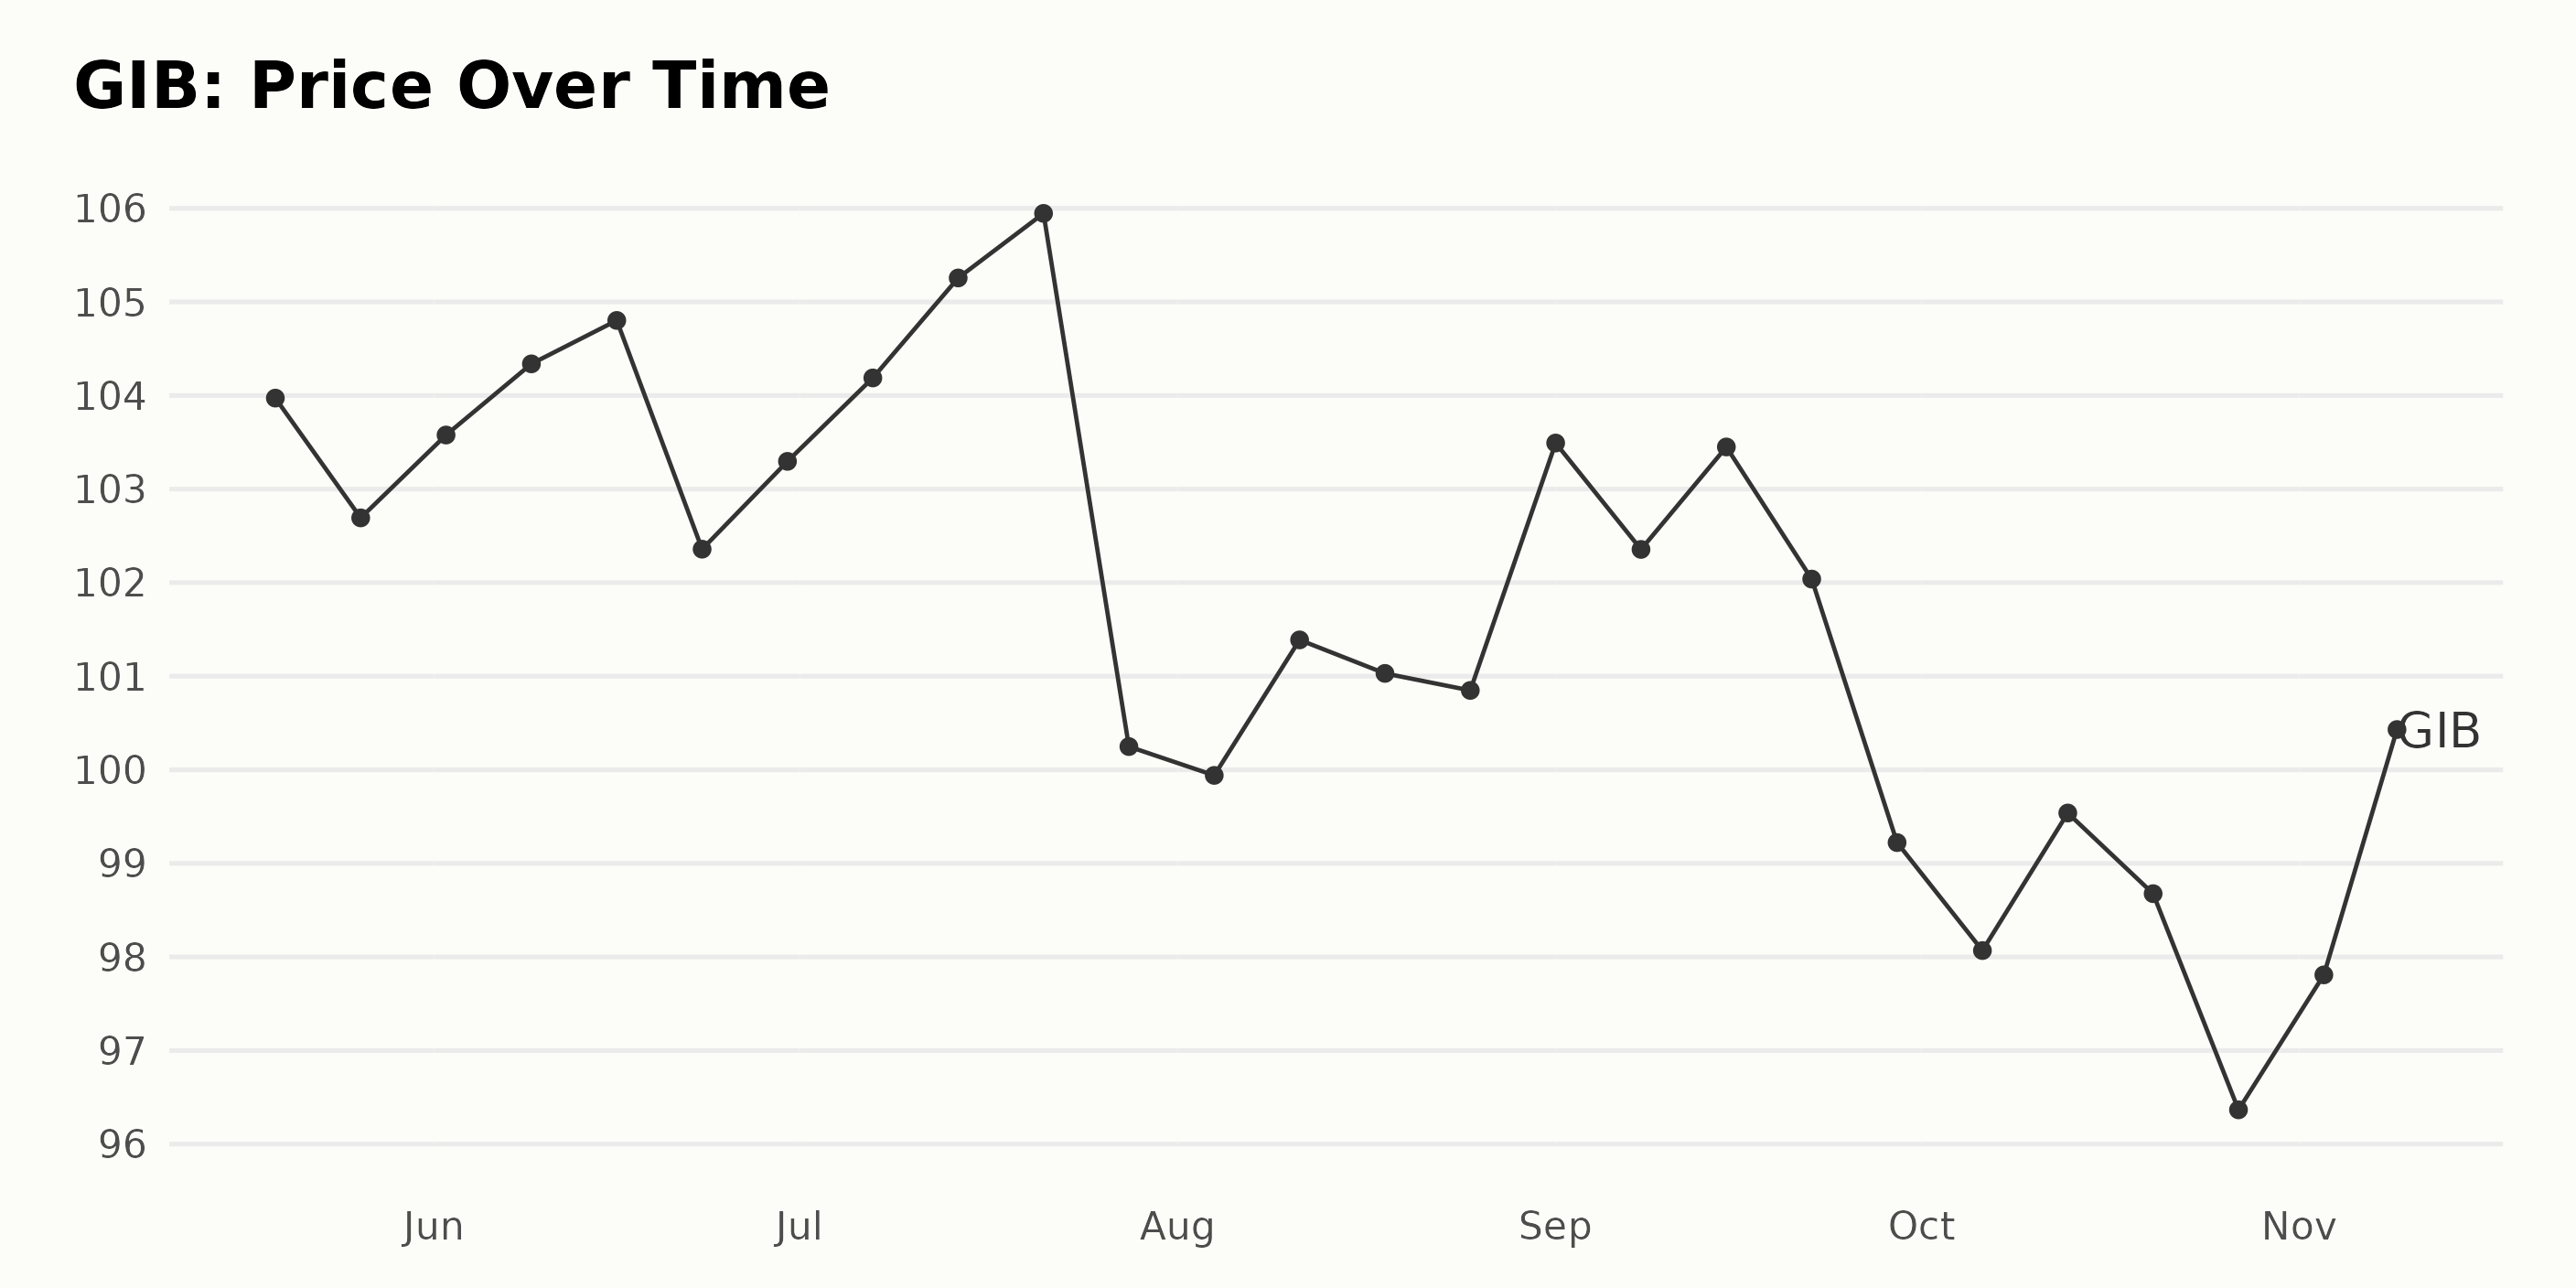
Fluctuations and Downward Trend: An Analysis of CGI Group Inc.’s Share Price (May-November 2023)
Examining the given data on the share price of GIB from May to November 2023, we can observe a fluctuating pattern. Notably, the share price has both increases and decreases over this period. However, there is a discernible downward trend, particularly apparent in the last few months.
- The share price begins at $103.97 on May 19, 2023. After a slight dip in late May and early June, it gradually increases throughout June, peaking at $104.80 on June 16, 2023.
- A dip is observed in late June, followed by a recovery and a subsequent increase in July. The share price reaches another peak value of $105.95 on July 21, 2023.
- A noticeable drop occurs towards the end of July when the share price falls to $100.25 on July 28, 2023. It decreases further to reach $99.94 on August 04, 2023.
- The share price slowly recovers to $103.49 by September 1, 2023, but again starts to falter over the rest of September.
- The downward trend becomes more pronounced in October, with the price falling to $98.07 on October 6, 2023. It dips further to record the lowest value in the dataset, $96.36, on October 27, 2023.
- The share price shows a slight recovery to $100.43 on November 9, 2023. However, this is still lower than most of the recorded values for the period.
In summary, after reaching peak values in mid-June and mid-July, GIB’s share price demonstrates a general decreased in value during this period. While there are short-term upward swings, the longer-term trend from July to November suggests a decelerating growth rate. Here is a chart of GIB’s price over the past 180 days.
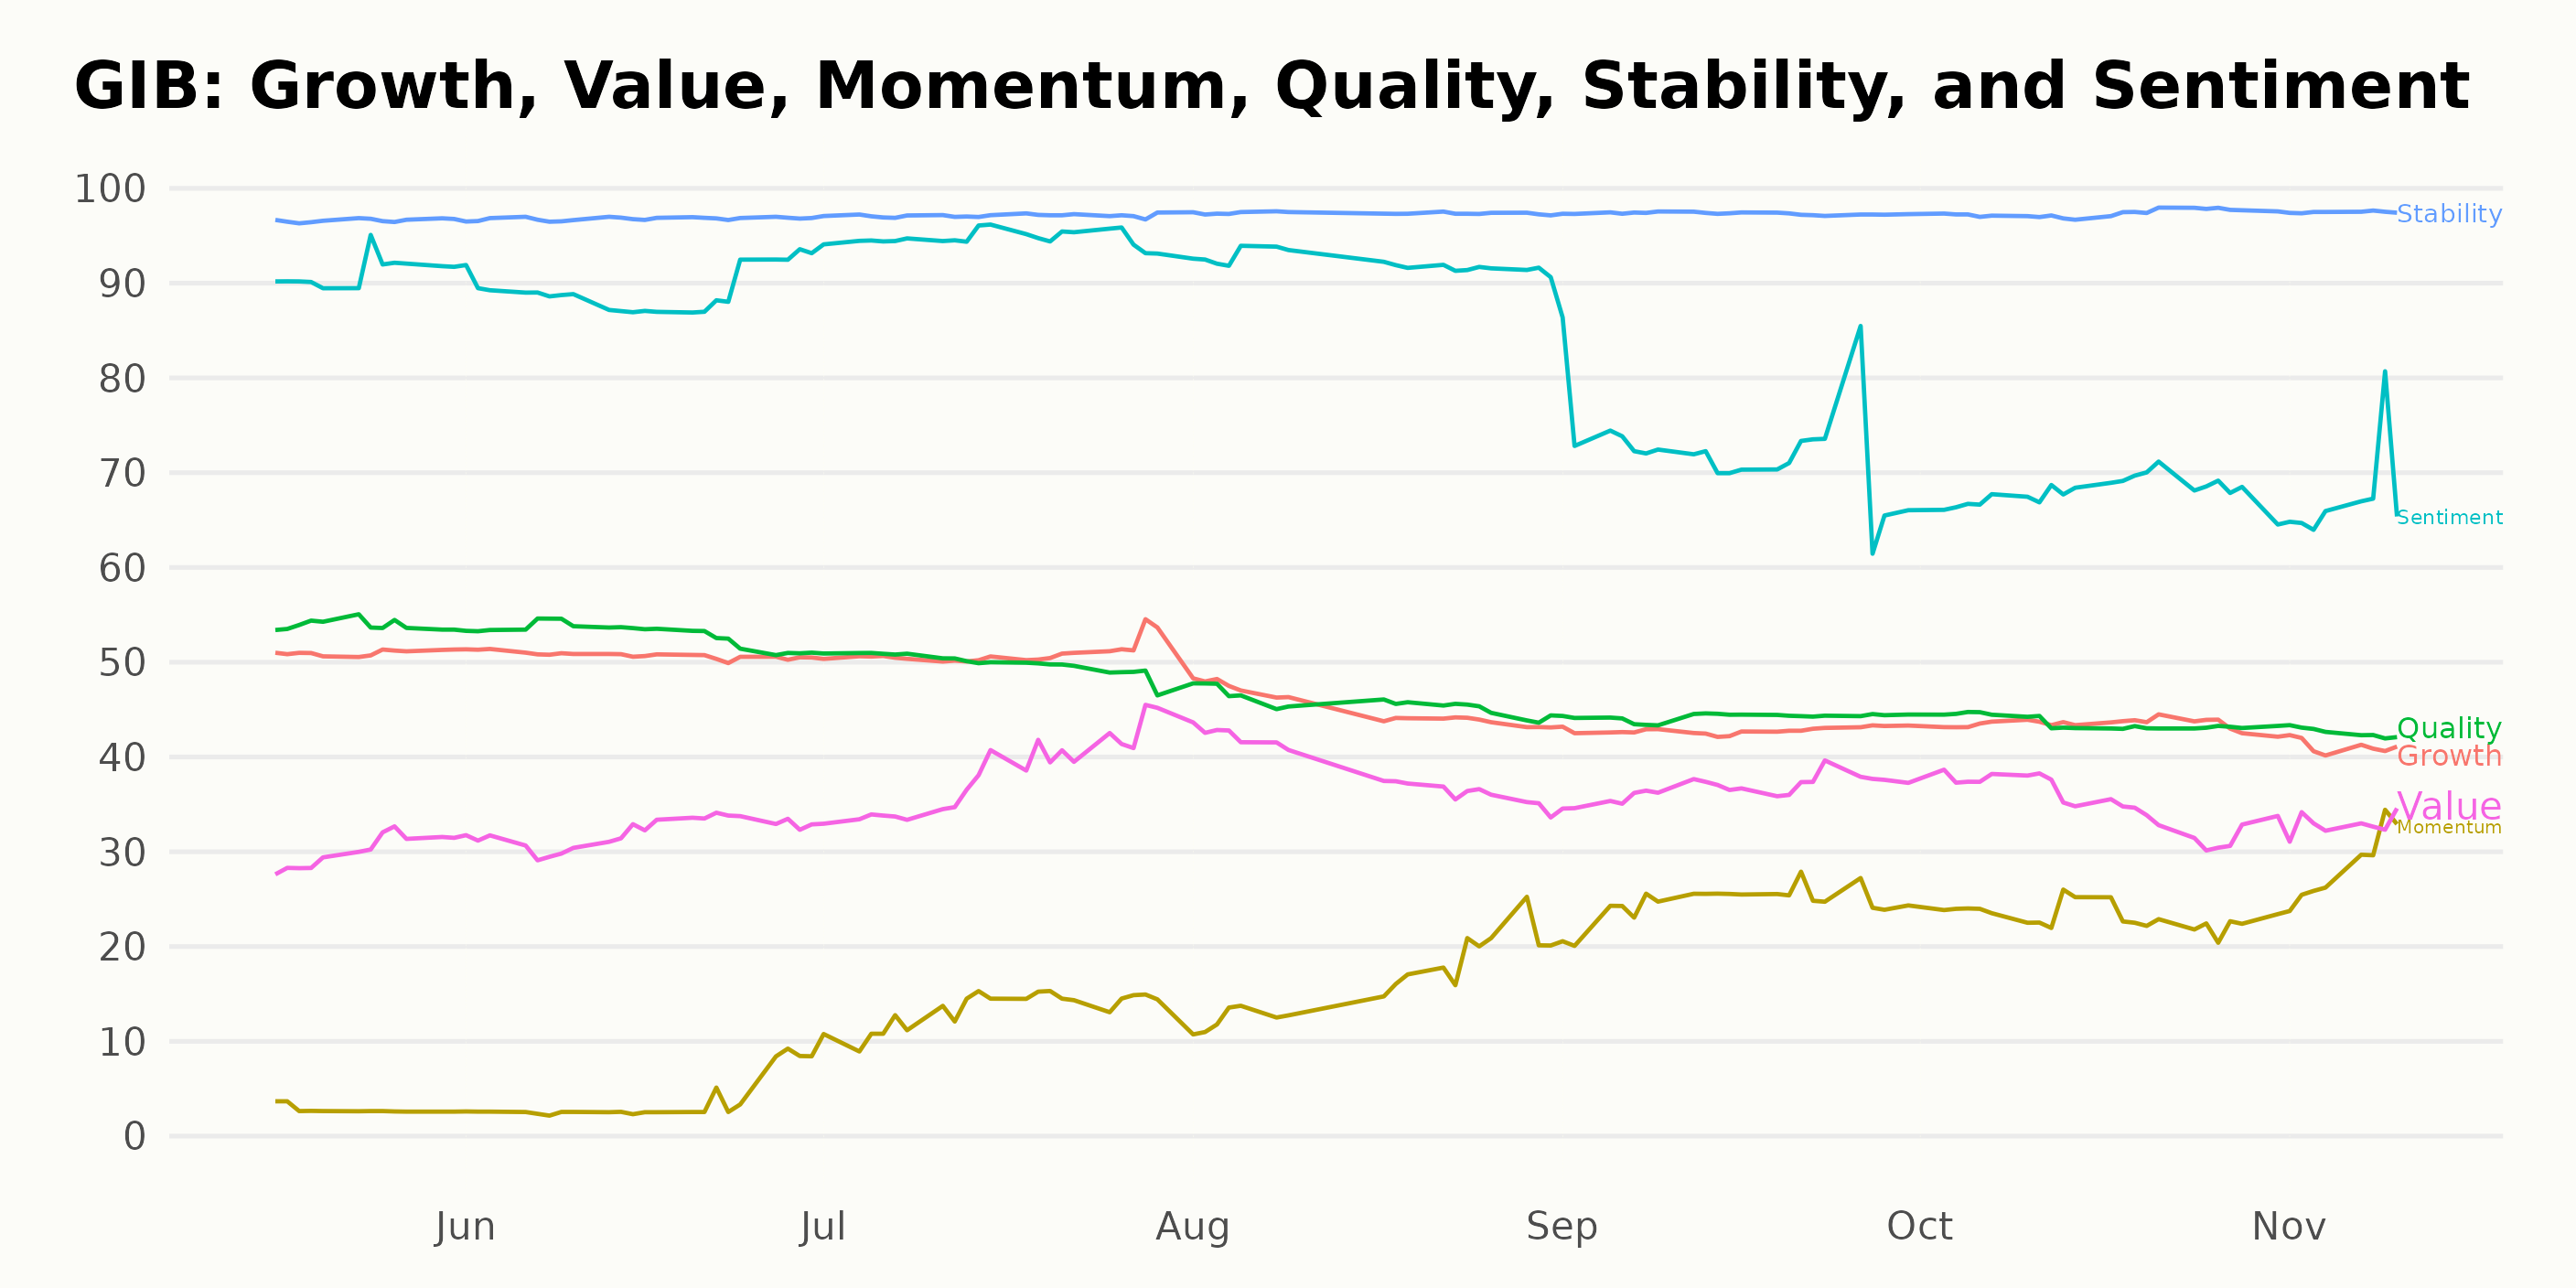
Analyzing CGI Group’s Performance: Stability, Sentiment, and Quality Ratings Review
GIB has an overall C rating, translating to a Neutral in our POWR Ratings system. It is ranked last among the nine stocks in the Outsourcing – Tech Services category.
The most noteworthy POWR Ratings for GIB in terms of the highest ratings are in the dimensions of Stability, Sentiment, and Quality.
Stability: – GIB has consistently high stability ratings maintaining a figure of 97 from May to November 2023. This highlights its strength in this key dimension over time.
Sentiment: – The sentiment ratings showed an upward trend from 91 in May 2023 to a peak of 95 by July 2023. It thereafter experienced a period of decline reaching 67 by November 2023. Despite that dip, it remains one of the highest-rated dimensions for GIB.
Quality: – In quality, the company started with a rating of 54 in May 2023, experiencing a gradual decrease to reach 43 in November 2023. However, among the six dimensions, Quality ranks third, thus making it one of the most noteworthy dimensions, despite the declining trend.
These three noteworthy dimensions show varied patterns of stable performance, fluctuations, and gradual declines indicating the complex nature of GIB’s business performance across these aspects.
How does CGI Inc. (GIB) Stack Up Against its Peers?
Other stocks in the Outsourcing – Tech Services sector that may be worth considering are The Hackett Group Inc. (HCKT), Cognizant Technology Solutions Corporation (CTSH), and Accenture plc (ACN) — they have better POWR Ratings.
What To Do Next?
43 year investment veteran, Steve Reitmeister, has just released his 2024 market outlook along with trading plan and top 11 picks for the year ahead.
Want More Great Investing Ideas?
GIB shares were trading at $99.04 per share on Friday afternoon, down $0.43 (-0.43%). Year-to-date, GIB has gained 14.99%, versus a 15.88% rise in the benchmark S&P 500 index during the same period.
About the Author: Subhasree Kar

Subhasree’s keen interest in financial instruments led her to pursue a career as an investment analyst. After earning a Master’s degree in Economics, she gained knowledge of equity research and portfolio management at Finlatics. More...
More Resources for the Stocks in this Article
| Ticker | POWR Rating | Industry Rank | Rank in Industry |
| GIB | Get Rating | Get Rating | Get Rating |
| HCKT | Get Rating | Get Rating | Get Rating |
| CTSH | Get Rating | Get Rating | Get Rating |
| ACN | Get Rating | Get Rating | Get Rating |