
Home improvement retailing giant The Home Depot, Inc. (HD) is set to report its third-quarter earnings tomorrow. Home improvement chains like HD are expected to post weak quarterly sales as small-scale repair work and renovations dampen amid economic uncertainty.
HD is expected to post a 3.3% decline in quarterly same-store sales for the third quarter, while net earnings are expected to fall 13.9%. For fiscal 2023, the company expects its sales and comparable sales to decline between 2% and 5% year-over-year. HD also projects its EPS to decline between 7% and 13% compared to fiscal 2022.
Given this backdrop, let’s look at the trends of HD’s key financial metrics to understand why it could be wise to wait for a better entry point in the stock.
Analyzing Home Depot’s Financial Performance: A Comprehensive Review from 2021 to 2023
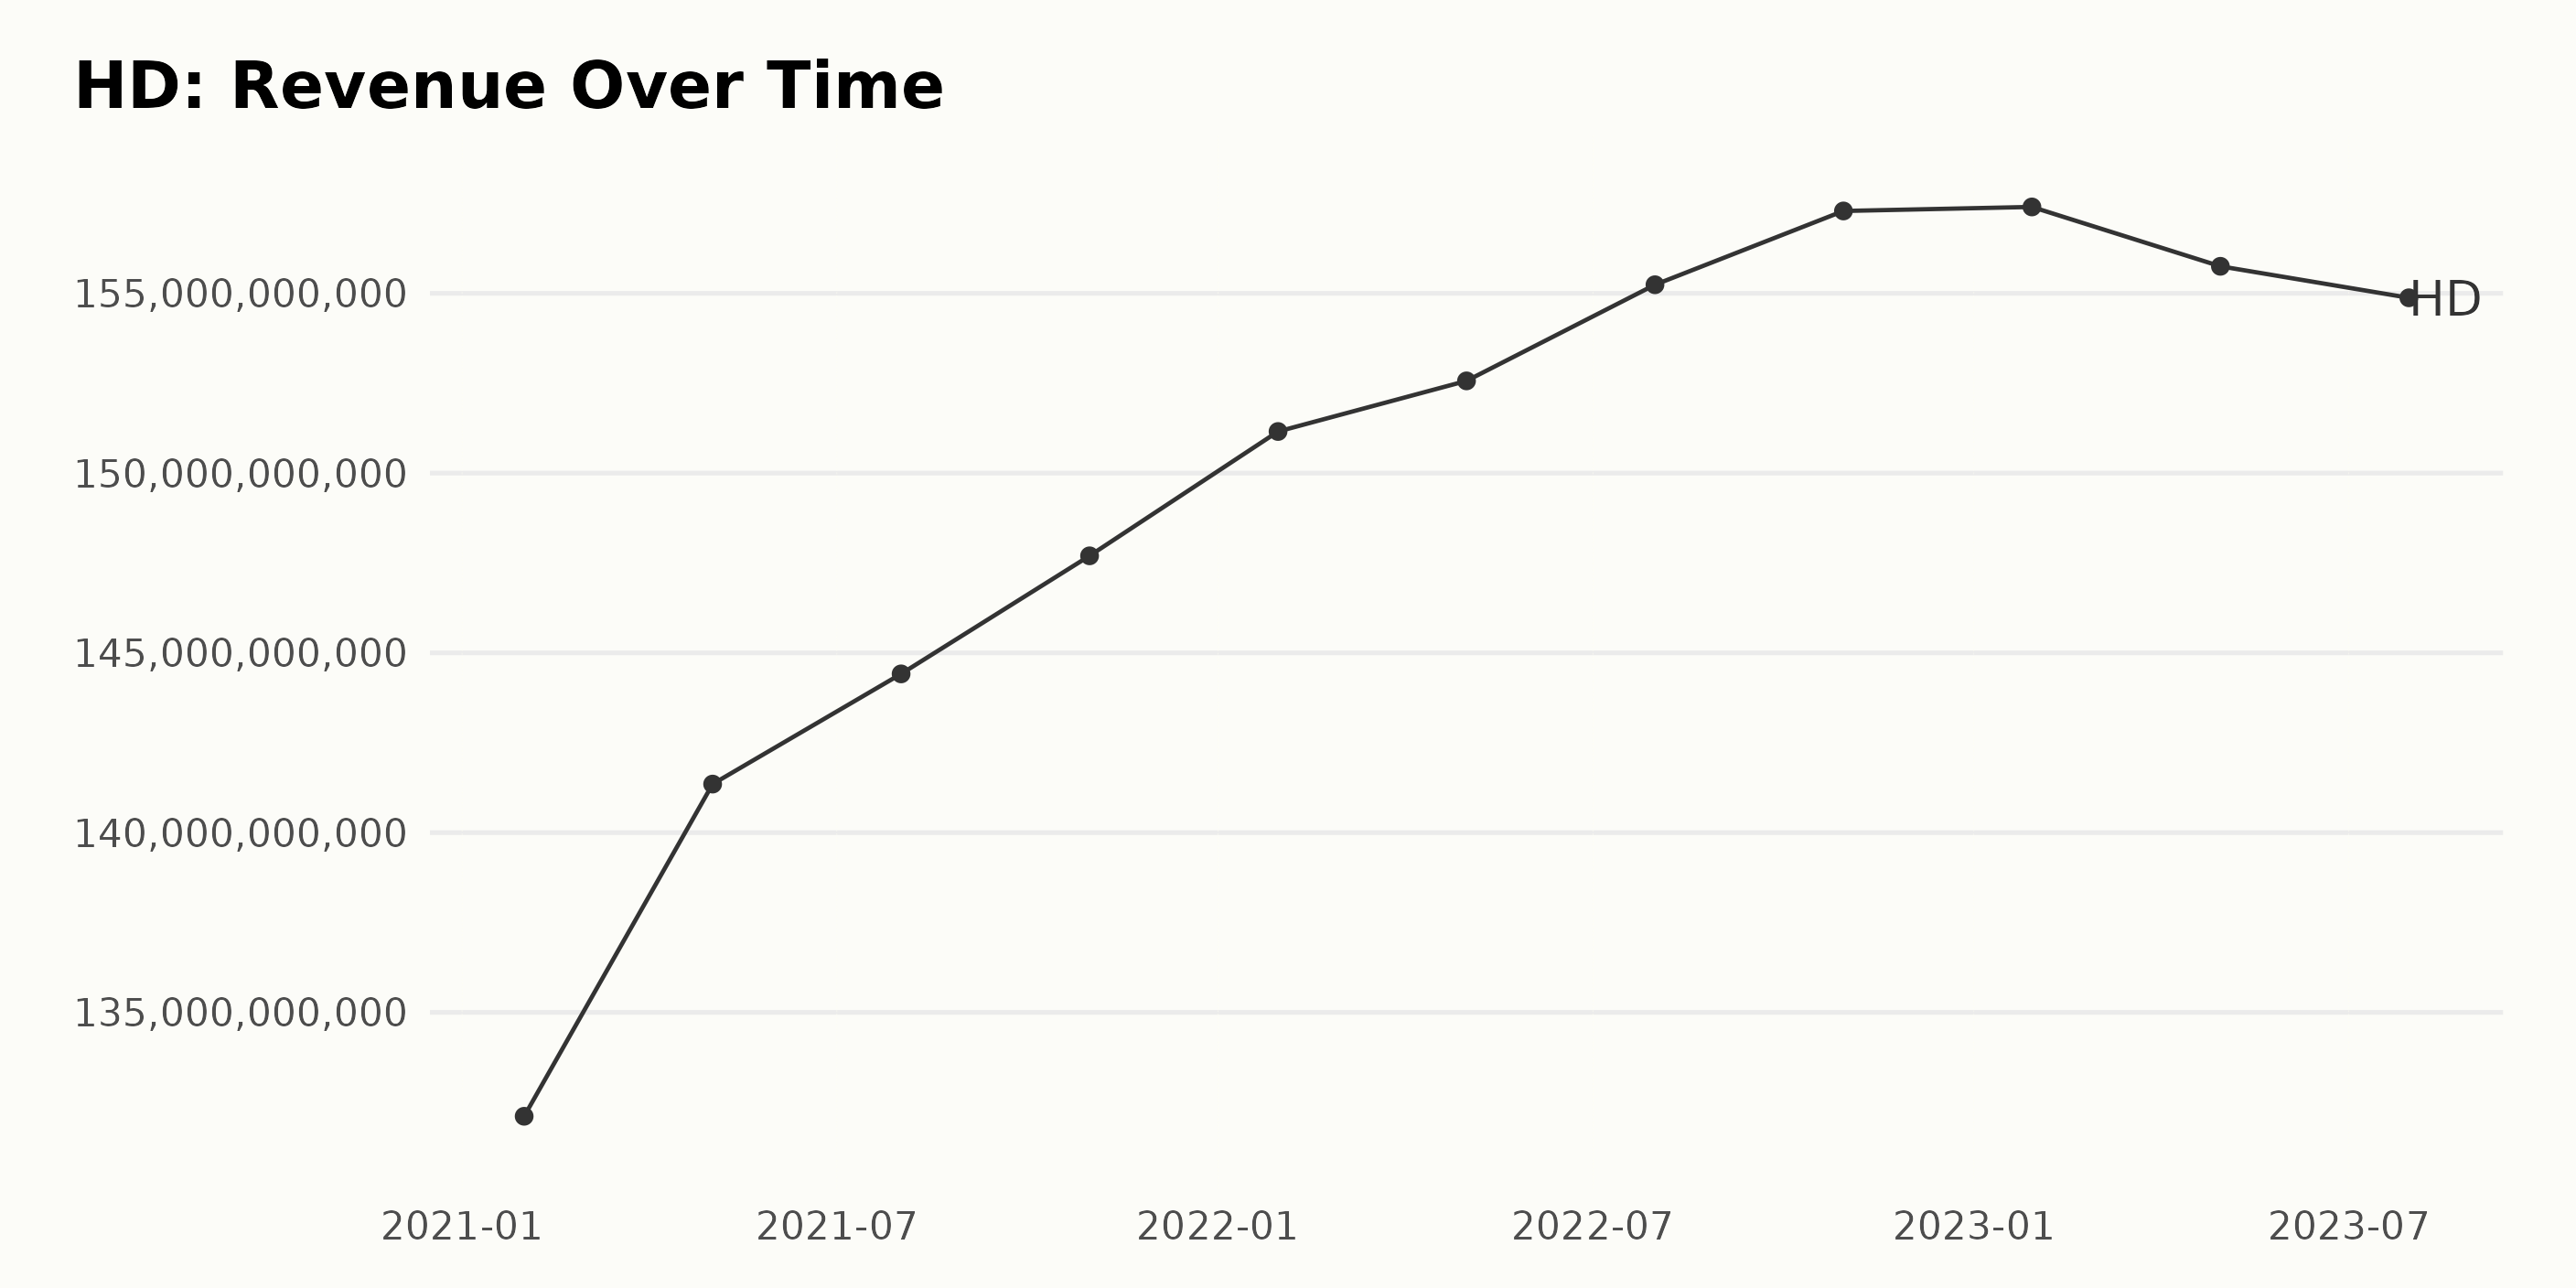
The trailing-12-month revenue trend for HD from January 2021 to July 2023 shows an overall increase but with some noticeable fluctuations. Here are the key points:
- Starting from $132.11 billion in January 2021, the company experienced steady growth over the course of the next year and a half.
- By May 2022, HD’s revenue had witnessed a significant increase, reaching $152.57 billion, representing an increase of about 15%.
- Revenue further increased to $157.29 billion by October 2022 but then started to show slower growth and a slight decline in the succeeding periods.
- In January 2023, despite the slowed growth, revenue stood at $157.40 billion, marking the highest recorded revenue for the period under review.
- However, by April 2023, the revenue had decreased slightly to $155.75 billion. And as of the last reported data point in July 2023, a further decrease was observed, bringing the revenue down to $154.88 billion.
The overall growth rate when measuring the last value ($154.88 billion) from the first value ($132.11 billion) indicates approximately a 17% increase in revenue over two and a half years. Multiple factors could have contributed to this performance, including business strategies, market conditions, and consumer behavior changes.
The most recent shifts, particularly the slight dip in 2023, could be attributed to various factors, thus warranting close monitoring.
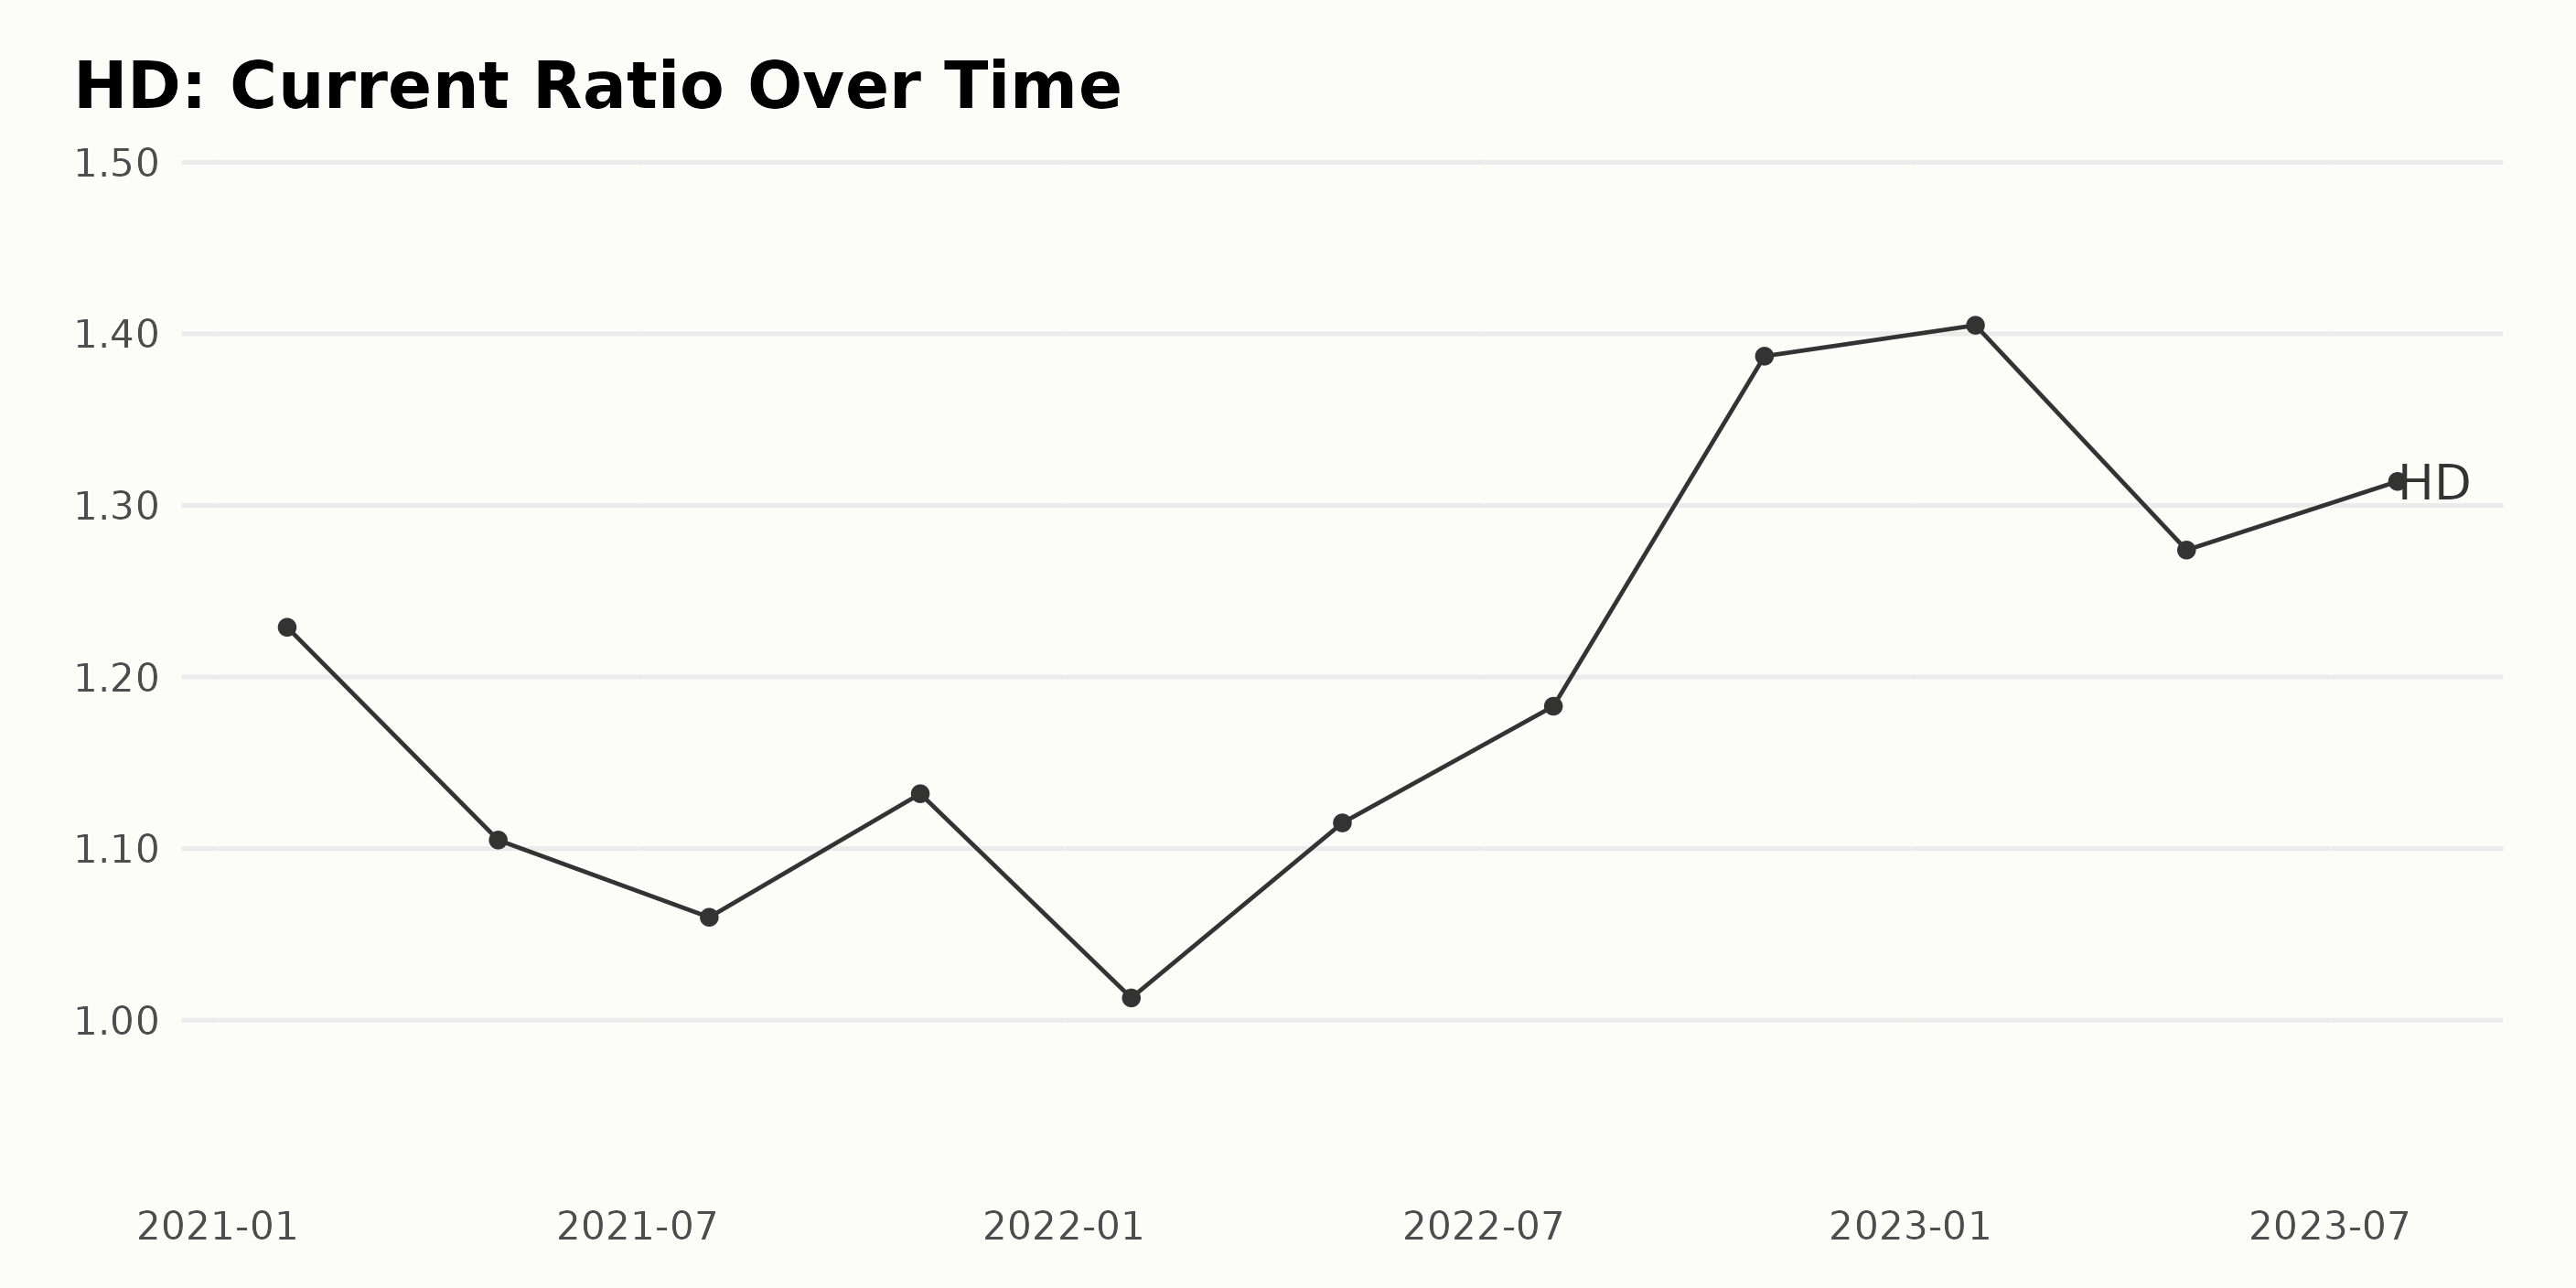
Based on the data provided, the current ratio of HD fluctuated between 1.01 and 1.41 from January 2021 to July 2023. Notably, the general trend shows an increase despite some fluctuations throughout the period. Breaking down the time frames:
- Between January 2021 and May 2021, the current ratio dropped from 1.23 to 1.11.
- From May to August 2021, there was a slight decline to 1.06, followed by an increase to 1.13 in October of the same year.
- From October 2021 to January 2022, the ratio declined again, reaching its lowest point at 1.01.
- However, from January 2022 to October 2022, the current ratio experienced an overall increase, peaking at 1.39. This marks the highest value over the reported period.
- Afterwards, the current ratio slightly increased to 1.41 in January 2023 but then decreased to 1.27 in April 2023.
- The most recent data, as of July 2023, suggests a minor increase to 1.31.
The growth rate, calculated by measuring the last value from the first value, is approximately 0.08 or 8%. This means that over the given period, HD’s current ratio has grown by about 8%, suggesting that the company has increased its ability to pay off its short-term liabilities with its short-term assets.
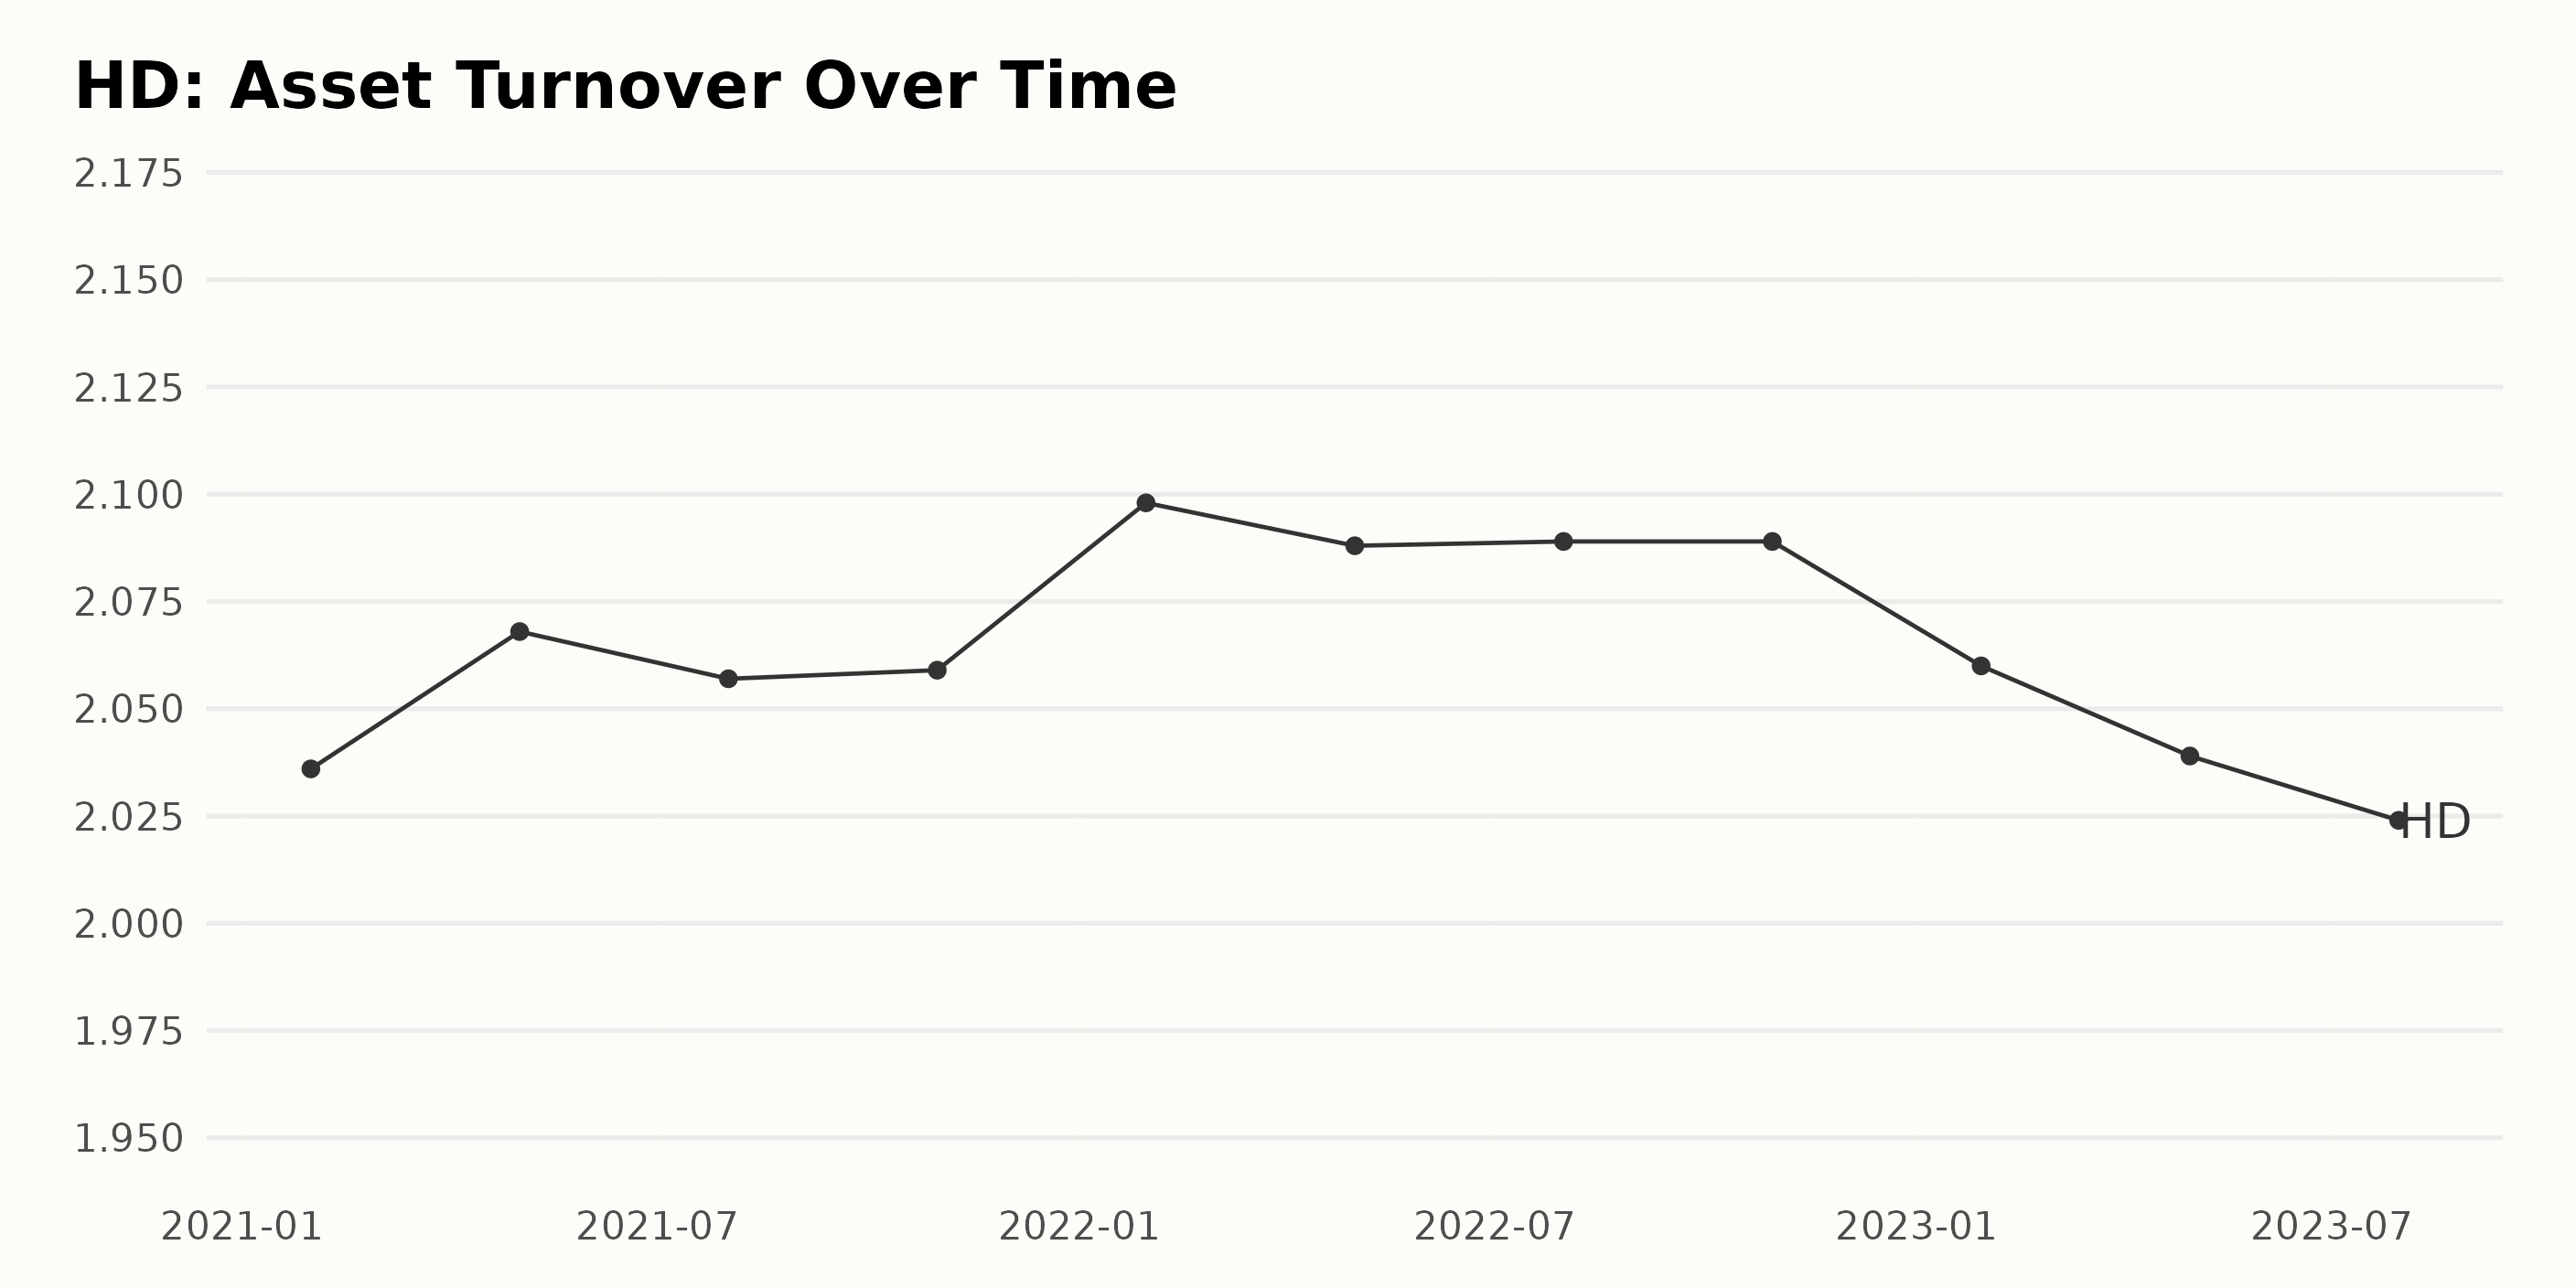
The data represents the trend and fluctuations of the asset turnover of HD from January 2021 to July 2023.
- Starting from an asset turnover value of 2.04 in January 2021, there is an initial increase to a value of 2.07 in May 2021.
- This upward trend slightly decreased to 2.06 in August 2021 but remained around that range, with a slight uptick to 2.06 in October 2021.
- In 2022, there was again a noticeable increase, peaking at an asset turnover value of 2.10 in January. It mildly fluctuated for the remainder of the year, hovering around the 2.09 mark until October.
- However, the trend started to decline into 2023, with the asset turnover decreasing to 2.06 at the end of January and dropping to 2.02 by July.
Taking into account the first value (2.036 in January 2021) and the last value (2.024 in July 2023), the growth rate over this period is approximately -0.59%. The most recent data point is of significant interest: in July 2023, the asset turnover was reported to be 2.02, indicating a downward trend after a series of mild fluctuations.
This analysis emphasizes more recent data, leaning towards possible implications for HD’s financial performance as indicated by its worsening asset turnover ratio in 2023.
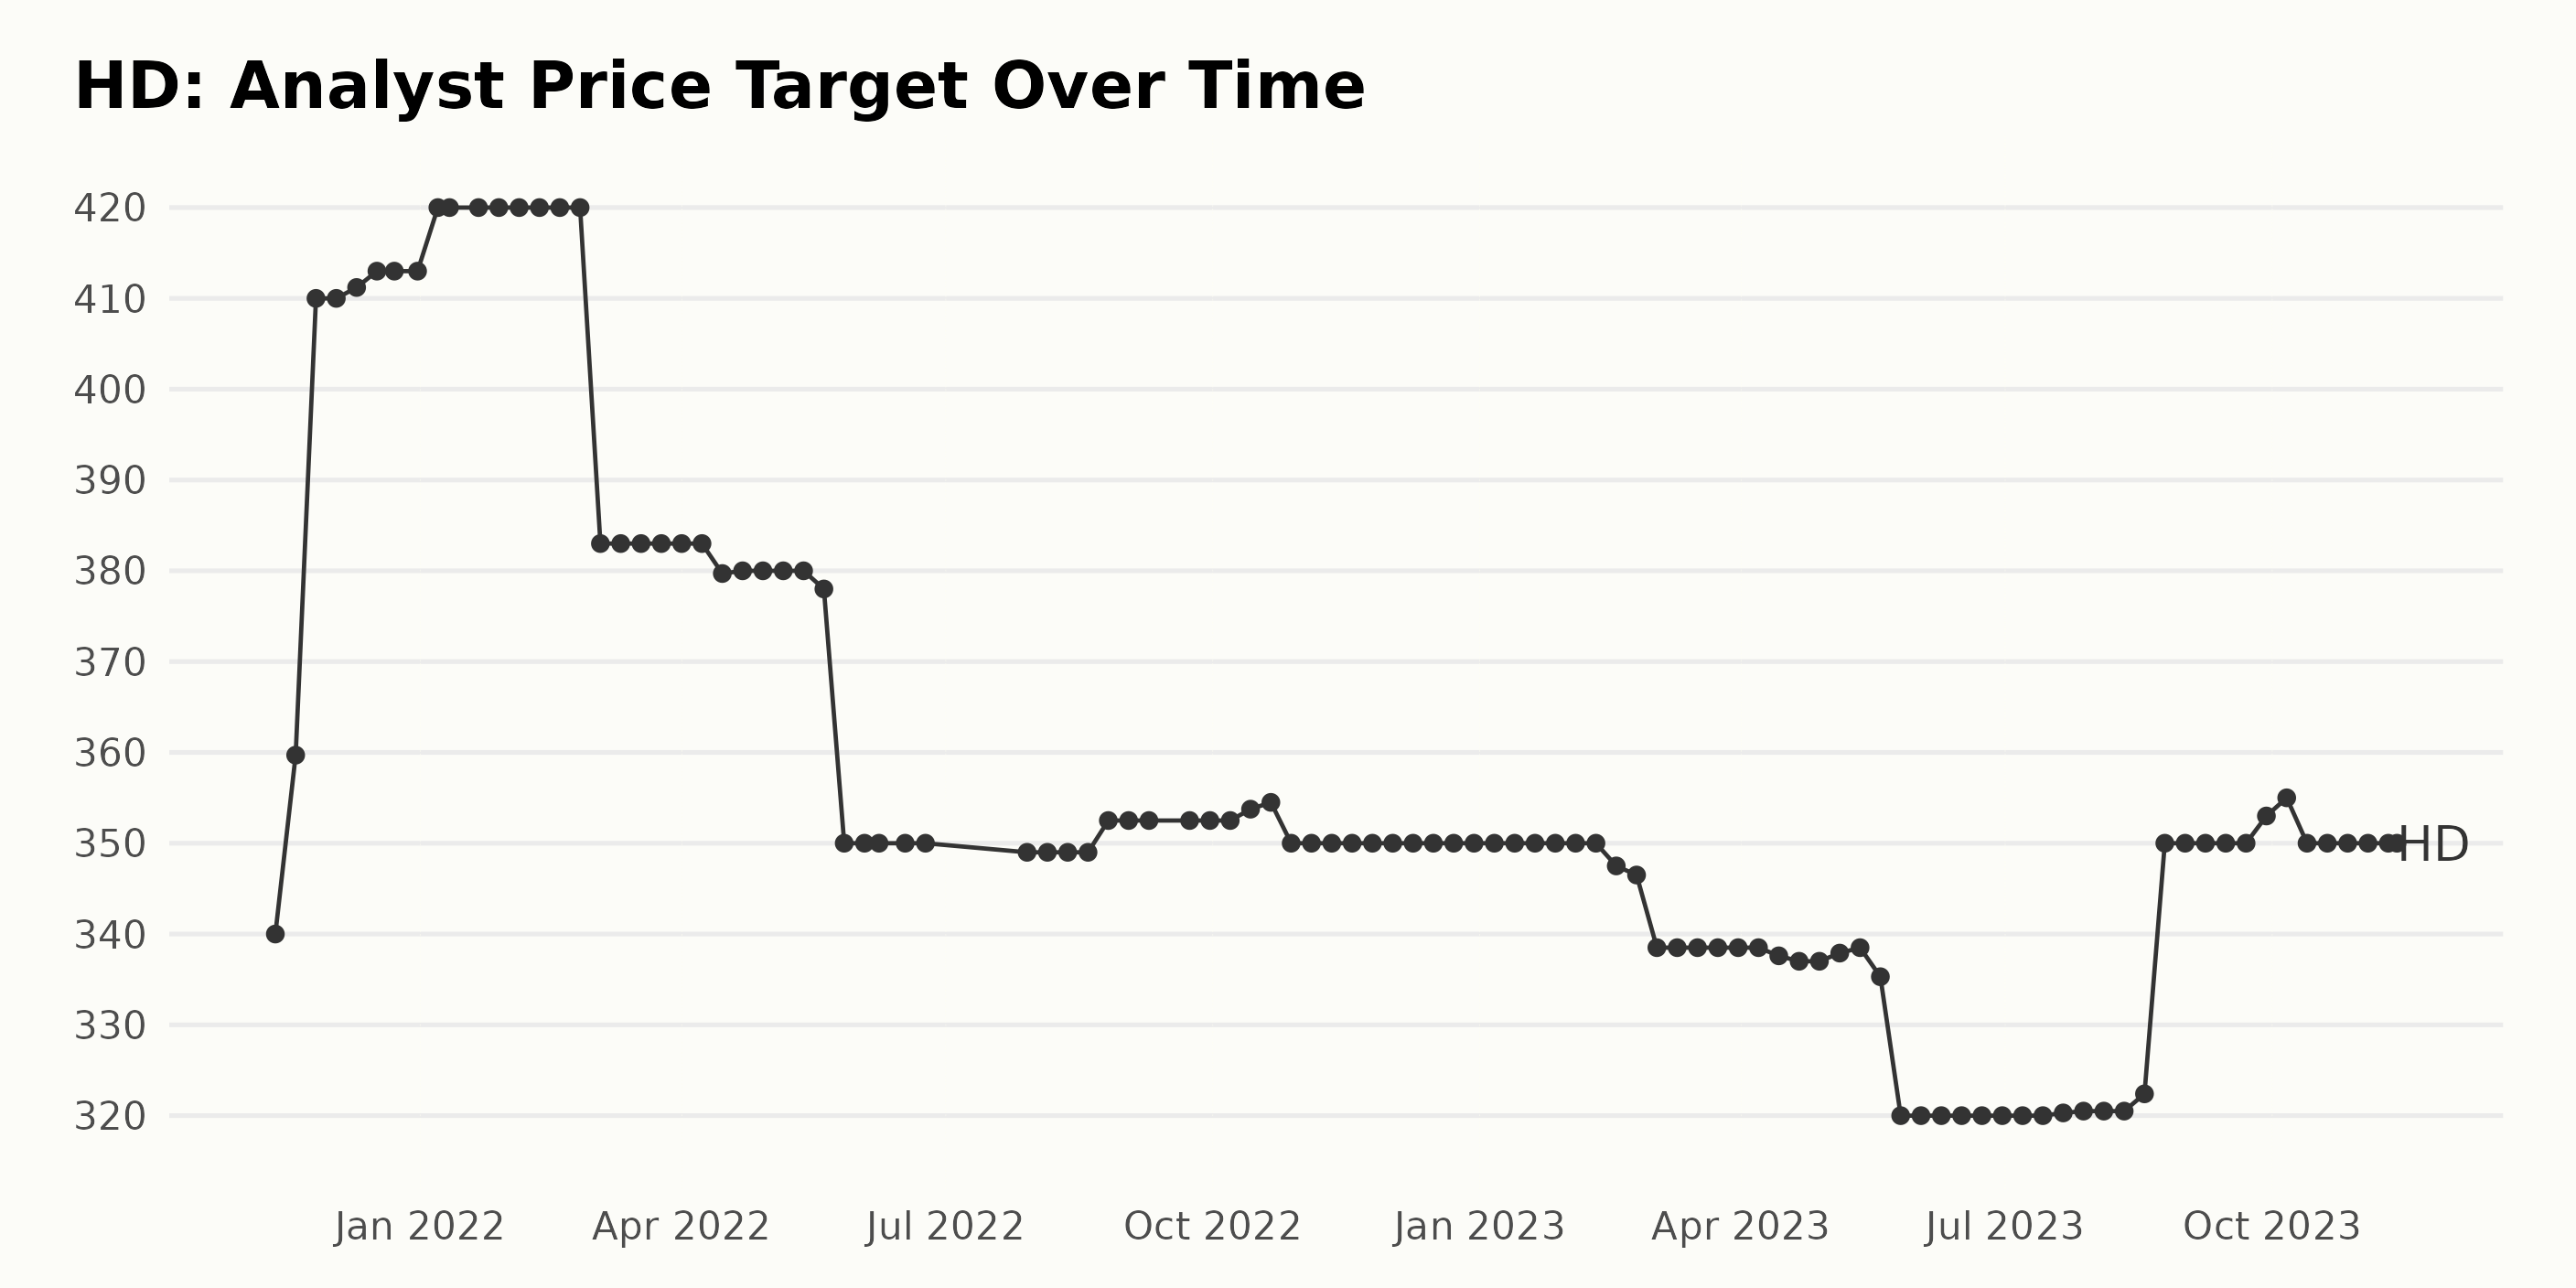
The trend of the analyst price target for HD exhibited some ups and downs over the examined period:
- Starting on November 12, 2021, at $340, the price target saw a rapid increase to peak at $420 by January 7, 2022.
- This was followed by a sharp decline to $383 by March 4, 2022, after which the price target stagnated around this level until mid-April.
- From mid-April to the end of June 2022, the price target saw a slight decline, ending at $350 on June 24, 2022. This trend continued, with minor fluctuations, until October 14, 2022, when it slightly increased to $353.75.
- A noticeable decrease transpired in March 2023, falling from $346.5 to $338.5 within a week.
- Most recently, the value experienced a drop of 17.9 points, from $350 on September 22, 2023, to $320 on May 26, 2023. However, the current reported analyst price target as of November 13, 2023, is $350.
Considering the values from November 12, 2021, to the last reported value on November 13, 2023, the growth rate of the analyst price target for HD is 2.9%. It’s also notable that throughout this period, the price target hovered between $350 and $420, undergoing occasional precipitous drops and modest ascents.
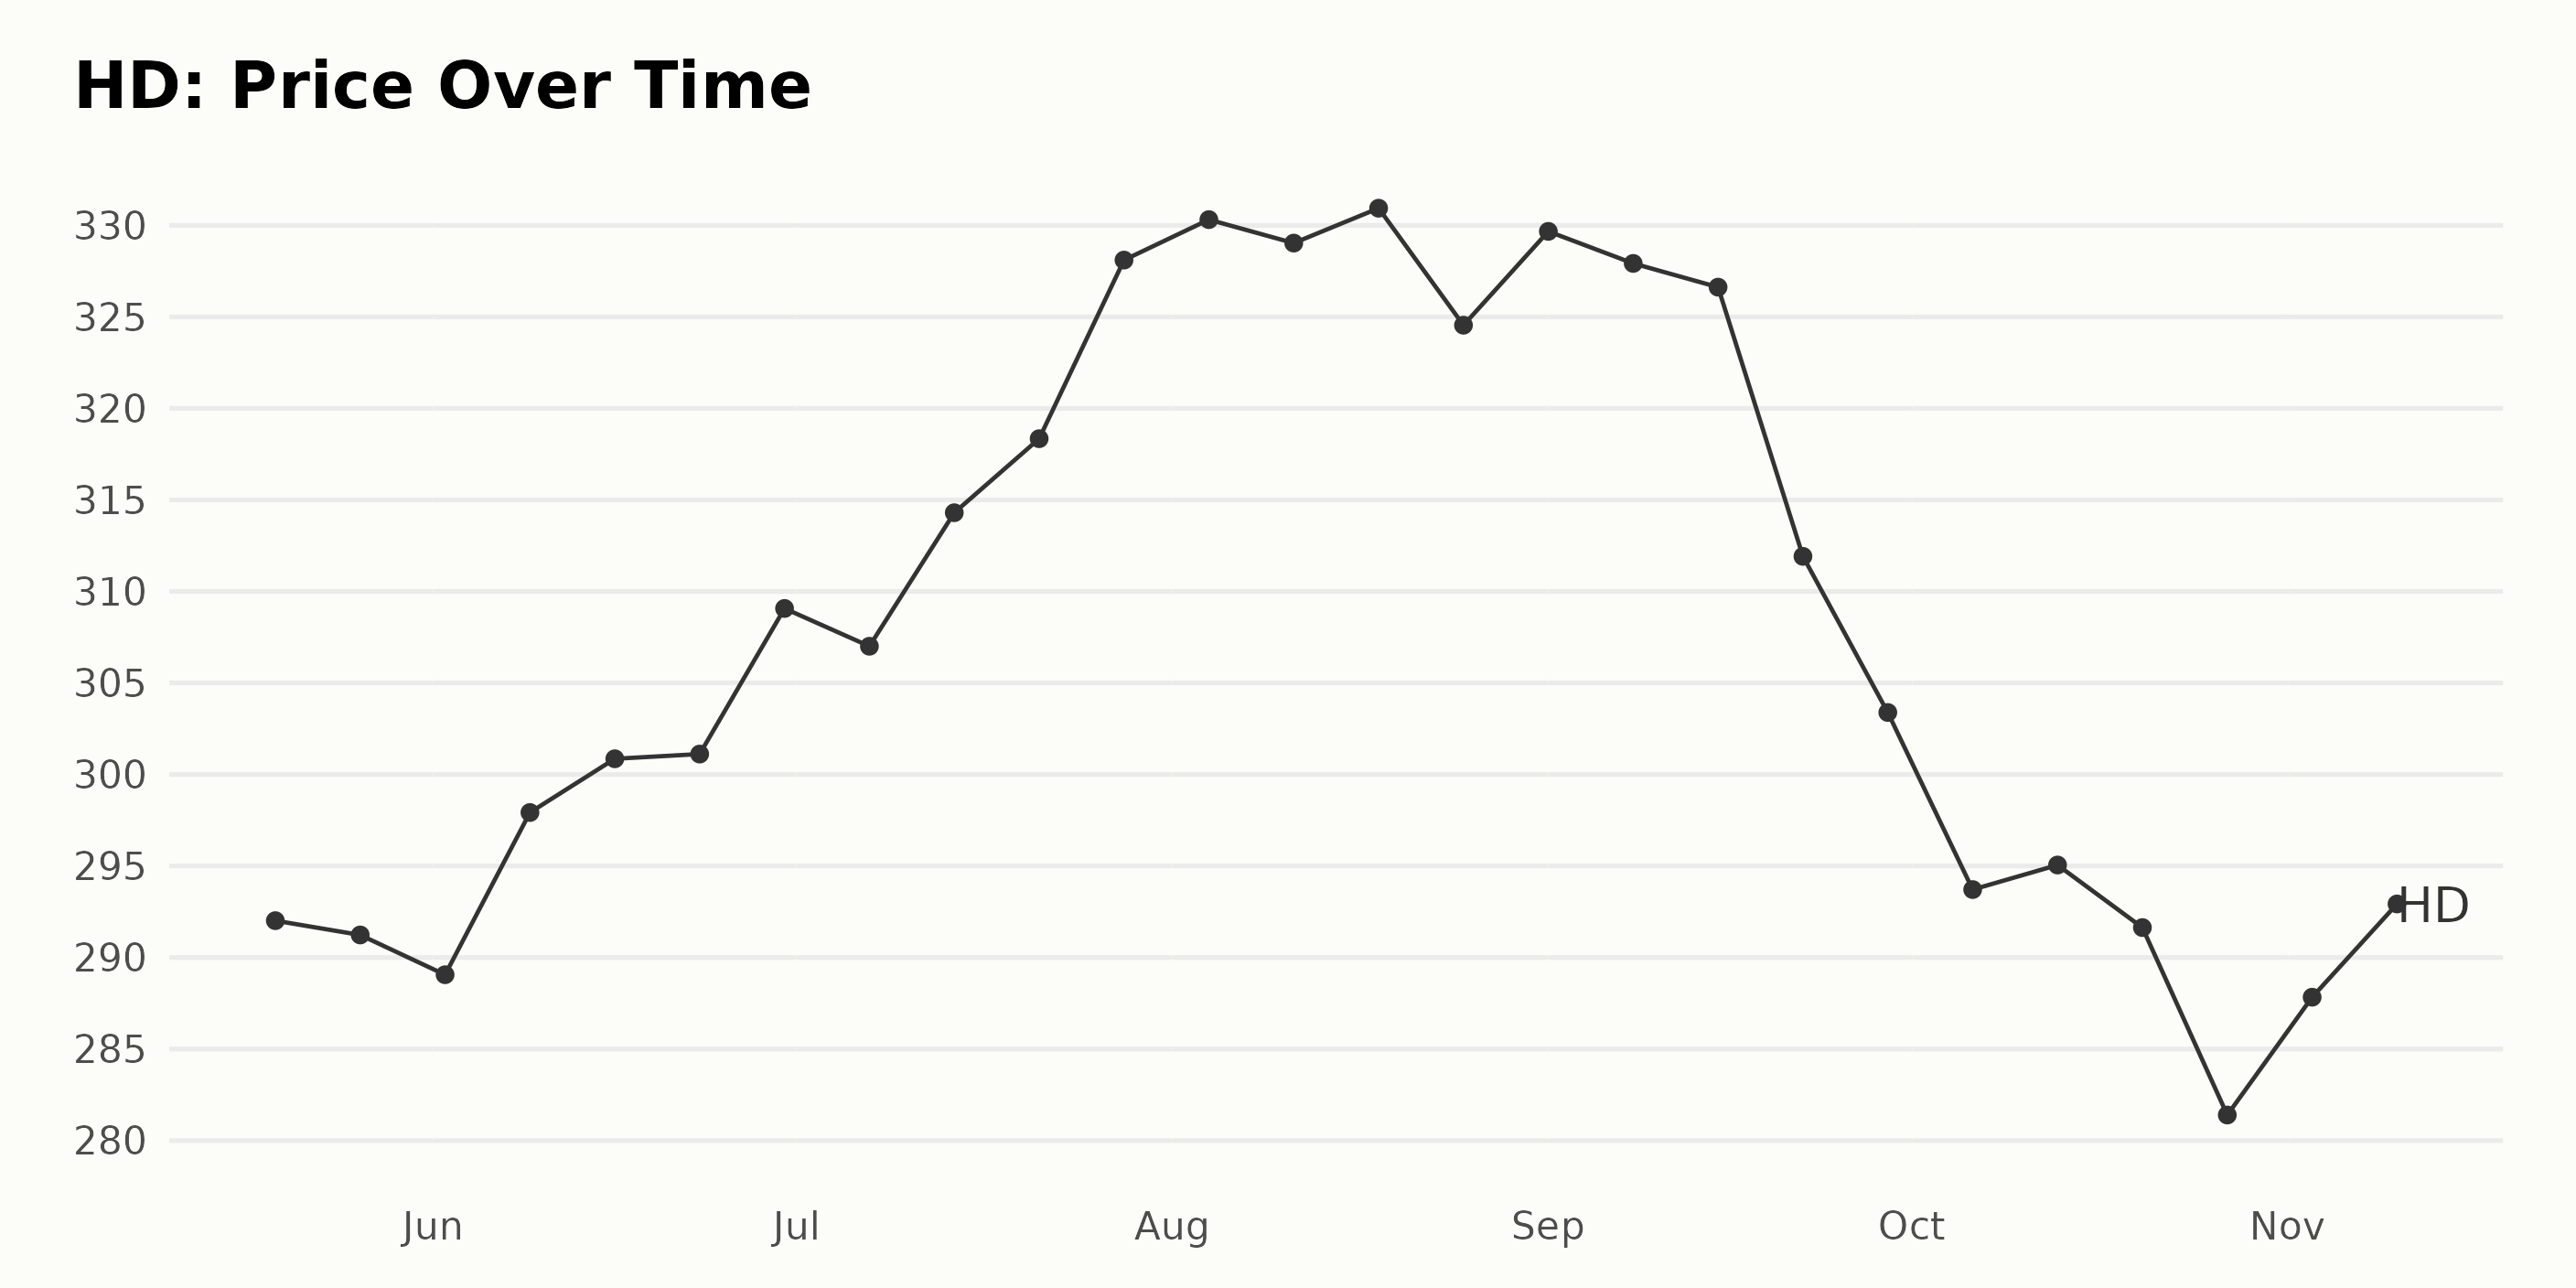
Analyzing Home Depot’s Six-Month Stock Price Fluctuations: May-November 2023
The share price data of HD over the course of six months, from May to November 2023, exhibits several critical points that indicate a definite trend and growth rate. In general, the trend for this period shows an initial decrease, followed by a steady increase that peaks, then ends in a decline.
- On May 19, 2023, the share price was $292.01.
- It dipped slightly to $291.23 by May 26, 2023, and further dropped to $289.06 by June 2, 2023.
- After that, it steadily rose, reaching its first peak at $300.86 on June 16, 2023.
- The trend remained upward as it reached a new high of $309.07 on June 30, 2023.
- From July to August 2023, the growth rate accelerated significantly as the share price reached its maximum value of $330.94 on August 18, 2023.
- However, after reaching its peak in August, the share price showed a decelerating trend. It endured a considerable dip, reaching $311.92 by September 22, 2023, and continuing downhill to $303.39 by the end of September.
- The sharpest decline is notable in October 2023, when the share price reached its lowest point of $281.40 by October 27, 2023.
- In the first few weeks of November 2023, there has been a rebound, with the share price increasing to $291.59 by November 10, 2023.
In conclusion, the share price of HD faced volatility over the months, first decreasing and then increasing before decelerating again. However, in November, it showed a mild recovery rate.
Here is a chart of HD’s price over the past 180 days.
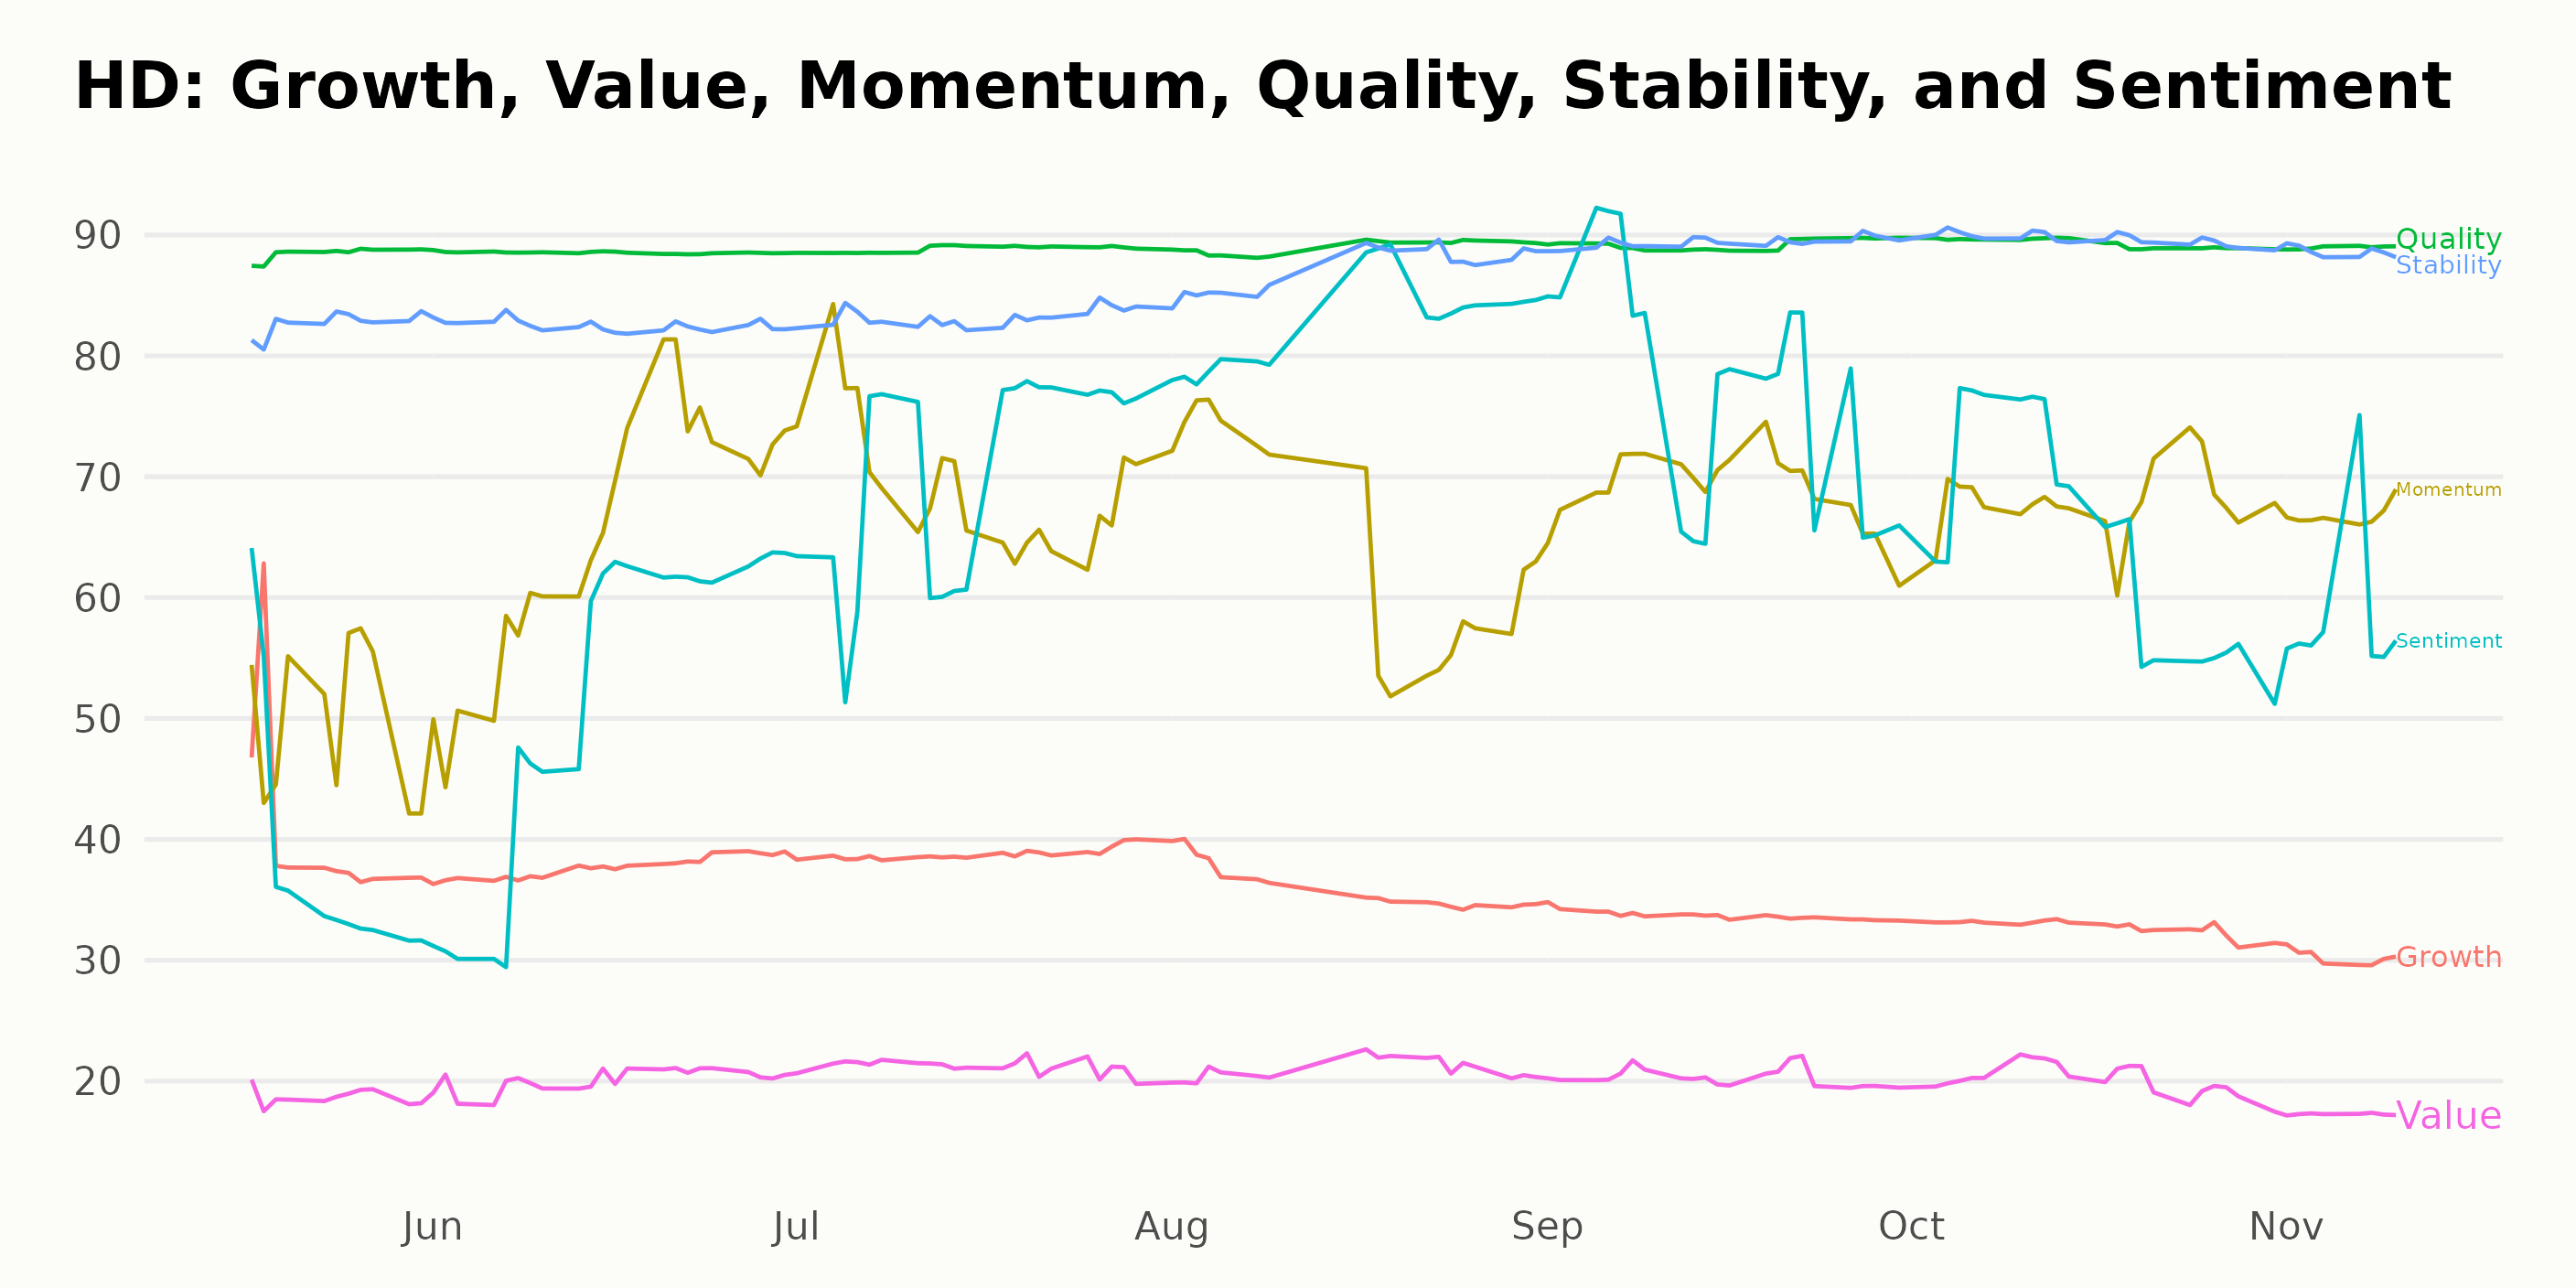
Analyzing Home Depot’s POWR Ratings: Quality, Stability, and Momentum
The POWR Ratings grade of HD, a stock within the Home Improvement & Goods category, fluctuates between C (Neutral) and B (Buy) as per the provided data. The most recent data indicates that the POWR grade is C (Neutral). Let’s delve deeper into the details:
- HD was given a C (Neutral) grade during the week of May 20, 2023, and held a rank of #26 in its category.
- Throughout June 2023, the POWR grade remained consistent at C (Neutral), ranging from rank #30 to #27 among the 58 stocks in its category.
- In July 2023, the grade improved to B (Buy), remaining there for the rest of the month as the rank oscillated between #20 and #22.
- In August 2023, the grade continued being B (Buy), but the rank reached #16 at its best and bumped to #23 at its worst.
- The rank intermittently lowered in September despite maintaining a B (Buy) POWR grade. It hit a low of #24 towards the end of the month.
- During the early weeks of October 2023, HD kept a B (Buy) grade with ranks between #25 and #24.
- However, the grade reverted to C (Neutral) in the last week of October and stayed thus throughout the first half of November, where it held ranks between #30 and #28. As of November 13, HD has a rank of #27.
Hence, adopt caution since the POWR grade and rank among other stocks in the category have been relatively unstable over the timeframe.
The following analysis pertains to the POWR Ratings for HD. Focusing narrowly on the three most noteworthy dimensions, we find Quality, Stability, and Momentum as the highest-rated aspects.
Quality: This dimension consistently exhibits the highest overall value across the observed time frame, maintaining a rating of 89 from May to November 2023. This illustrates HD’s consistently high performance in terms of profitability and its financial strength.
Stability: The Stability dimension showcases clear upward trends, starting at 83 in May 2023 and reaching 90 by October 2023. This suggests an increasingly stable financial course for Home Depot over these months.
Momentum: Beginning at 50 in May 2023, the Momentum score increases noticeably to peak at 69 in July and September 2023. Although there is a slight decrease towards November 2023 (67), the overall trend in Momentum is upward.
It’s important to remember that these POWR Ratings dimensions provide valuable insights into various vital aspects of HD’s performance, each shining light on different aspects of its overall business health.
How does The Home Depot, Inc. (HD) Stack Up Against its Peers?
Other stocks in the Home Improvement & Goods sector that may be worth considering are Hamilton Beach Brands Holding Company (HBB), Alarm.com Holdings, Inc. (ALRM), and Steelcase Inc. (SCS) – they have better POWR Ratings. Click here to explore more Home Improvement & Goods stocks.
What To Do Next?
Discover 10 widely held stocks that our proprietary model shows have tremendous downside potential. Please make sure none of these “death trap” stocks are lurking in your portfolio:
Want More Great Investing Ideas?
HD shares were trading at $289.11 per share on Monday afternoon, down $2.48 (-0.85%). Year-to-date, HD has declined -6.55%, versus a 16.47% rise in the benchmark S&P 500 index during the same period.
About the Author: Anushka Dutta

Anushka is an analyst whose interest in understanding the impact of broader economic changes on financial markets motivated her to pursue a career in investment research. More...
More Resources for the Stocks in this Article
| Ticker | POWR Rating | Industry Rank | Rank in Industry |
| HD | Get Rating | Get Rating | Get Rating |
| HBB | Get Rating | Get Rating | Get Rating |
| ALRM | Get Rating | Get Rating | Get Rating |
| SCS | Get Rating | Get Rating | Get Rating |


