

Shares of M/I Homes, Inc. (MHO - Get Rating) have experienced strong positive price performance in recent weeks, beating the broader market. The stock has gained 41.2% year-to-date and 8% over the past month, outperforming the S&P 500’s 7.7% and 4.7% over the respective periods.
Additionally, the stock closed its last trading session at $65.19, above its 50-day moving average of $59.97 and 200-day moving average of $48.93, indicating an uptrend. On top of it, U.S. homebuilder sentiment is improving, providing a solid buying opportunity for those looking to add MHO to their portfolios. Taking a closer look at the financial metrics of this stock shows why it could be a wise pick.
M/I Homes Inc. (MHO): Net Income, P/E Ratio, Revenue, and Gross Margin Analysis
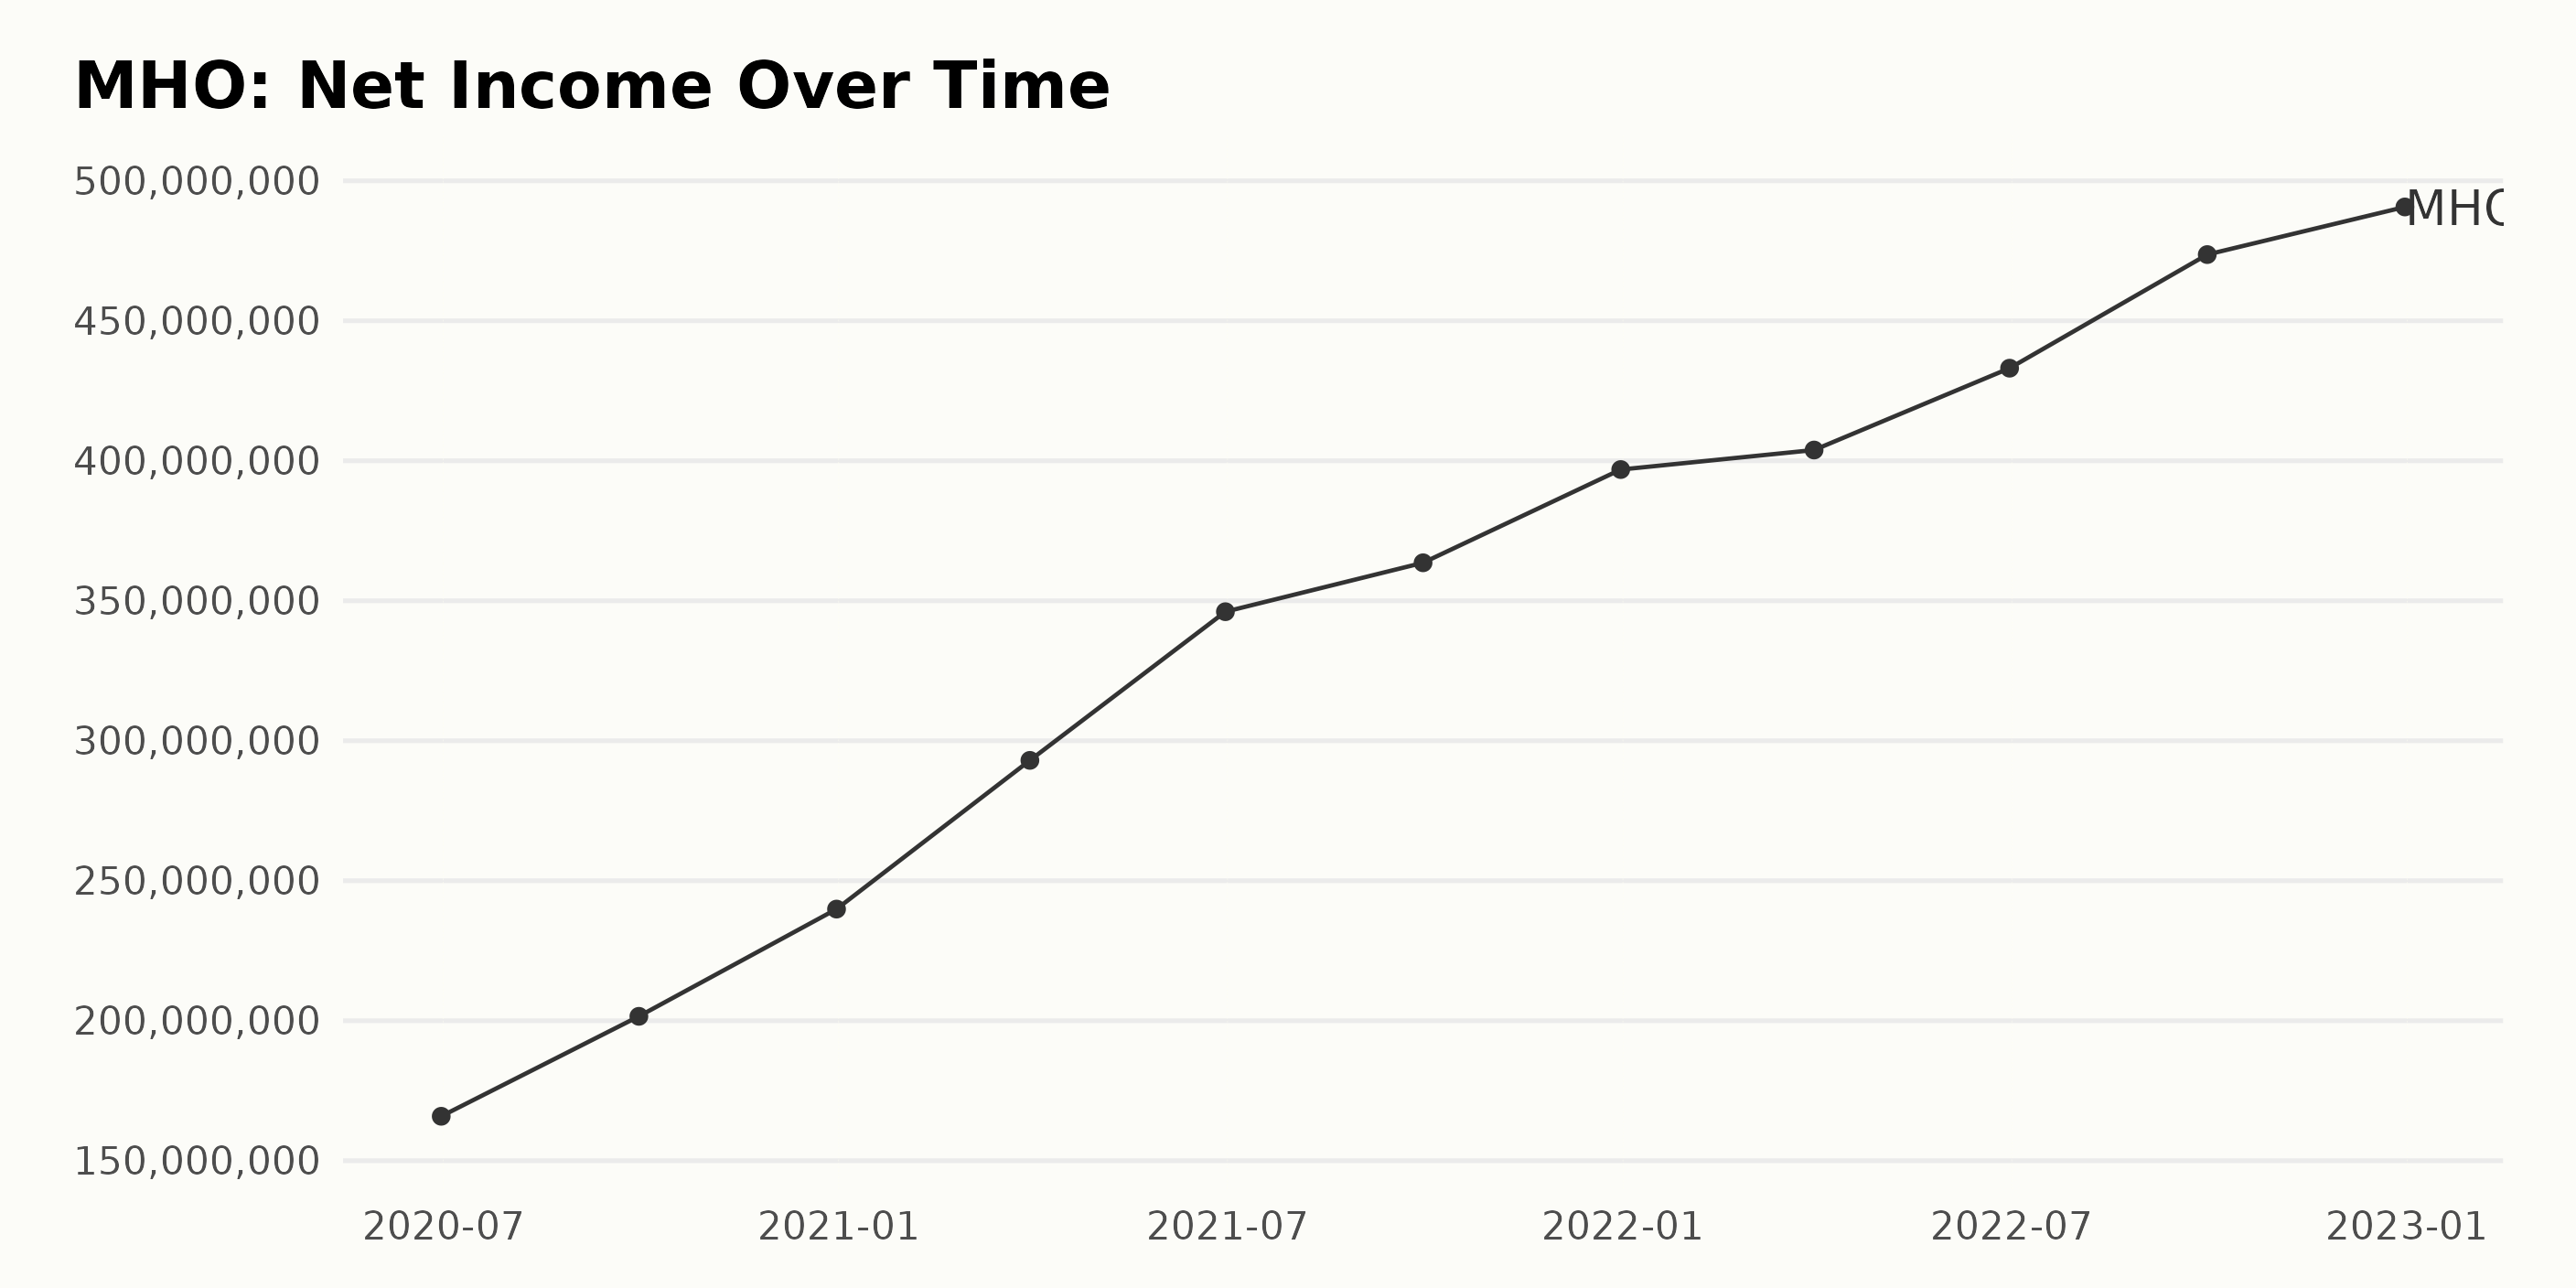
MHO experienced significant fluctuations in its net income over the last two years. In June 2020, the reported net income was $166.87 million, increasing to $473.65 million in September 2022. This represents a growth rate of 184%. Notably, the most recent data from December 2022 reported a $490.66 million net income, an increase of $128.99 million from December 2021.
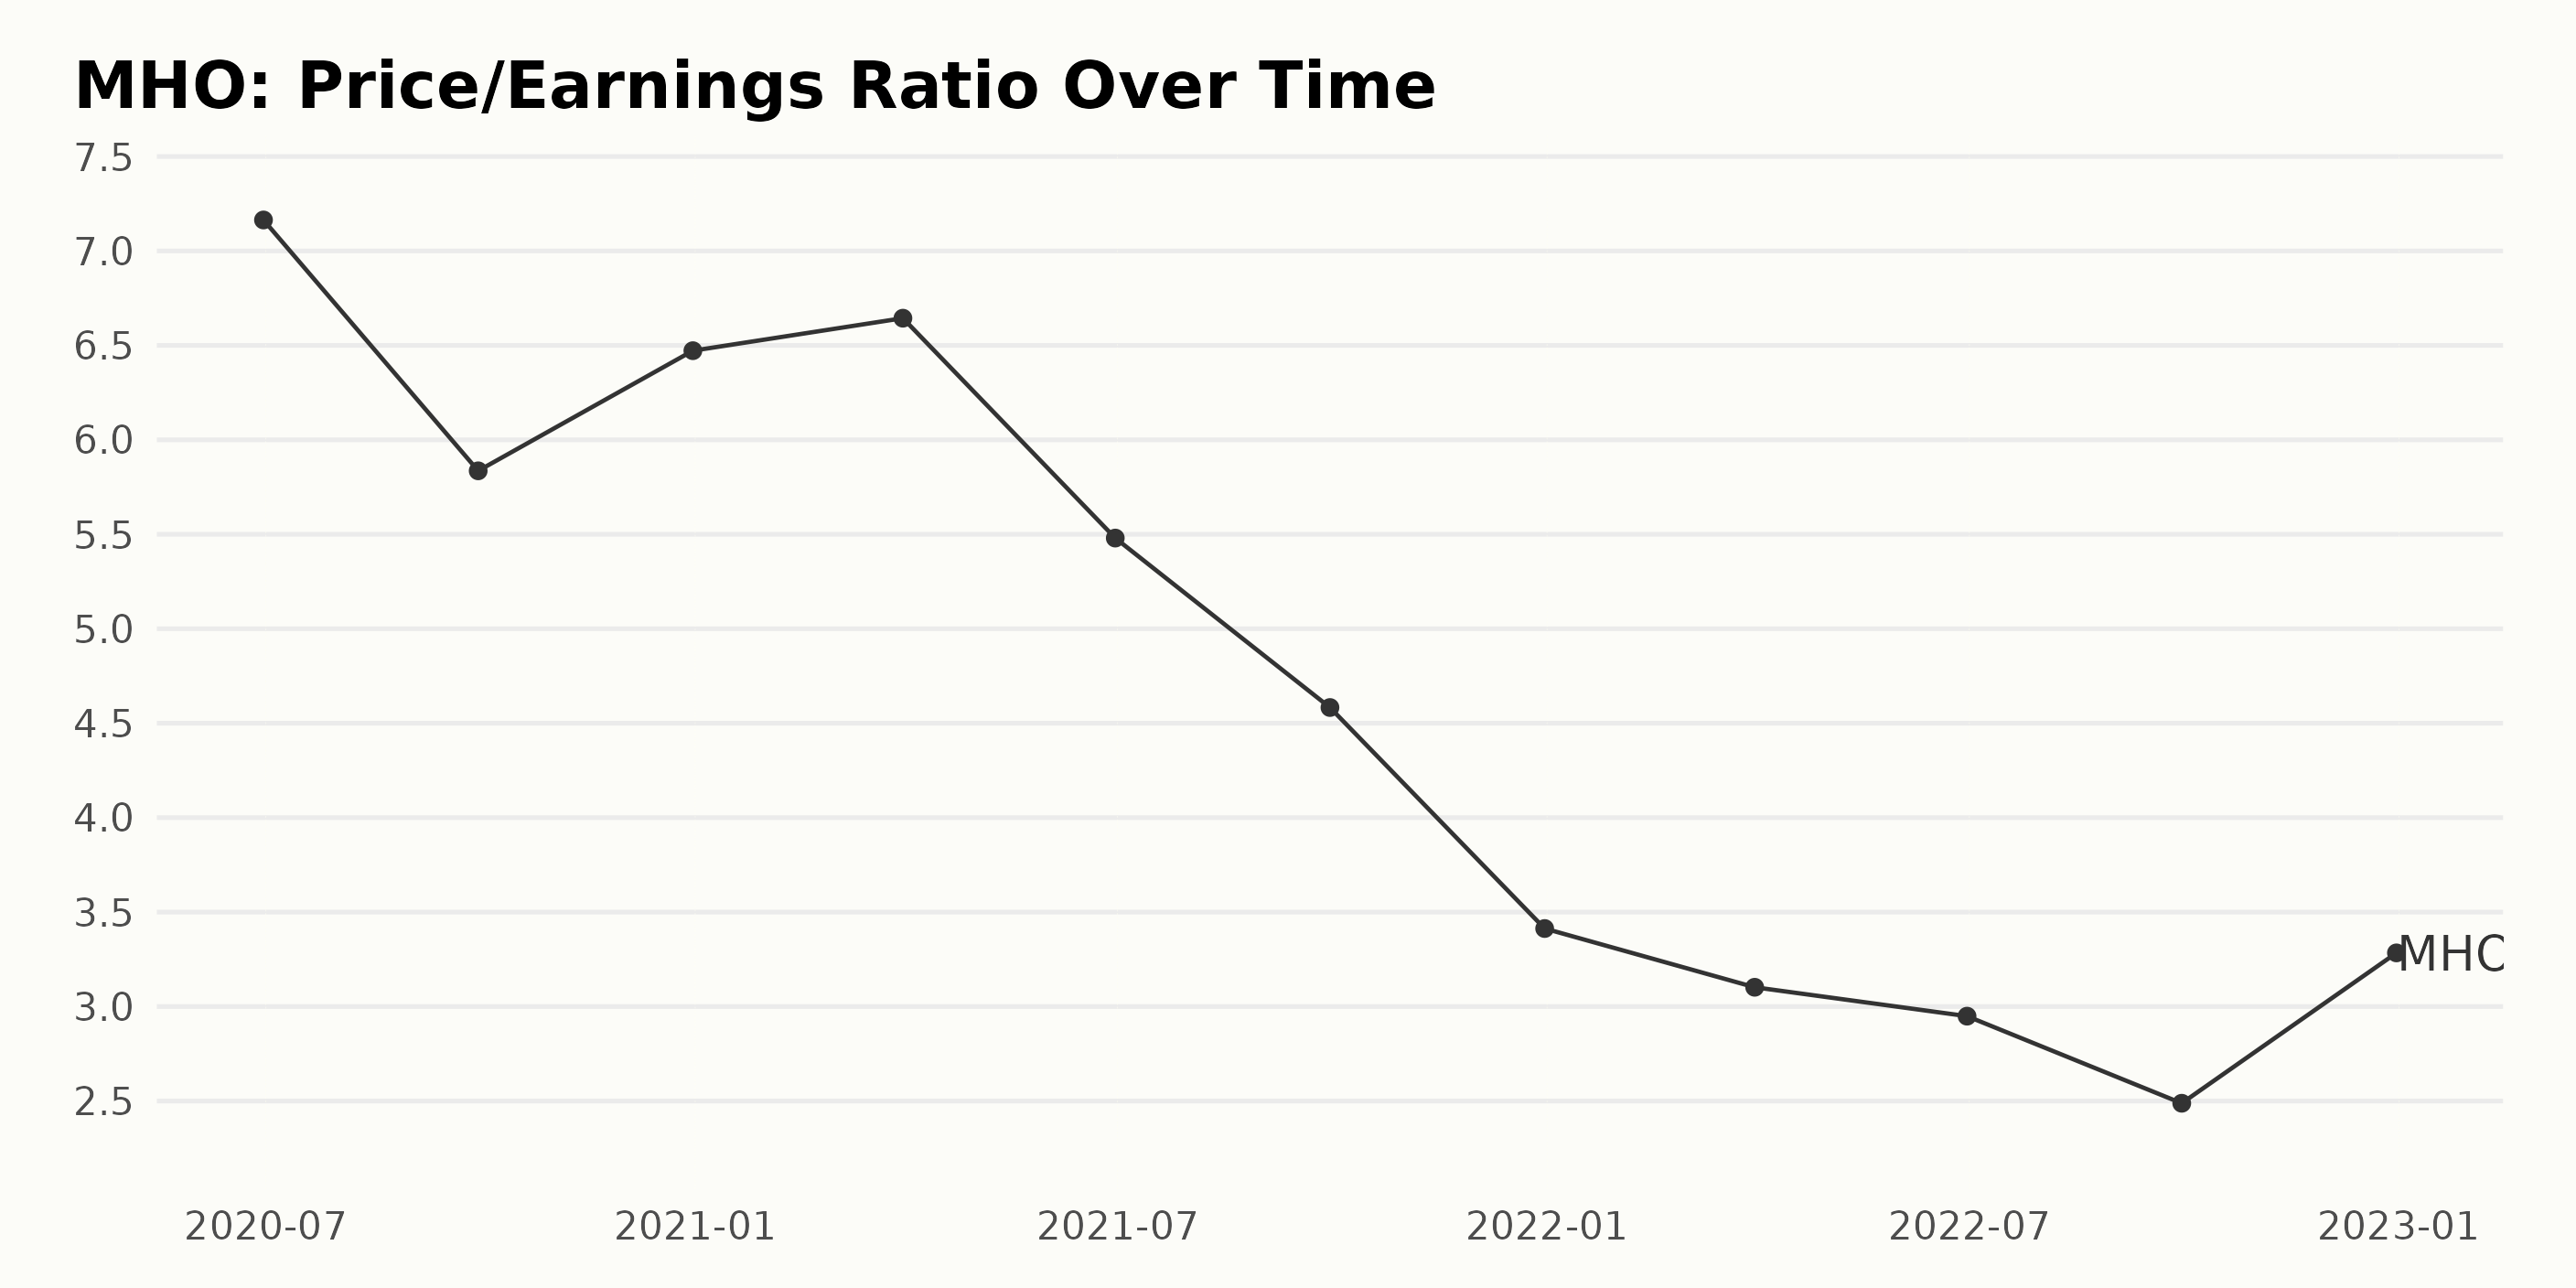
MHO has experienced fluctuations in its Price/Earnings (P/E) ratio since June 2020. The P/E ratio peaked at 7.16 in June 2020 before dropping to a low of 2.49 in September 2022. The latest P/E ratio of 3.28 in December 2022 is higher than the low point but still down significantly from the starting point. Over the period, the P/E ratio has decreased by roughly 54%.
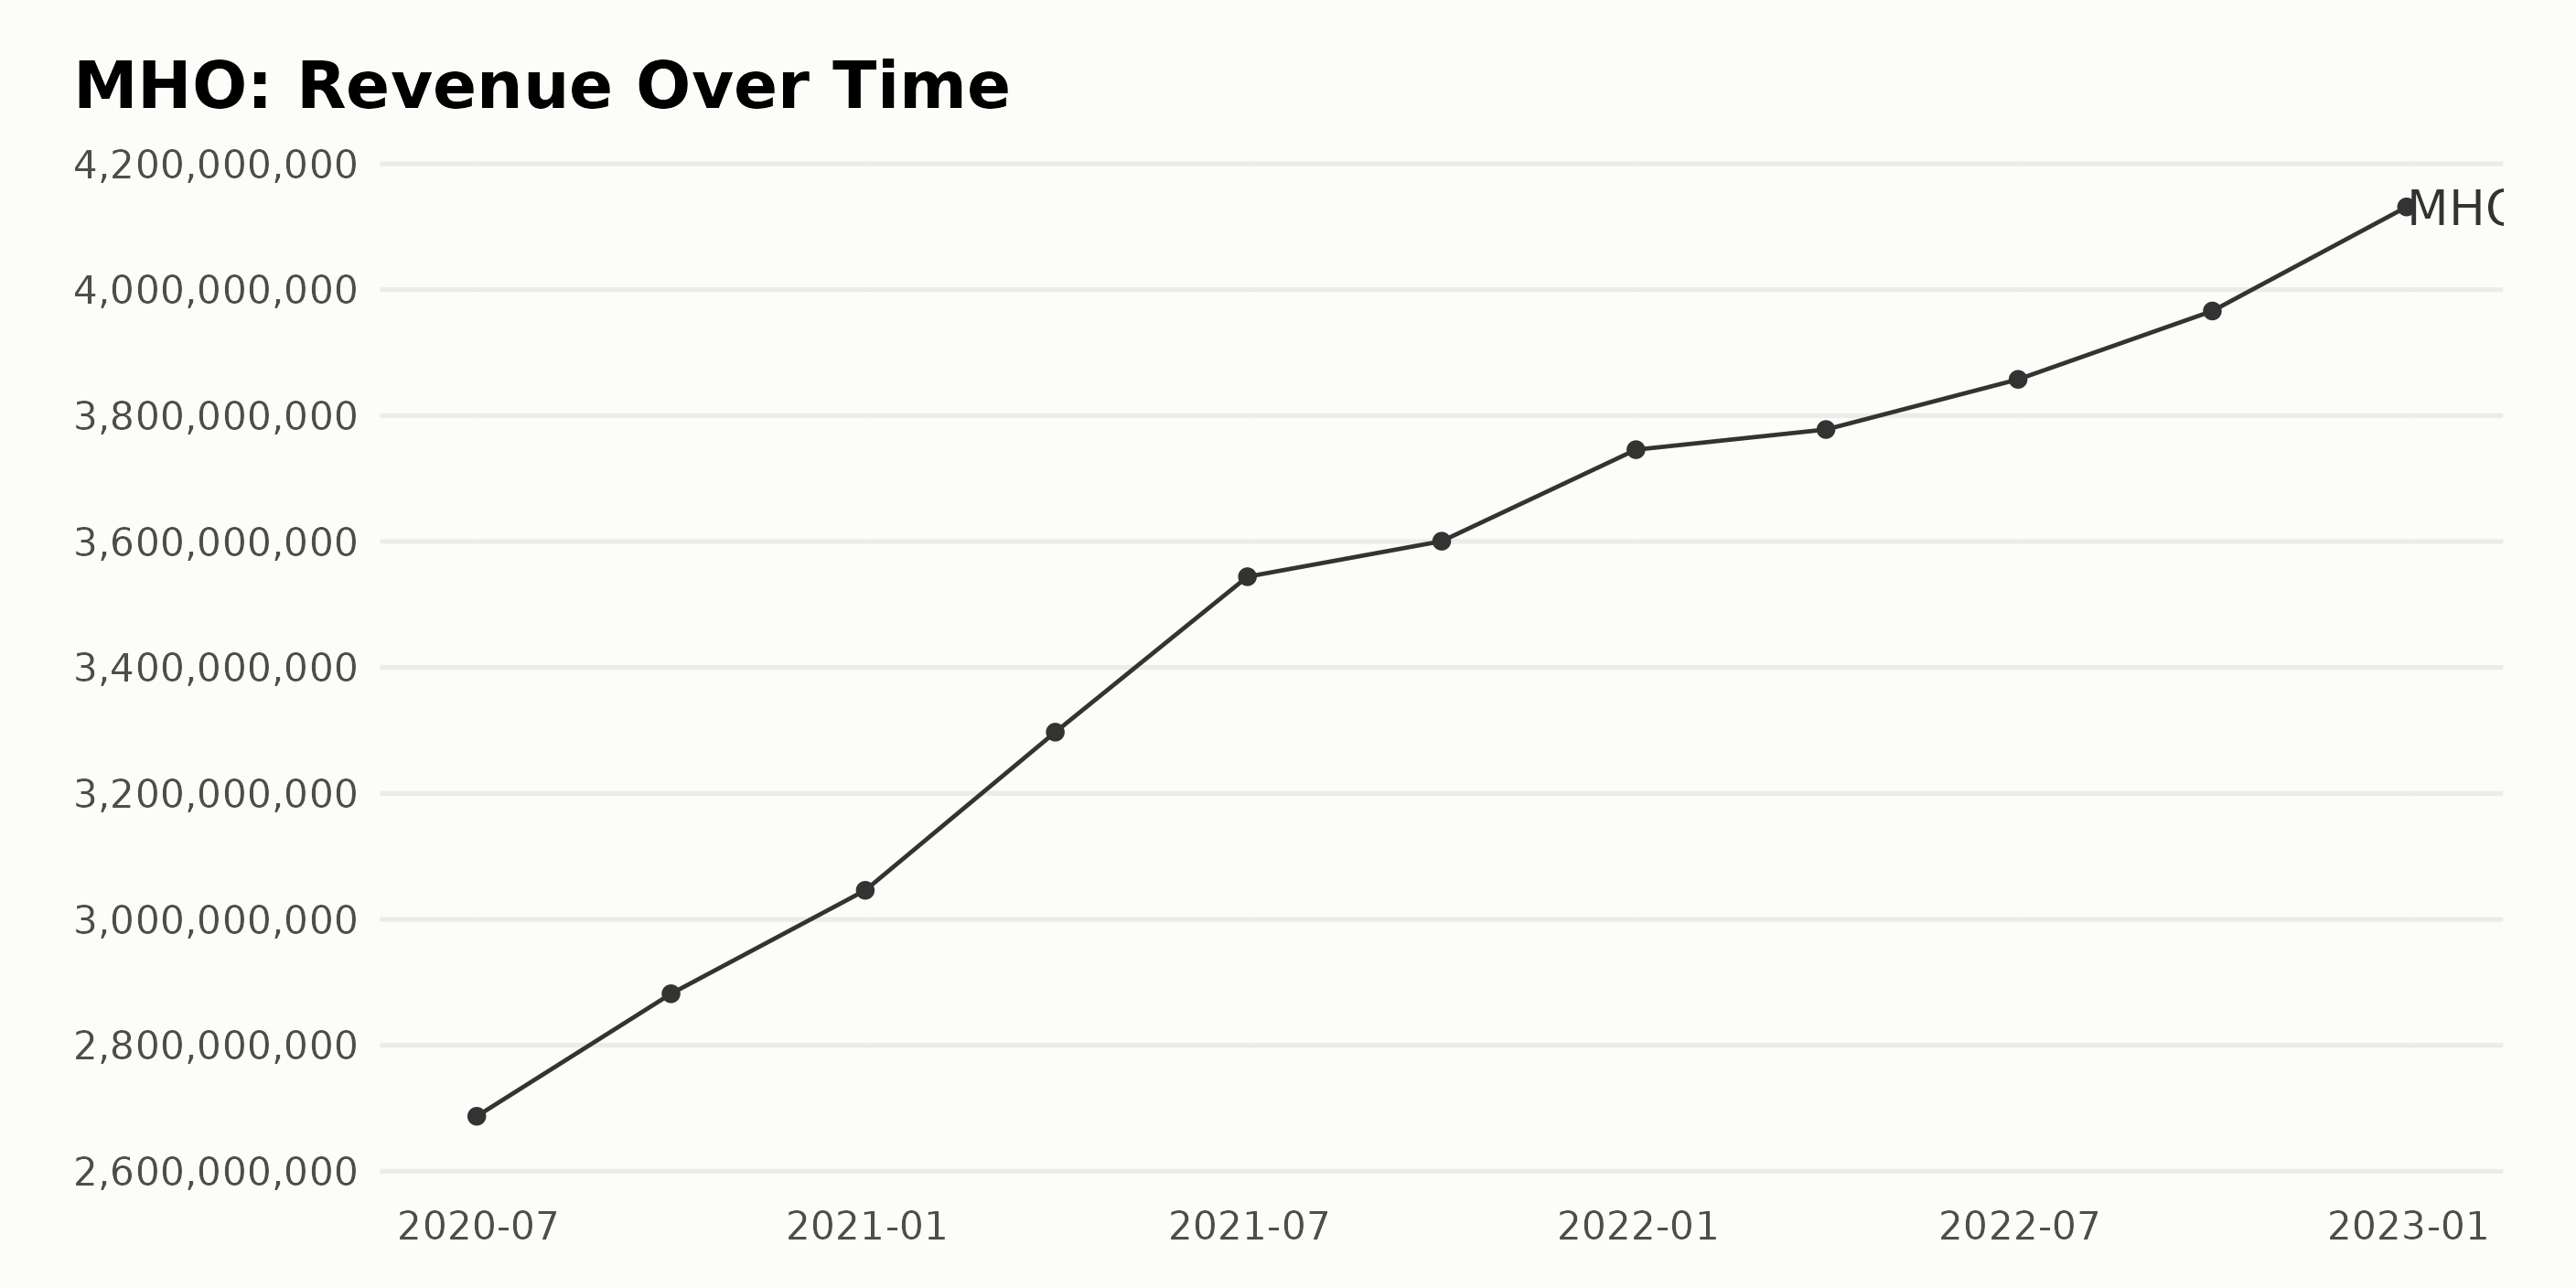
MHO has seen generally increasing revenues overall from Jun 30, 2020 ($268.73 million) to Dec 31, 2022 ($413.14 million), with the greatest growth occurring between June 30, 2021, and September 30, 2021 ($360.06 million to $396.61 million, or a 10.9% increase). There have been some slight fluctuations along the way, including a decrease of 3.5% between December 31, 2020, and March 31, 2021 ($304.61 million to $329.73 million).
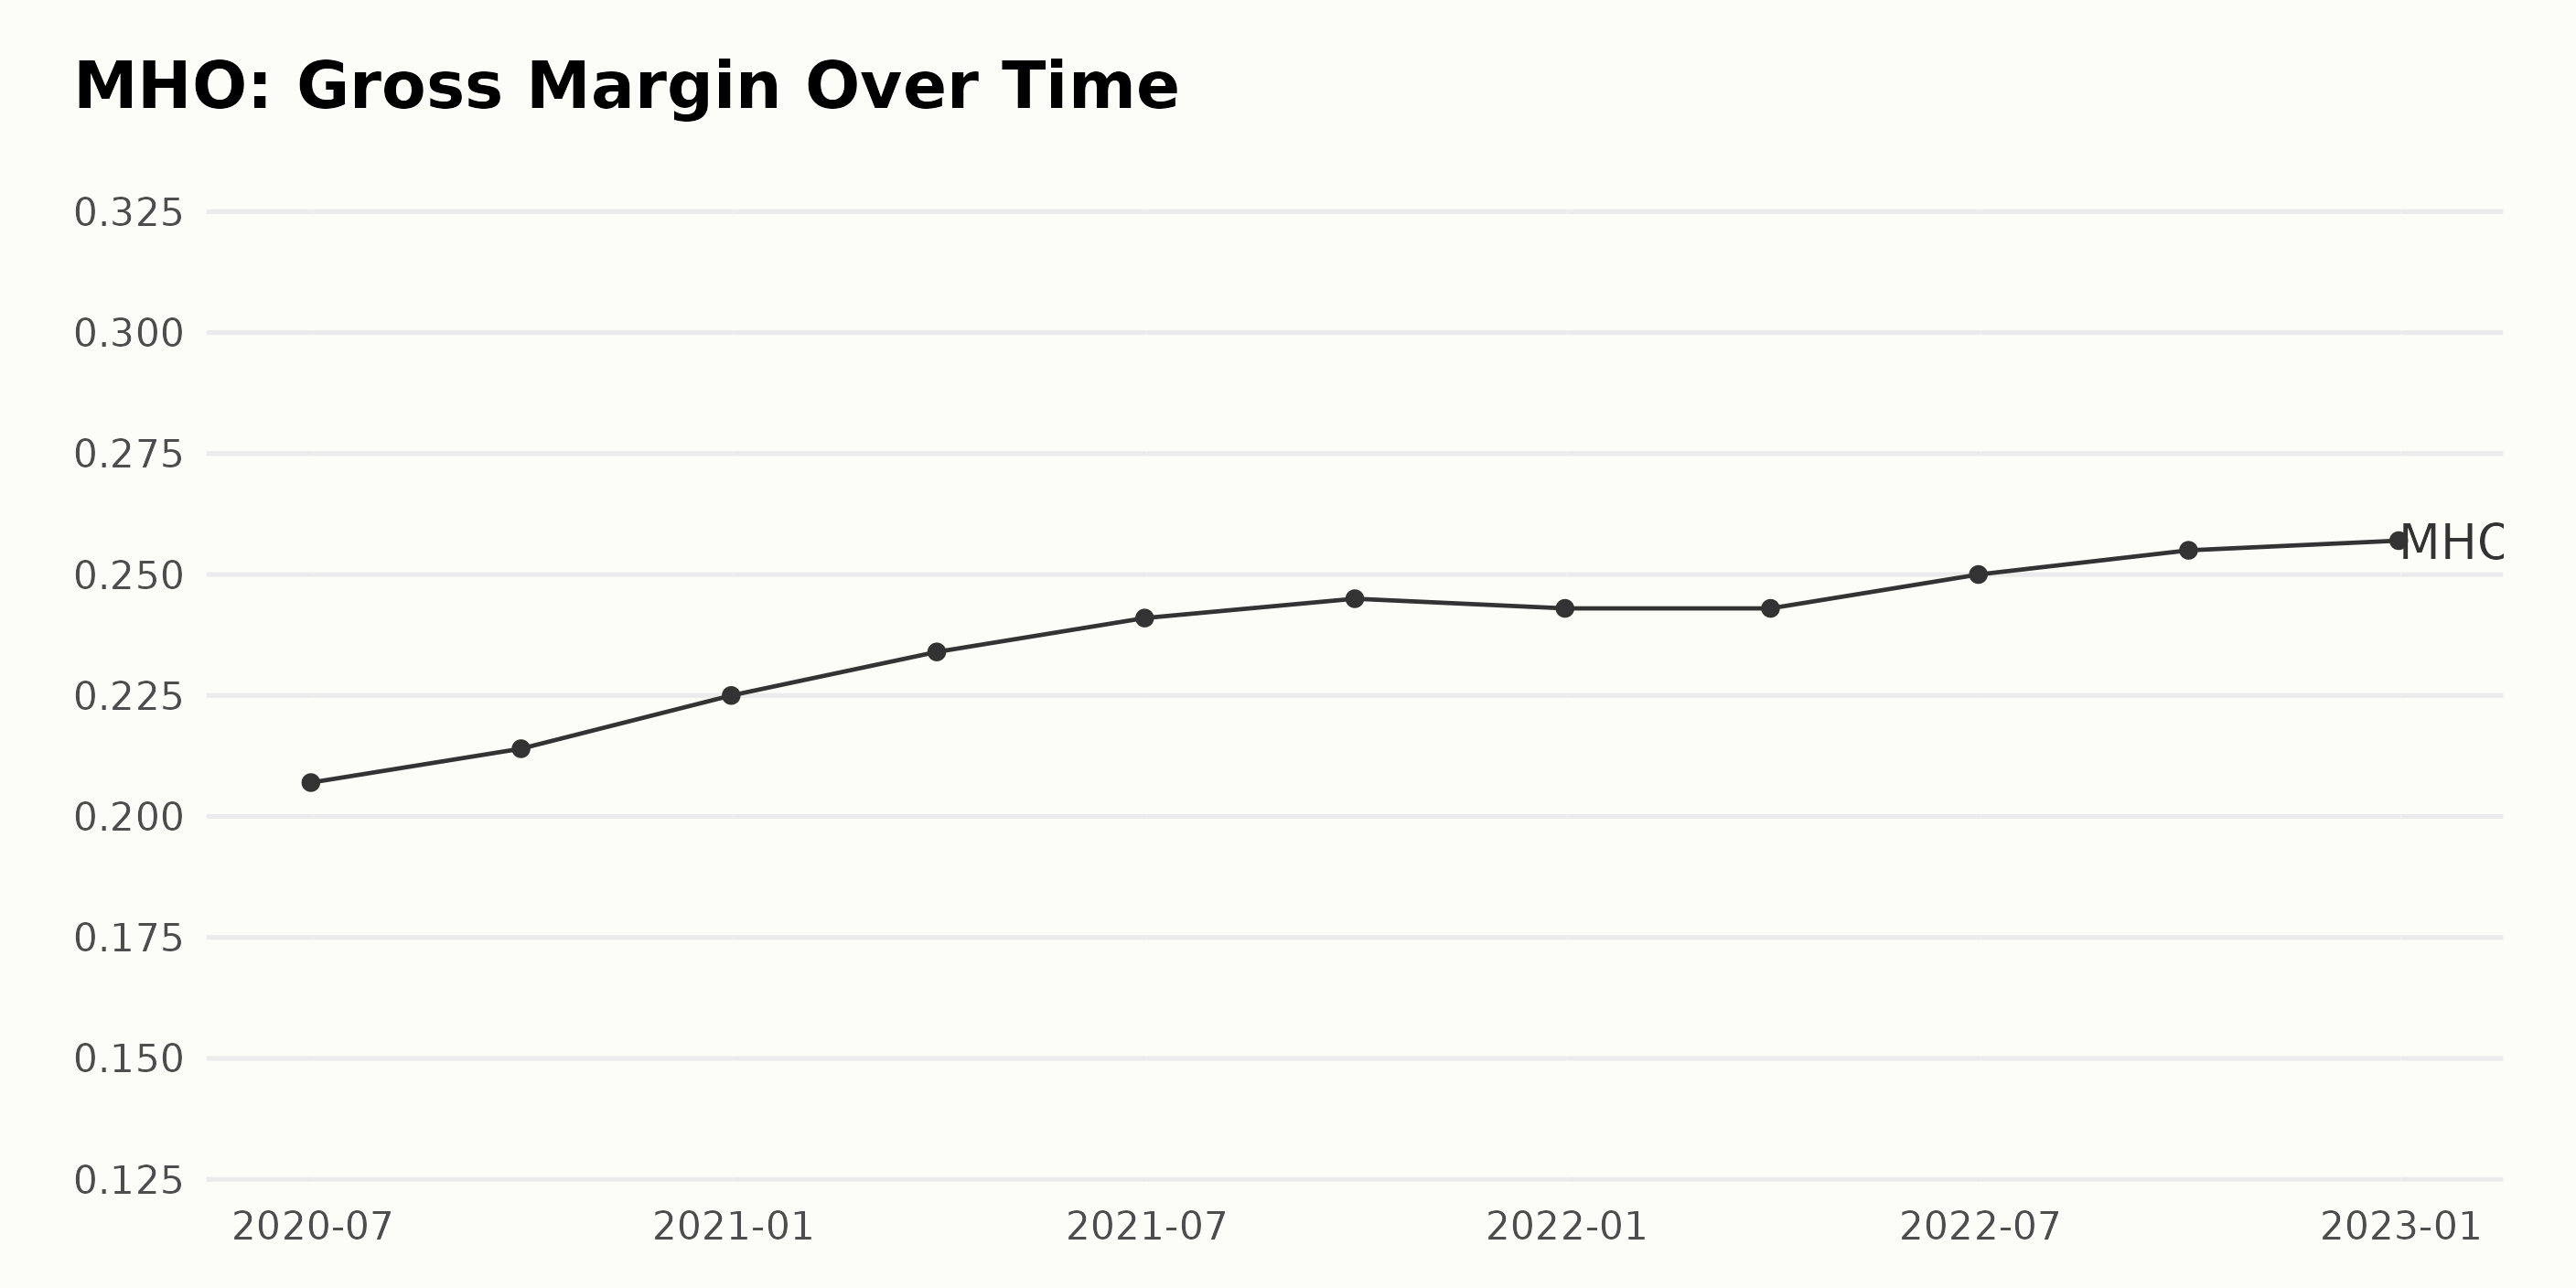
MHO’s gross margin has been steadily increasing since June 2020, when it stood at 20.7%. As of December 2021, the gross margin had risen to 25.7%, representing a 24.7% growth rate. There have been fluctuations along the way, such as a slight decrease between September 2020 and December 2020 and between December 2021 and March 2022; however, these were relatively minor and not sustained.
M/I Homes Inc. Soars 40% in 6 Months
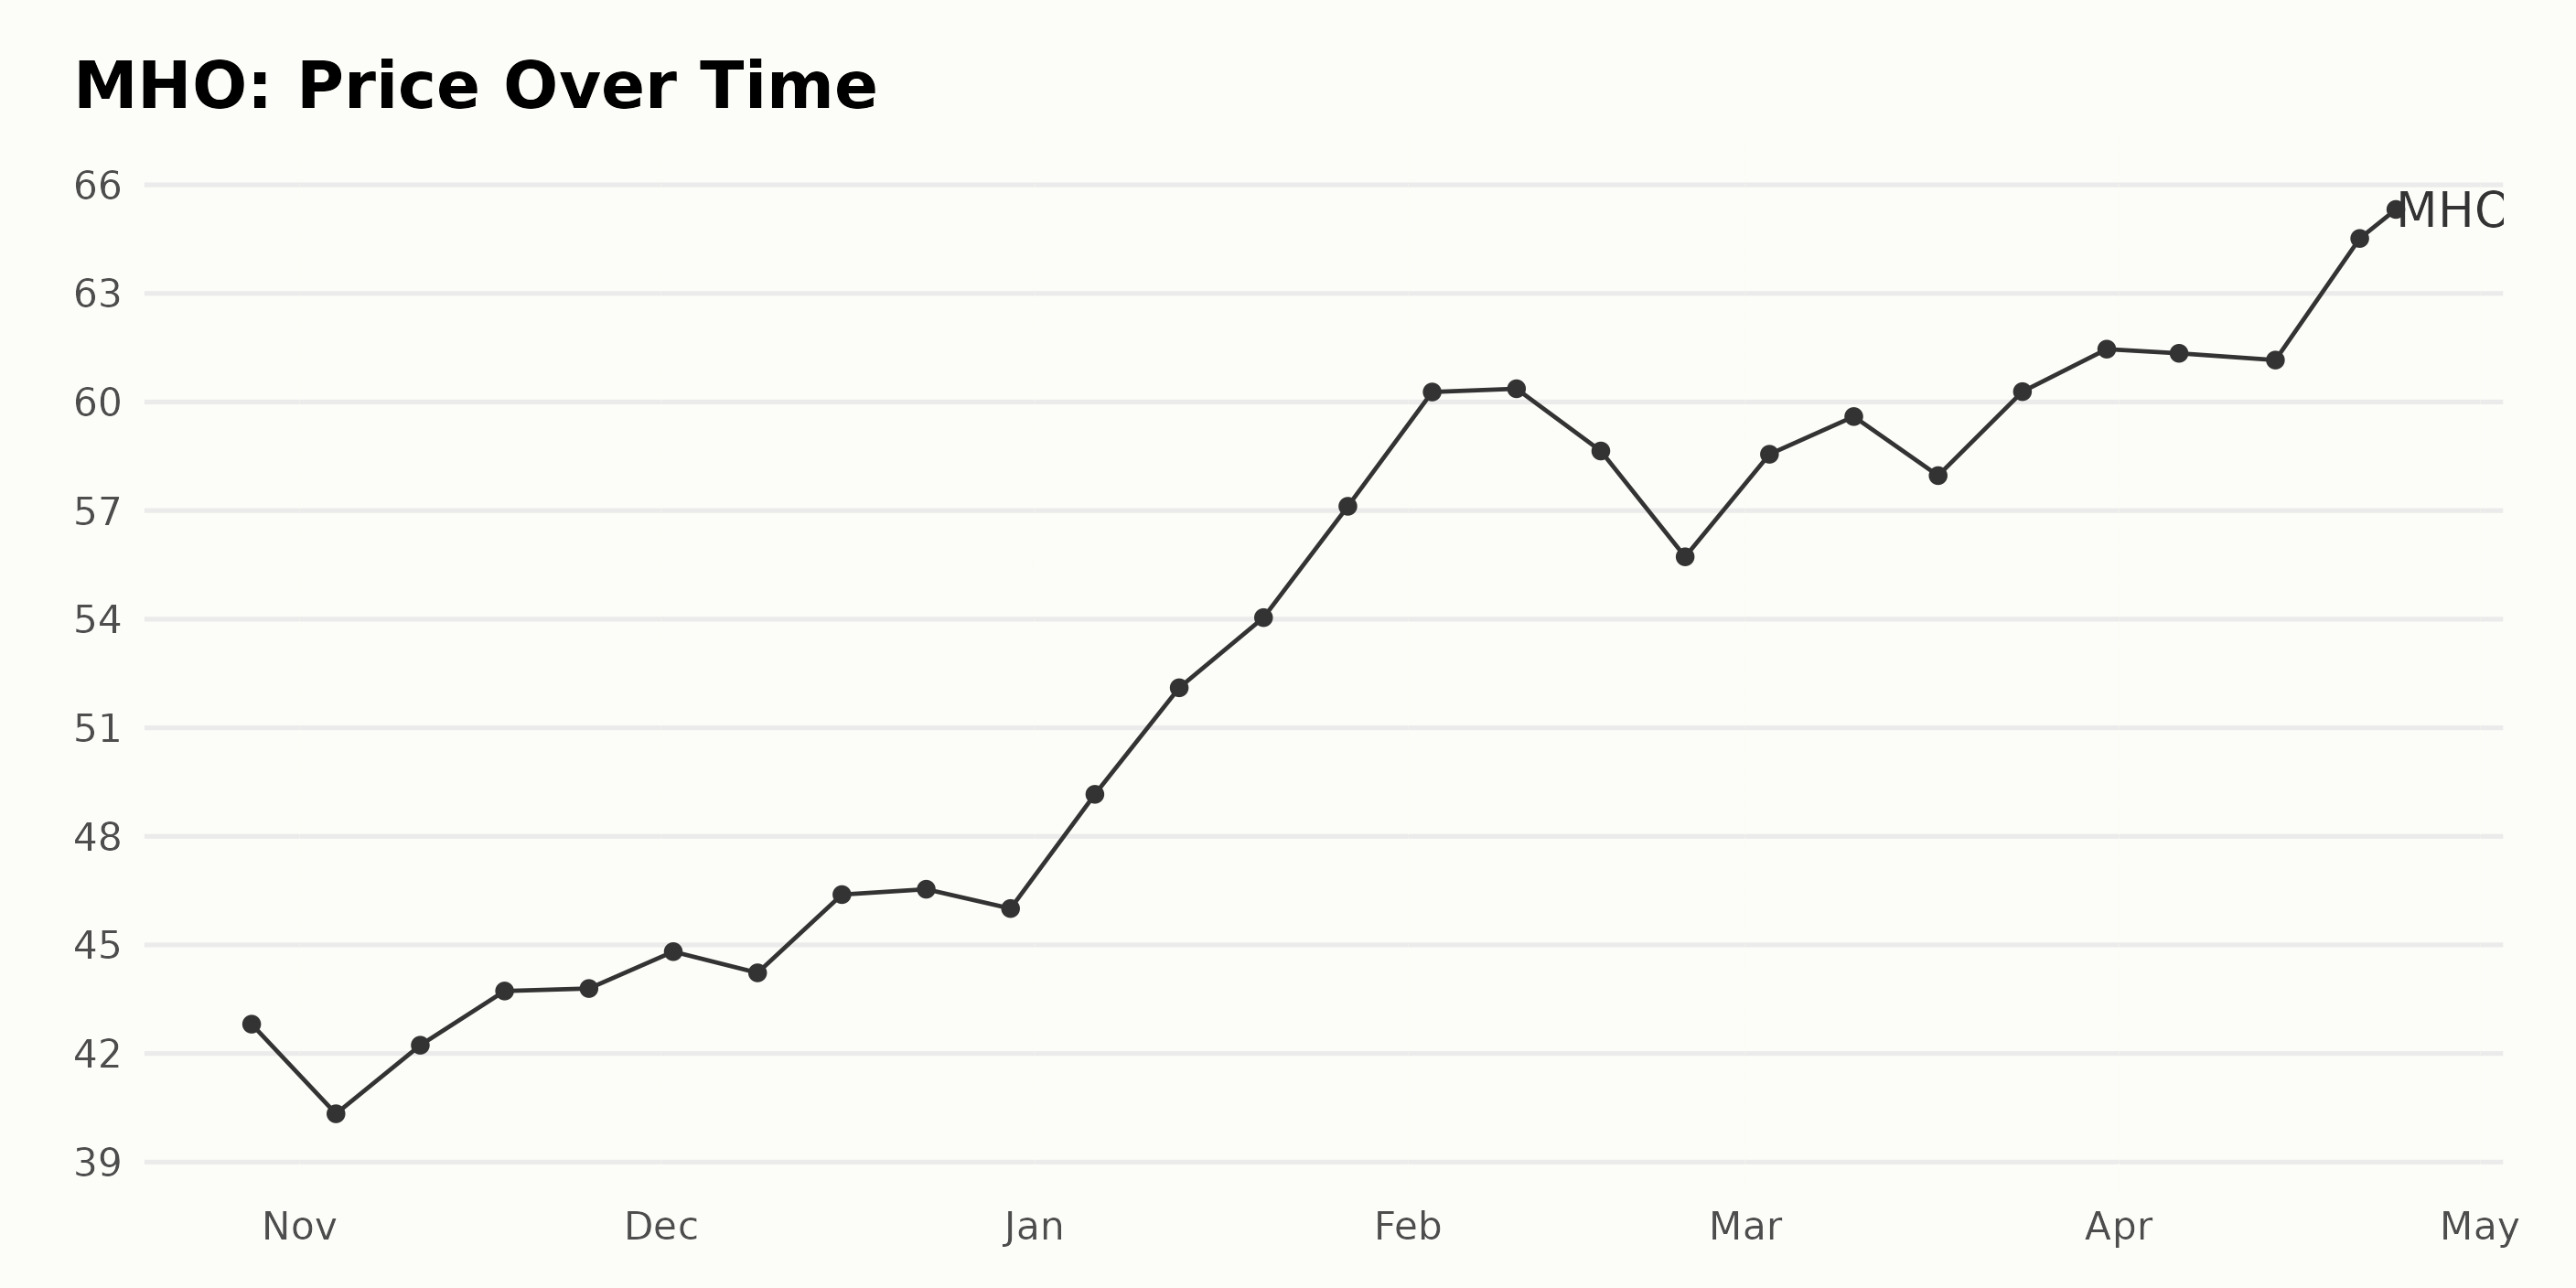
MHO has experienced an overall rising trend in its share price from October 2022 ($42.81) to April 2023 ($64.52). The growth rate over this period of time appears to be accelerating, with the share price increasing from $46.01 at the beginning of December 2022 to the current price of $64.52 at the end of April 2023, a growth of about 40%. Here is a chart of MHO’s price over the past 180 days.
M/I Homes Inc.’s Positive POWR Ratings
MHO has an overall POWR Ratings grade of A, which places it in the top rank in the B-rated Homebuilders industry. It received its highest grade of A on February 25, 2023, and has maintained that ranking since then. MHO’s latest rank in the category is #1 out of 24 stocks, which is the best rank possible.
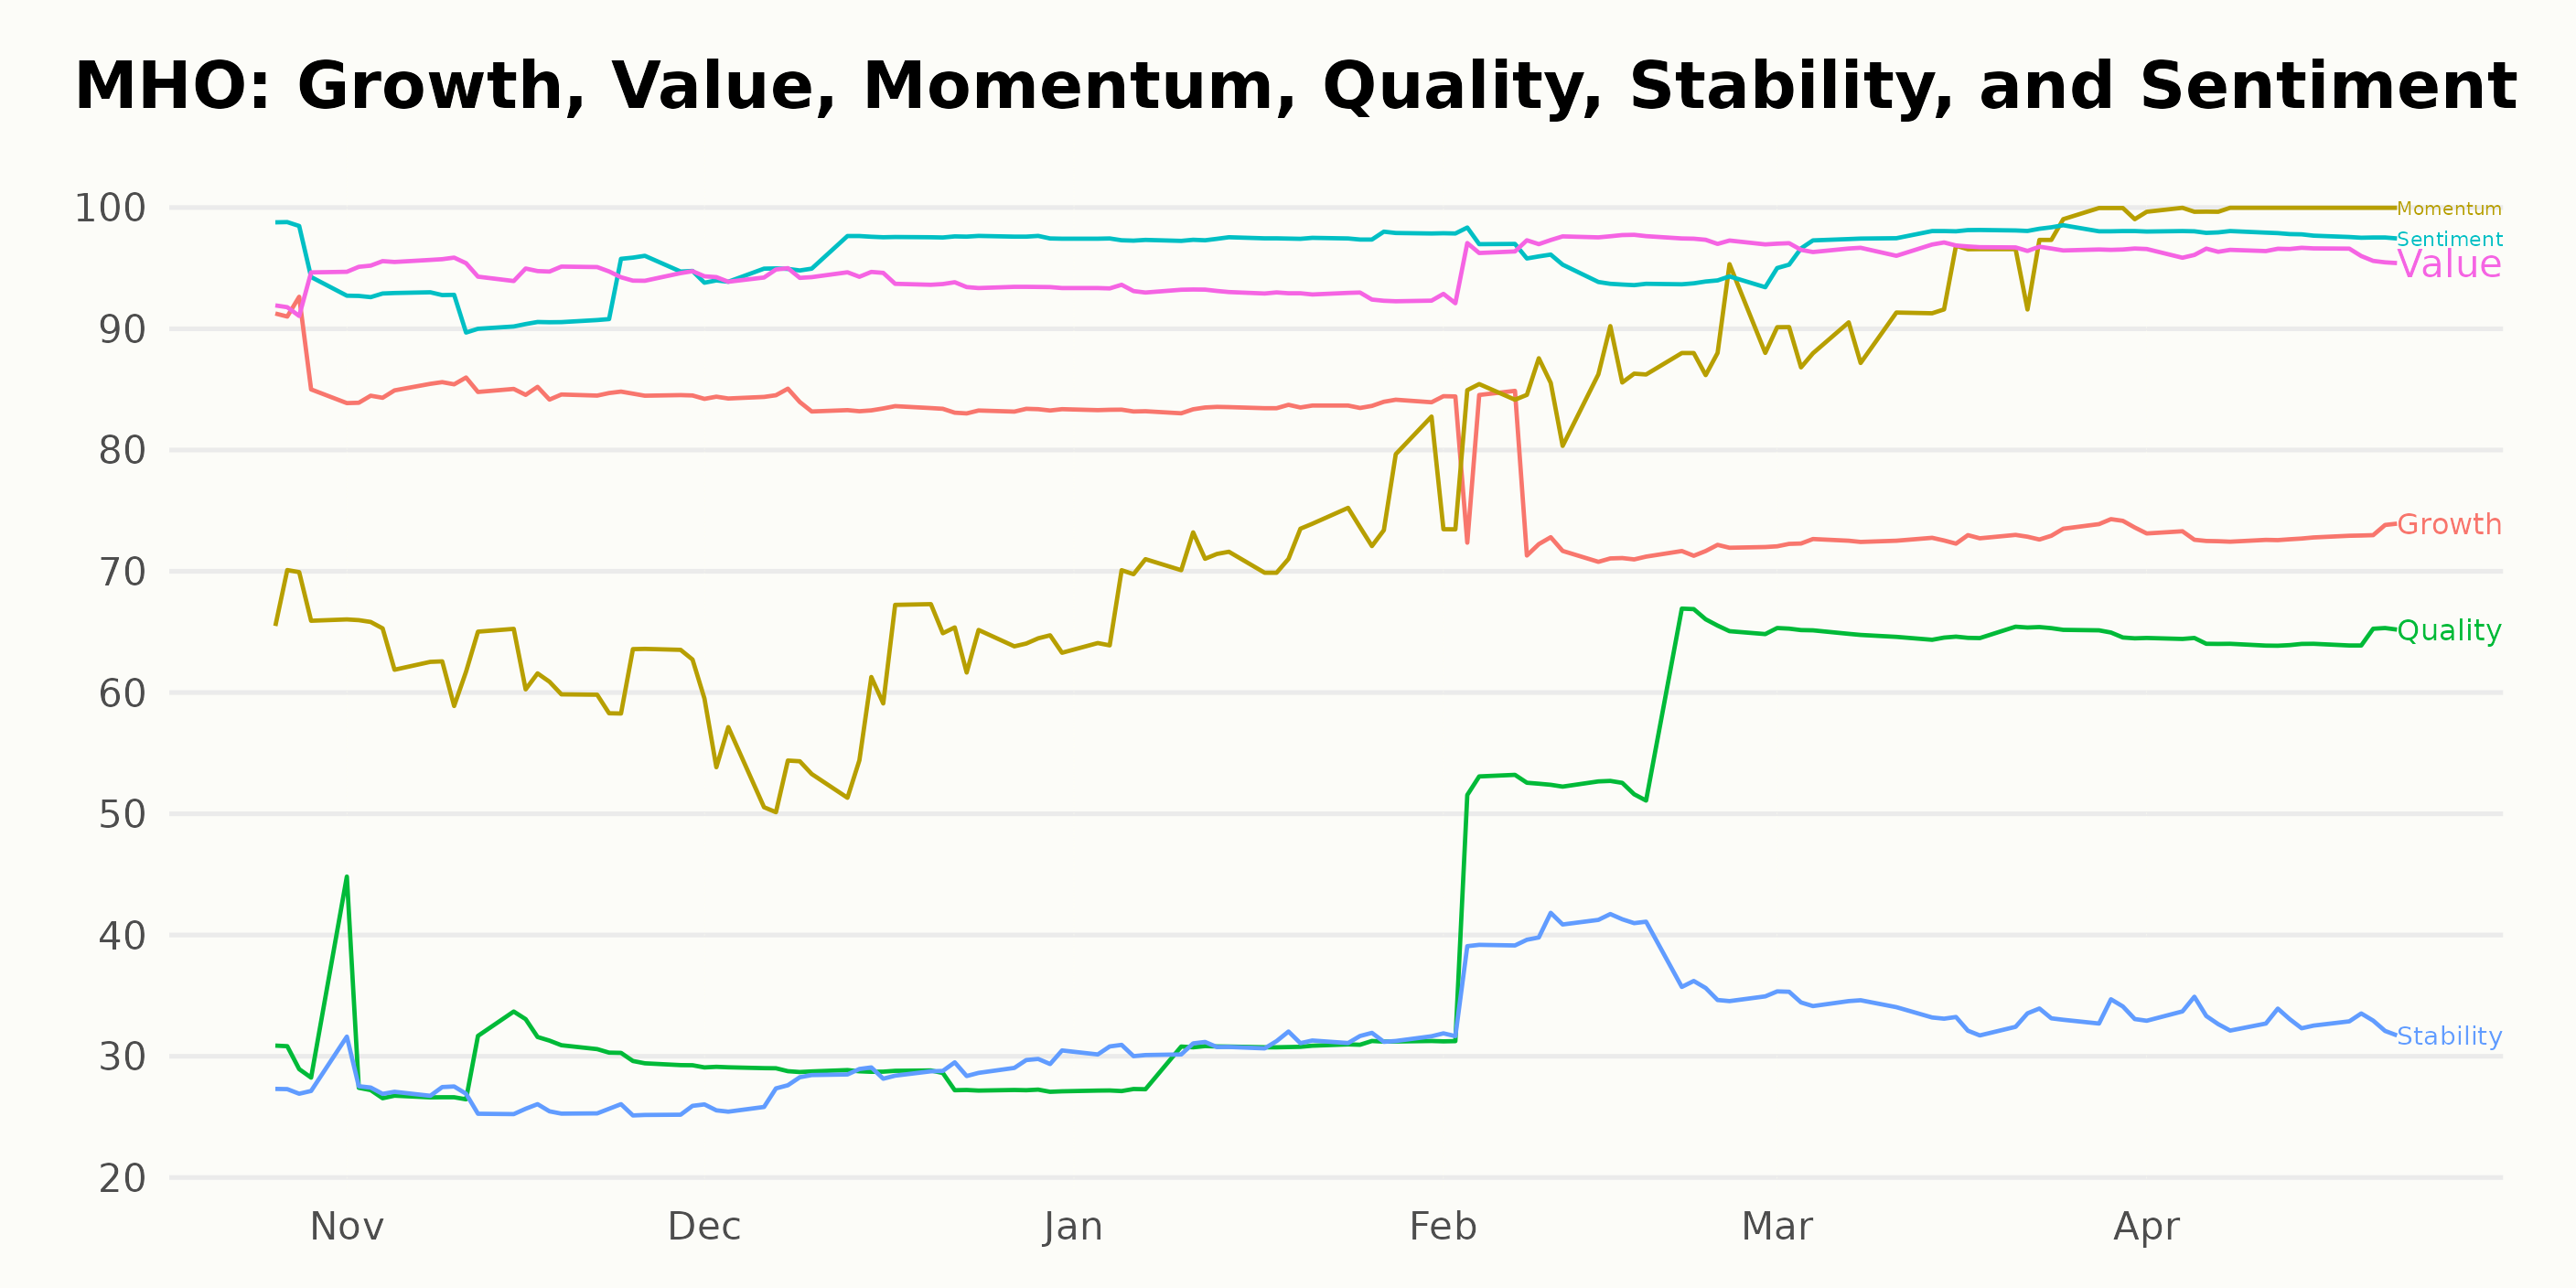
The POWR Ratings for MHO provide insight into the company’s performance along six dimensions. From October 2022 to April 2023, the three highest-rated dimensions were consensus Sentiment, with a maximum rating of 98, Value, with a range from 92 to 97, and Growth, with a range from 74 to 90.
Momentum and Stability also had decent ratings, with peak ratings of 100 and 38 for Momentum and Stability, respectively. Quality had the lowest rating at 30, with a visible decreasing trend. Overall the company appears to have positive growth prospects and is perceived positively by the market.
How Does M/I Homes Inc. (MHO) Stack Up Against Its Peers?
Other stocks in the Homebuilders sector that may be worth considering are TRI Pointe Homes, Inc. (TPH - Get Rating), Taylor Morrison Home Corporation (TMHC - Get Rating), and PulteGroup, Inc. (PHM - Get Rating).
The Bear Market is NOT Over…
That is why you need to discover this timely presentation with a trading plan and top picks from 40 year investment veteran Steve Reitmeister:
REVISED: 2023 Stock Market Outlook >
Want More Great Investing Ideas?
MHO shares were trading at $65.44 per share on Monday morning, up $0.25 (+0.38%). Year-to-date, MHO has gained 41.71%, versus a 8.35% rise in the benchmark S&P 500 index during the same period.
About the Author: Anushka Dutta

Anushka is an analyst whose interest in understanding the impact of broader economic changes on financial markets motivated her to pursue a career in investment research. More...
More Resources for the Stocks in this Article
| Ticker | POWR Rating | Industry Rank | Rank in Industry |
| MHO | Get Rating | Get Rating | Get Rating |
| TPH | Get Rating | Get Rating | Get Rating |
| TMHC | Get Rating | Get Rating | Get Rating |
| PHM | Get Rating | Get Rating | Get Rating |


