

Roivant Sciences Ltd. (ROIV - Get Rating) continues to advance its clinical programs, expanding possibilities within the realm of autoimmune therapies. In terms of financial performance, the company posted a substantial increase in revenue, climbing to $37.10 million for the fiscal second quarter ended September 2023.
However, on the bottom line, it recorded a wider net loss for the same period of $331.12 million. This equates to a net loss per common share of $0.40. On the plus side, the company’s non-GAAP net losses exhibited a minor drop, falling to $225.39 million from $226.79 million year-on-year.
On the insider activity front, Eric Venker, the COO of ROIV, executed consecutive sales of 500,000 shares in September and 1,200,000 in October. Over the past year, the insider has sold an aggregate of 4,204,309 shares without any purchases. Insider selling at Roivant Sciences Ltd has been frequent, with 42 sell-off and just one purchase over the past year. These transactions may point to a potential lack of confidence in the company’s future prospects among insiders.
As such, it may be prudent to evaluate the company’s key financial metrics before making a decision. The current circumstance may suggest that this is not an ideal time to enter the stock. Let’s analyze some of its key financial metrices.
Analyzing ROIV’s Financial Performance: A Three Year Trend Overview from 2020 to 2023
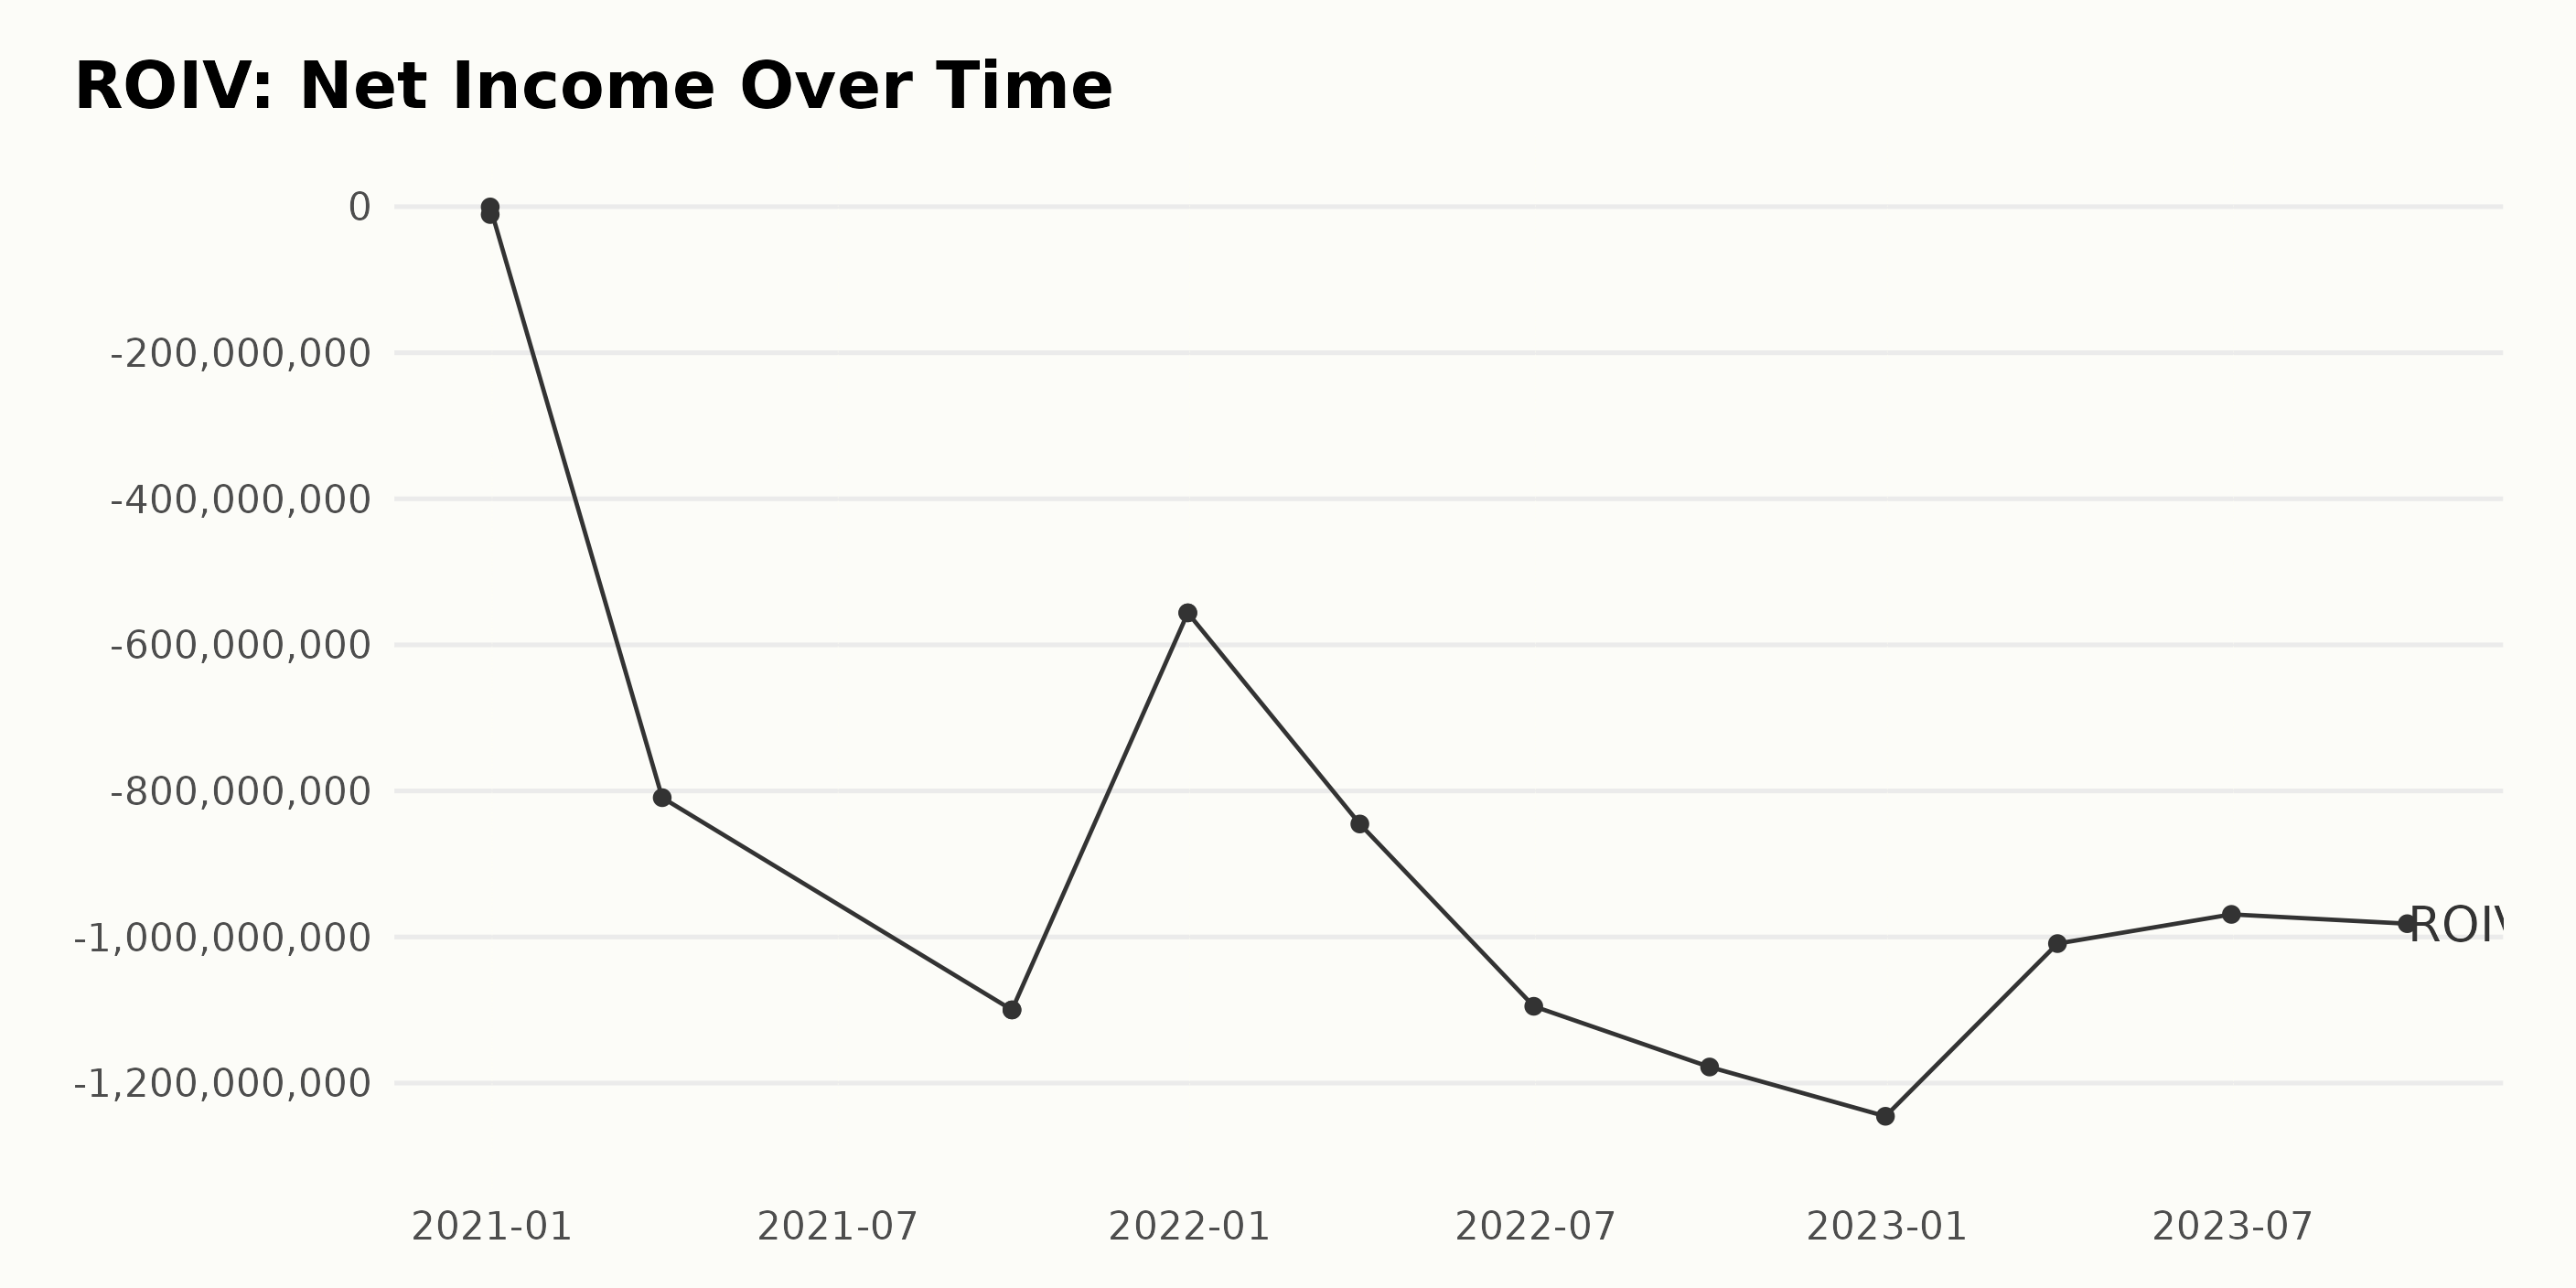
Based on the trailing-12-month Net Income of ROIV, the company has been experiencing a trend of increasing net losses over the course of three years. Given the data set:
- As of December 31, 2020, ROIV started at a relatively low net loss of -$10.77 million.
- On March 31, 2021, the company registered a significant rise in net loss to -$809.23 million.
- The company saw further deterioration by the end of the third quarter of 2021, with netinc standing at -$1.099 billion.
- There was a slight decrease in the company’s net loss by December 31, 2021, reporting -$556.18 million.
- Despite the decrease in the last quarter of 2021, ROIV’s net loss escalated again to -$845.26 million as of March 31, 2022.
- By the end of September 2022, ROIV’s net loss slightly rose to -$1.178 billion.
- As of December 31, 2022, the net loss reached its peak at -$1.245 billion.
- In the first three quarters of 2023, there was a mild reduction in the company’s net loss from -$1.009 billion in March 31 to -$981.77 million by September 30.
Overall, ROIV’s net income registered decreased income over these years, indicating the company’s deteriorating financial health. The figure has exploded from -$10.77 million in December 31, 2020 to -$981.77 million in September 30, 2023, showing a substantial increase in negative growth.
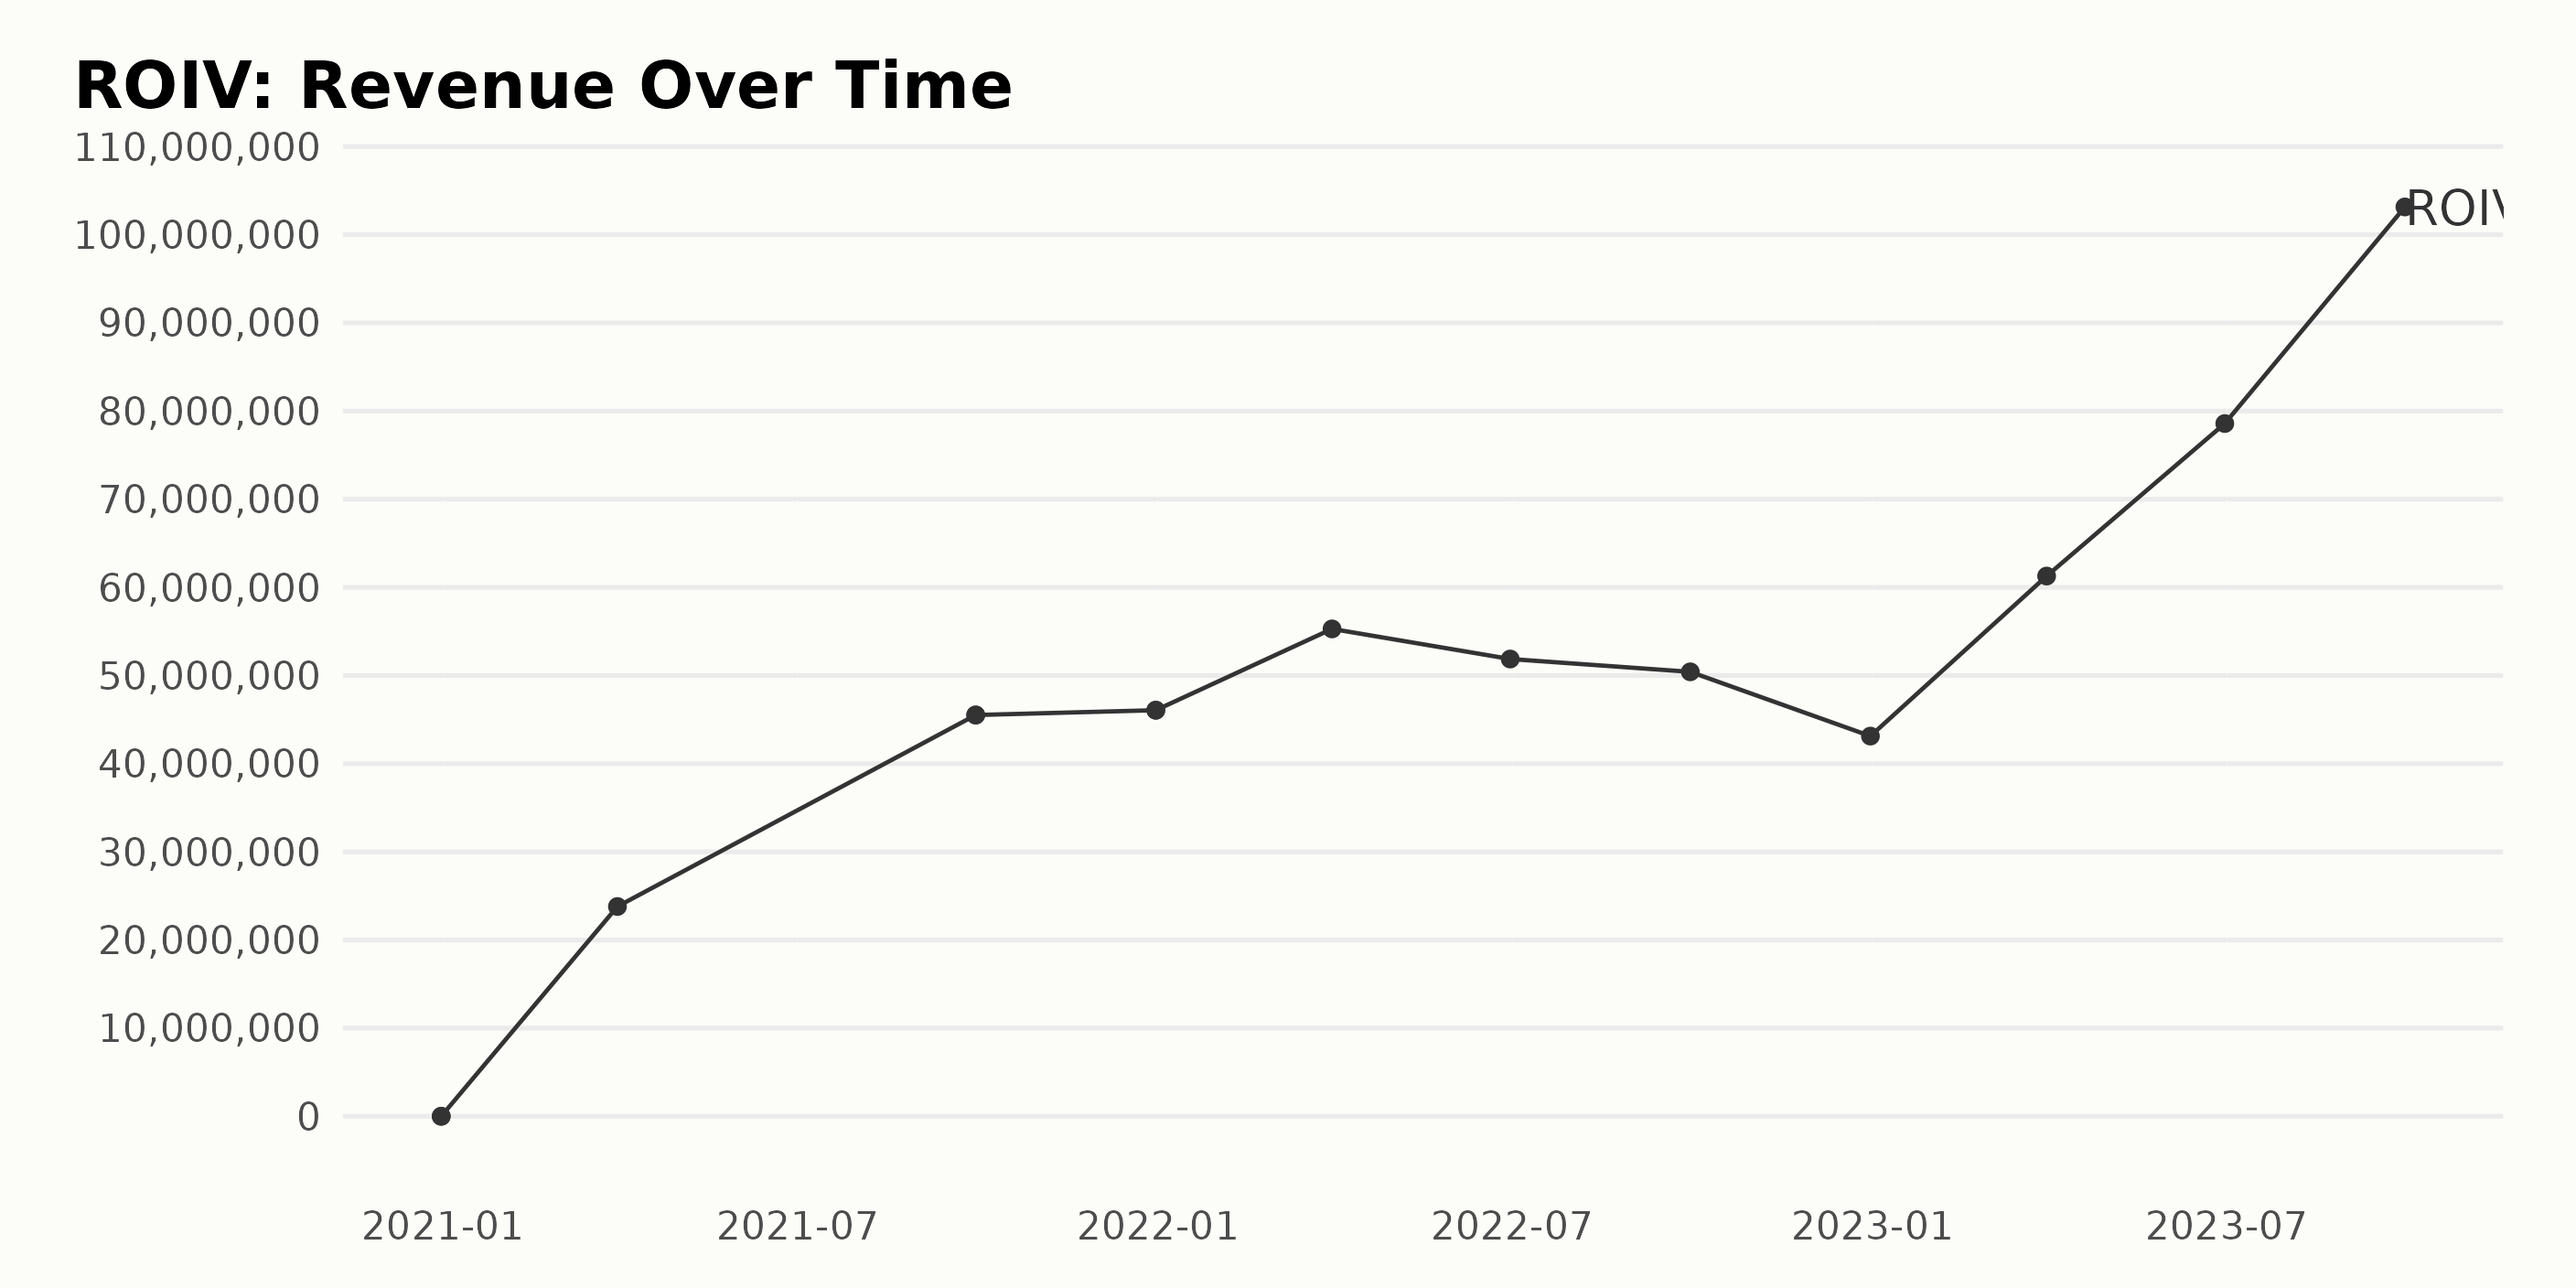
Here is a summary of the trailing-12-month revenue trends and fluctuations for ROIV from December 2020 to September 2023:
- From December 2020 to March 2021, the Revenue was at $0.
- Significant growth began in the second quarter of 2021. By the end of March 2021, the Revenue reached $23.80 million.
- Substantial increment continued through 2021, ending the year with $46.06 million in Revenue by December 2021.
- The trend varied in 2022, with an initial increase of Revenue to $55.29 million by March, followed by a slight decline to $51.87 million by June, and then further decrease to $50.42 million by September. The Revenue fell to its lowest point for the year at $43.13 million in December.
- In 2023, a rebound occurred starting with $61.28 million in March, and a significant incline to $78.59 million in Revenue by June.
- The most substantial increase noted during the period was in September 2023, with the Revenue reaching a peak of $103.15 million.
Overall, ROIV’s Revenue has seen a remarkable net growth between December 2020 and September 2023, despite some fluctuations in 2022. This highlights a progressively upward trajectory, particularly noticeable in the year 2023.
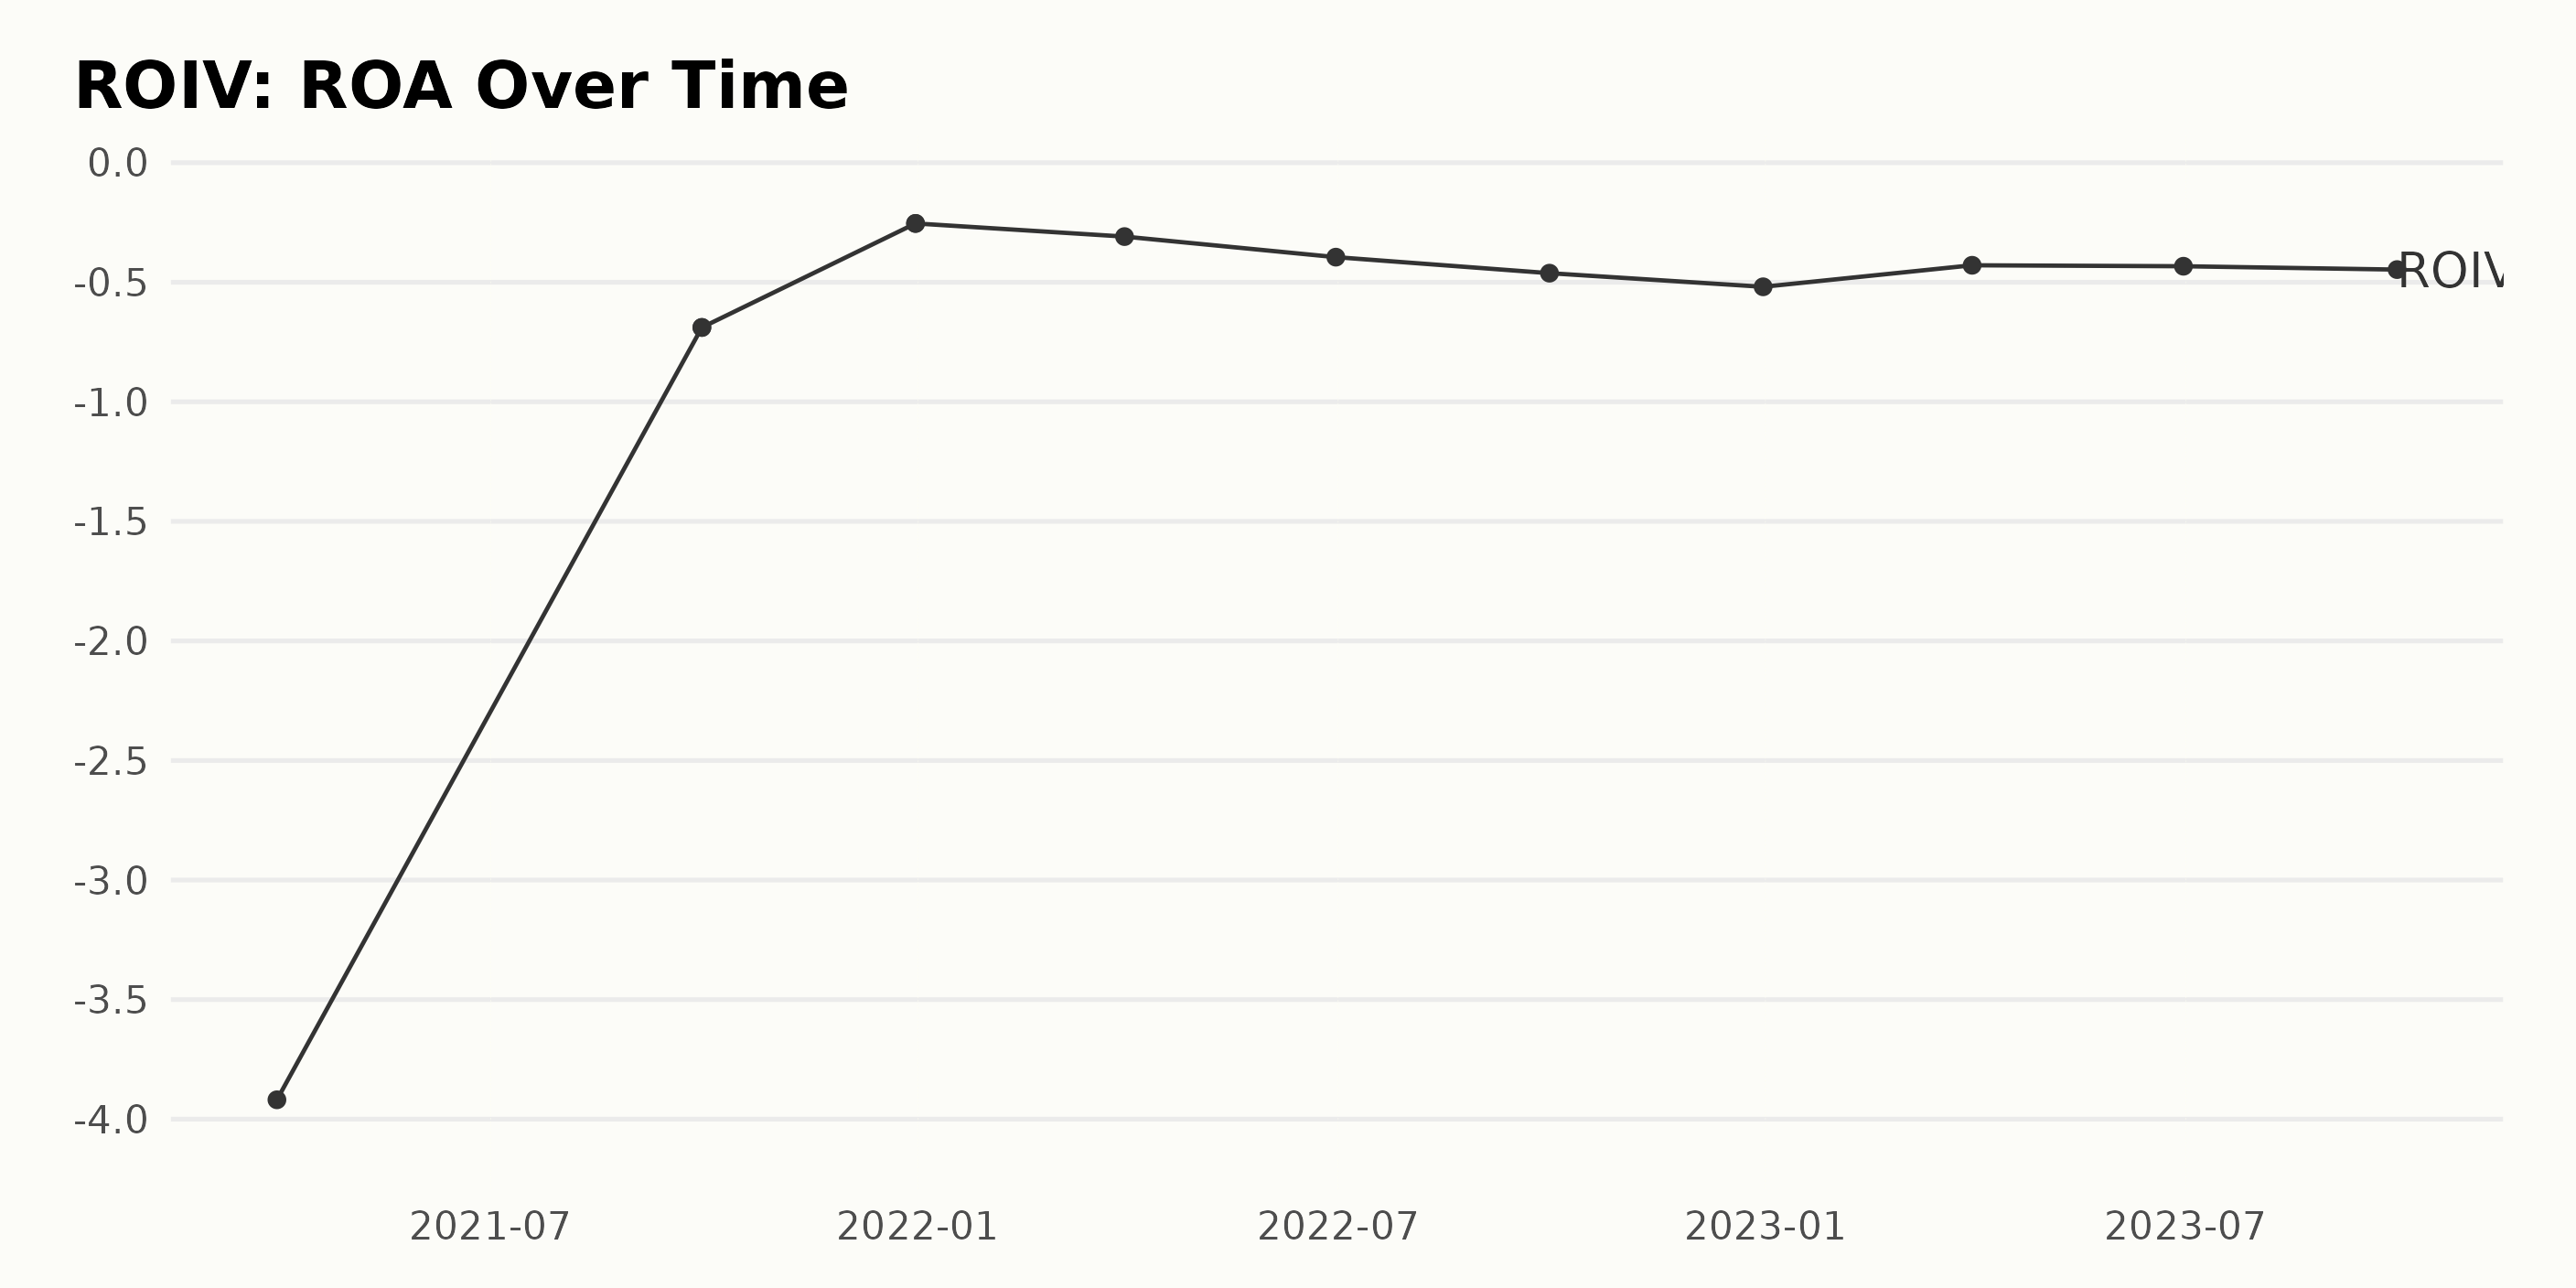
- In March 2021, ROIV reported a substantially low ROA of -3.92.
- Towards the end of the same year, on December 31, 2021, there was a significant improvement in ROIV’s ROA as it increased to -0.254.
- However, beginning from the year 2022, the company’s ROA gradually declined through each quarter. By the end of 2022, on December 31, it had fallen to -0.519.
- In 2023, there was a minor improvement in ROA at -0.429 in the first quarter of the year; however, any gains were quickly lost as ROIV’s ROA continued on a downward trajectory for the remainder of the year, achieving -0.447 by the end of September 2023.
Overall, the company’s ROA showed a negative growth rate from -3.92 in March 2021 to -0.447 by September 2023. Notwithstanding a brief improvement towards the end of 2021, ROIV has been demonstrating a consistent decrease in its ROA over the given time series. The recent data indicates a continued decline with no immediate signs of reversal.
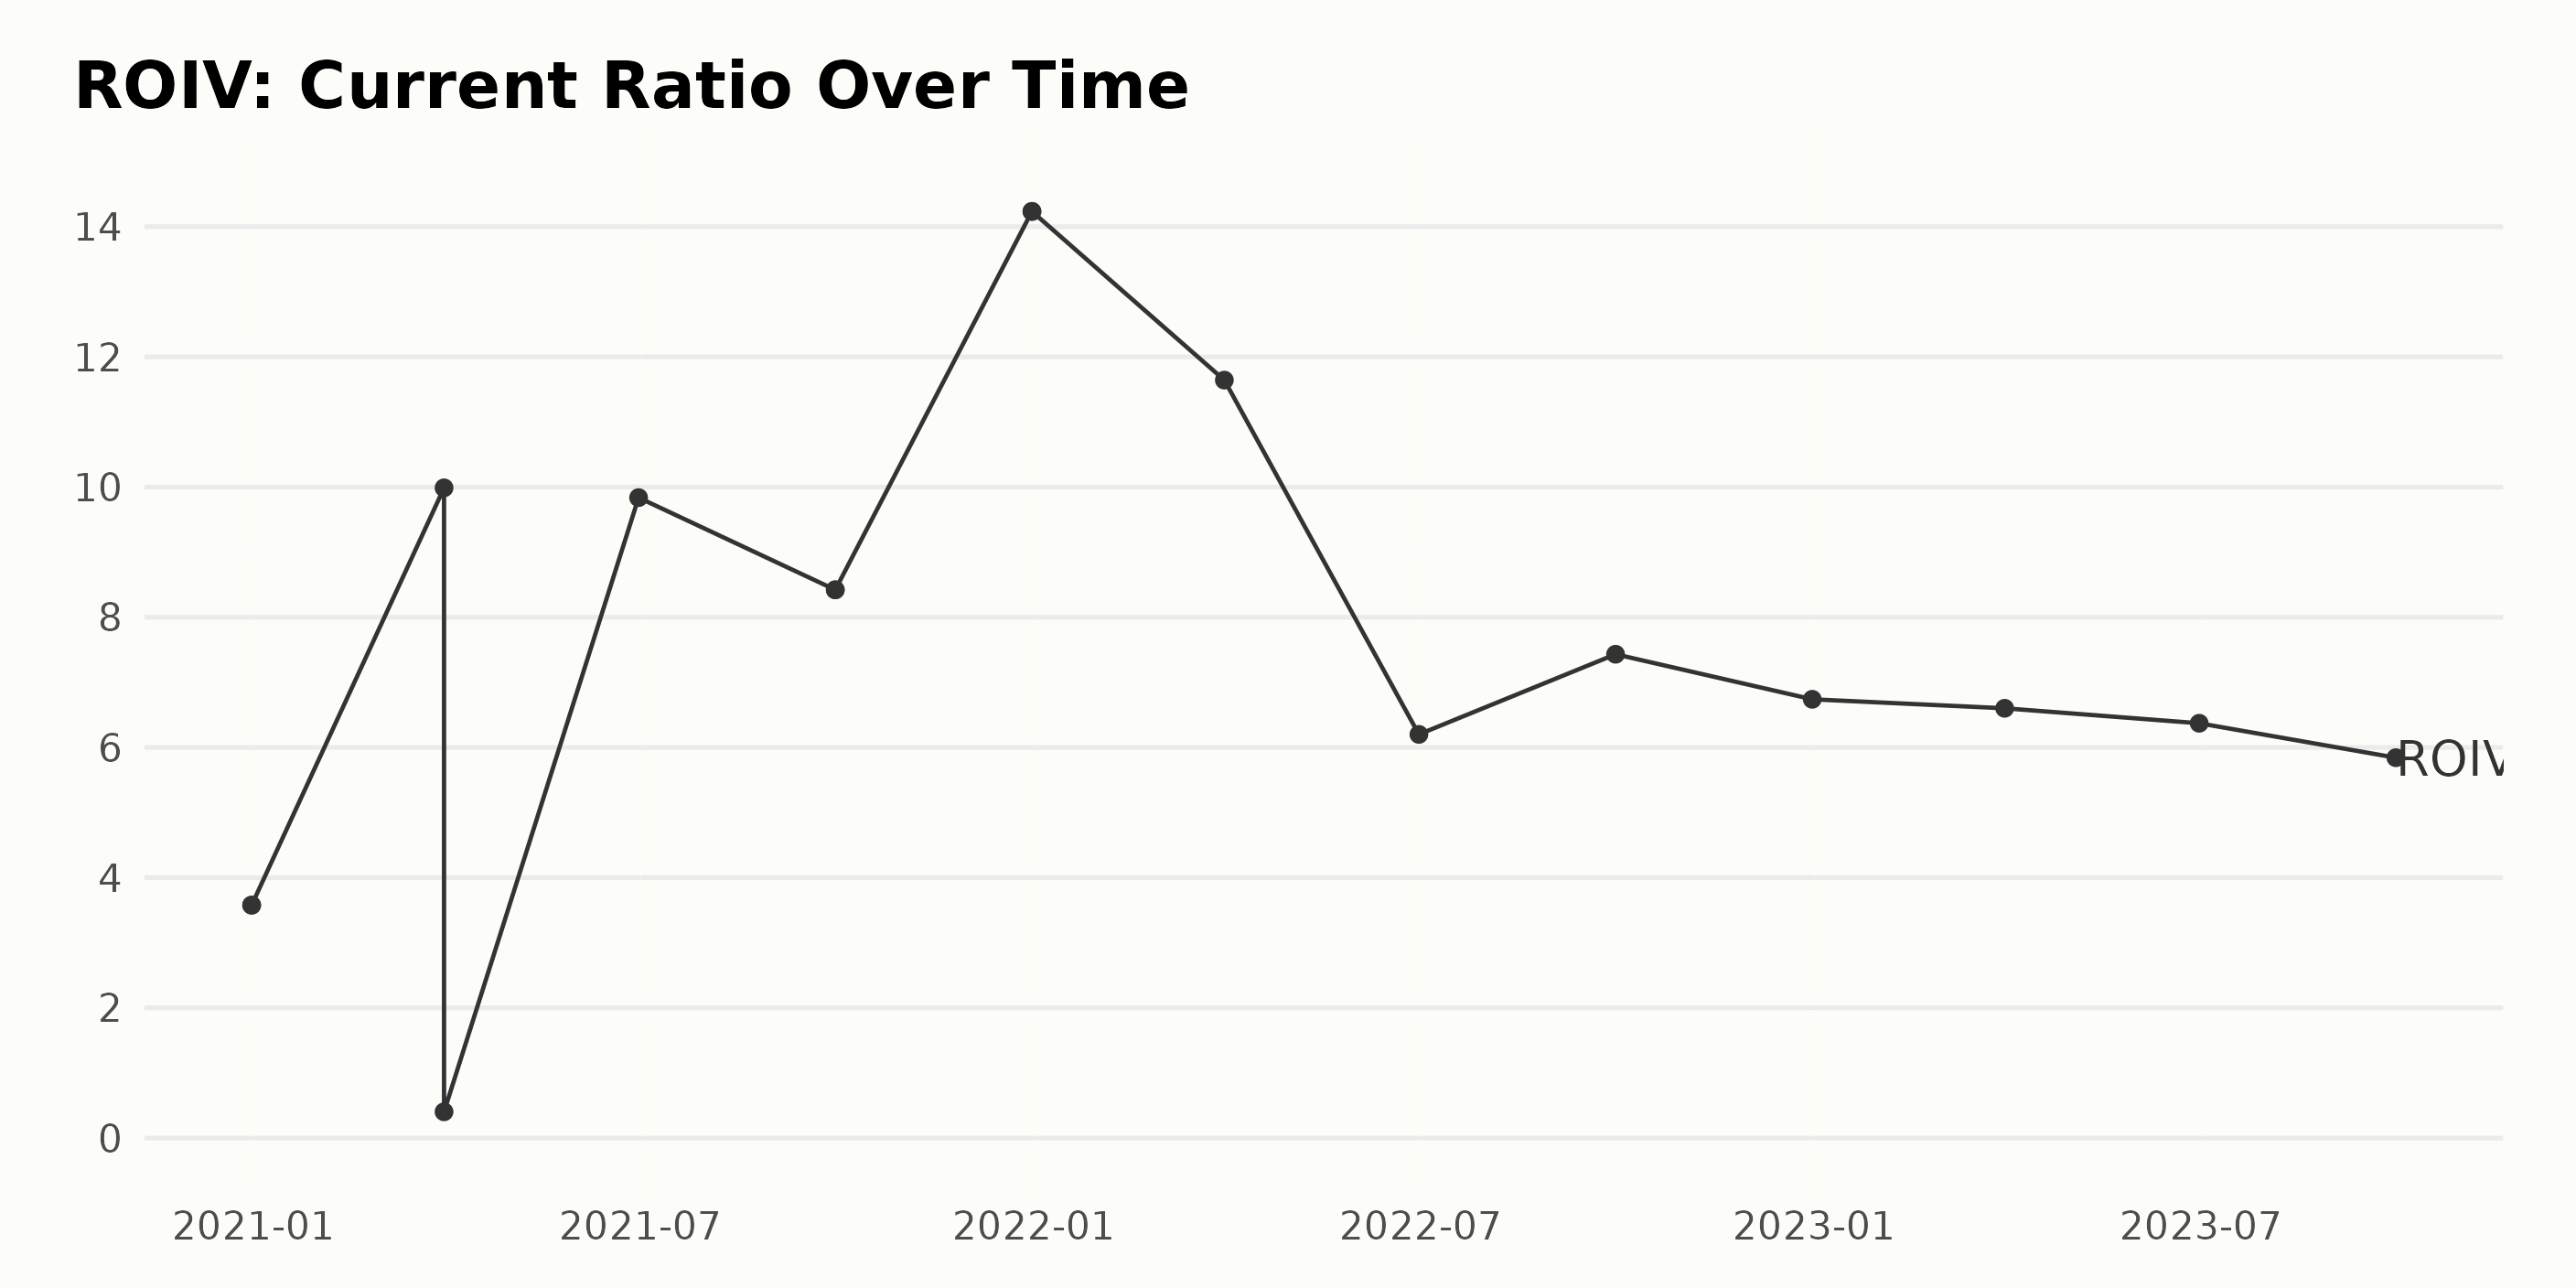
The Current Ratio of ROIV has shown both upward and downward trends from December 2020 to September 2023. Key Observations:
- The Current Ratio of ROIV started at 3.58 in December 2020, and then it dramatically increased to 9.99 in March 2021.
- However, a sharp drop is observed as the ratio decreased to 0.40 in subsequent months of 2021.
- In June 2021, the current ratio rebounded to 9.83, before experiencing a slow decline over the next two quarters and closing the year (December 2021) at 14.23, the highest value in the observed period.
- From there, the ratio declined steadily until reaching 6.74 by the end of December 2022, followed by a mild fluctuation that resulted in a consistent downturn in 2023 with a brief uptick seen in September 2022 (7.43).
- By the end of the observation period in September 2023, the Current Ratio had decreased to 5.84, a significant decrease compared to its peak in December 2021.
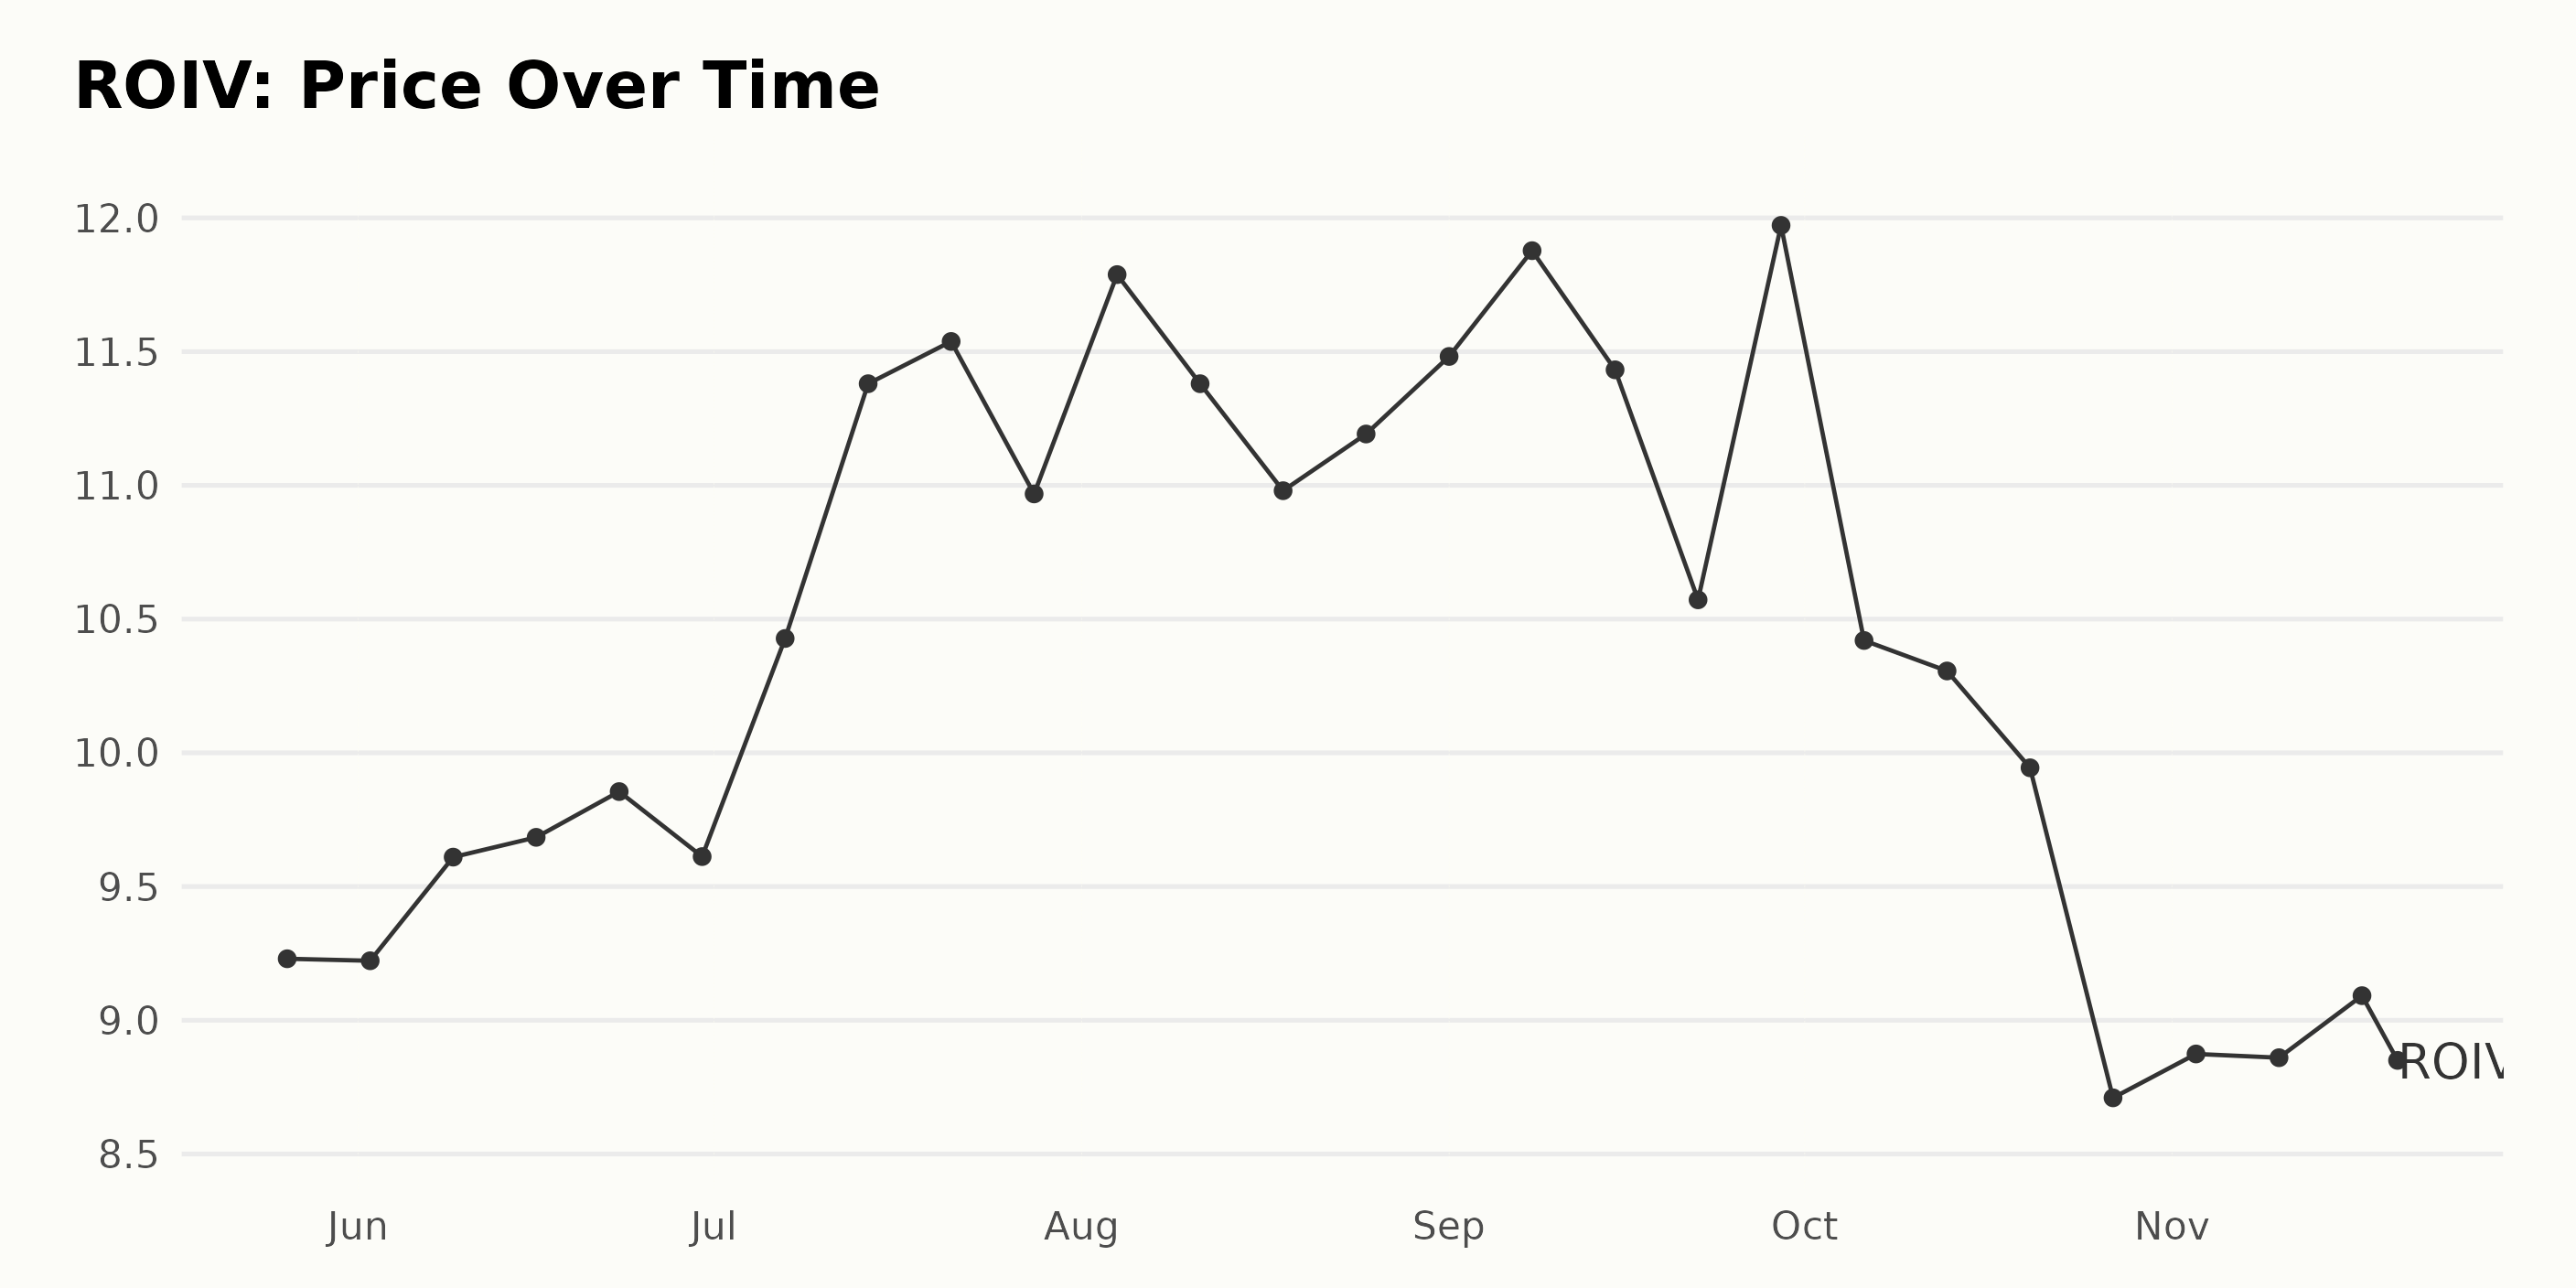
Analyzing ROIV’s Share Price Fluctuation: A 180-Day Journey from May to November 2023
The data provided shows the share price of ROIV from May 26, 2023 until November 20, 2023. Here is an overview: –
- On May 26, 2023, ROIV shares were priced at $9.23.
- In June 2023, they saw a gradual increase from $9.22 to $9.86.
- On July 07, 2023, they saw a significant jump to $10.43. This upward trend continued until July 21, 2023, when the share value reached $11.54, indicating a strong growth rate during July.
- However, towards the end of July 2023, the price fell slightly to $10.97, and the fluctuation continued into August 2023: the share price rose to $11.79 early in August 2023 but dipped back to $10.98 by August 18, 2023.
- Starting September, the prices showed a volatile trend and peaked at $11.97 on September 29, 2023.
- Starting October 2023, there was a notable downward trend. Beginning at a price of $10.42, the shares lost value each week, ending at $8.71 by October 27.
- November 2023 saw less fluctuation compared to previous months, with the overall trend being slight recuperation in the share price, peaking at $9.09 before falling again to close out the period on November 20, 2023, at a price of $8.85.
Overall, shares of ROIV experienced periods of both growth and decline between May and November 2023. From a macroscopic view, it seems that after a major growth spike in the summer, particularly July, the stocks faced a decelerating trend starting October 2023. Here is a chart of ROIV’s price over the past 180 days.
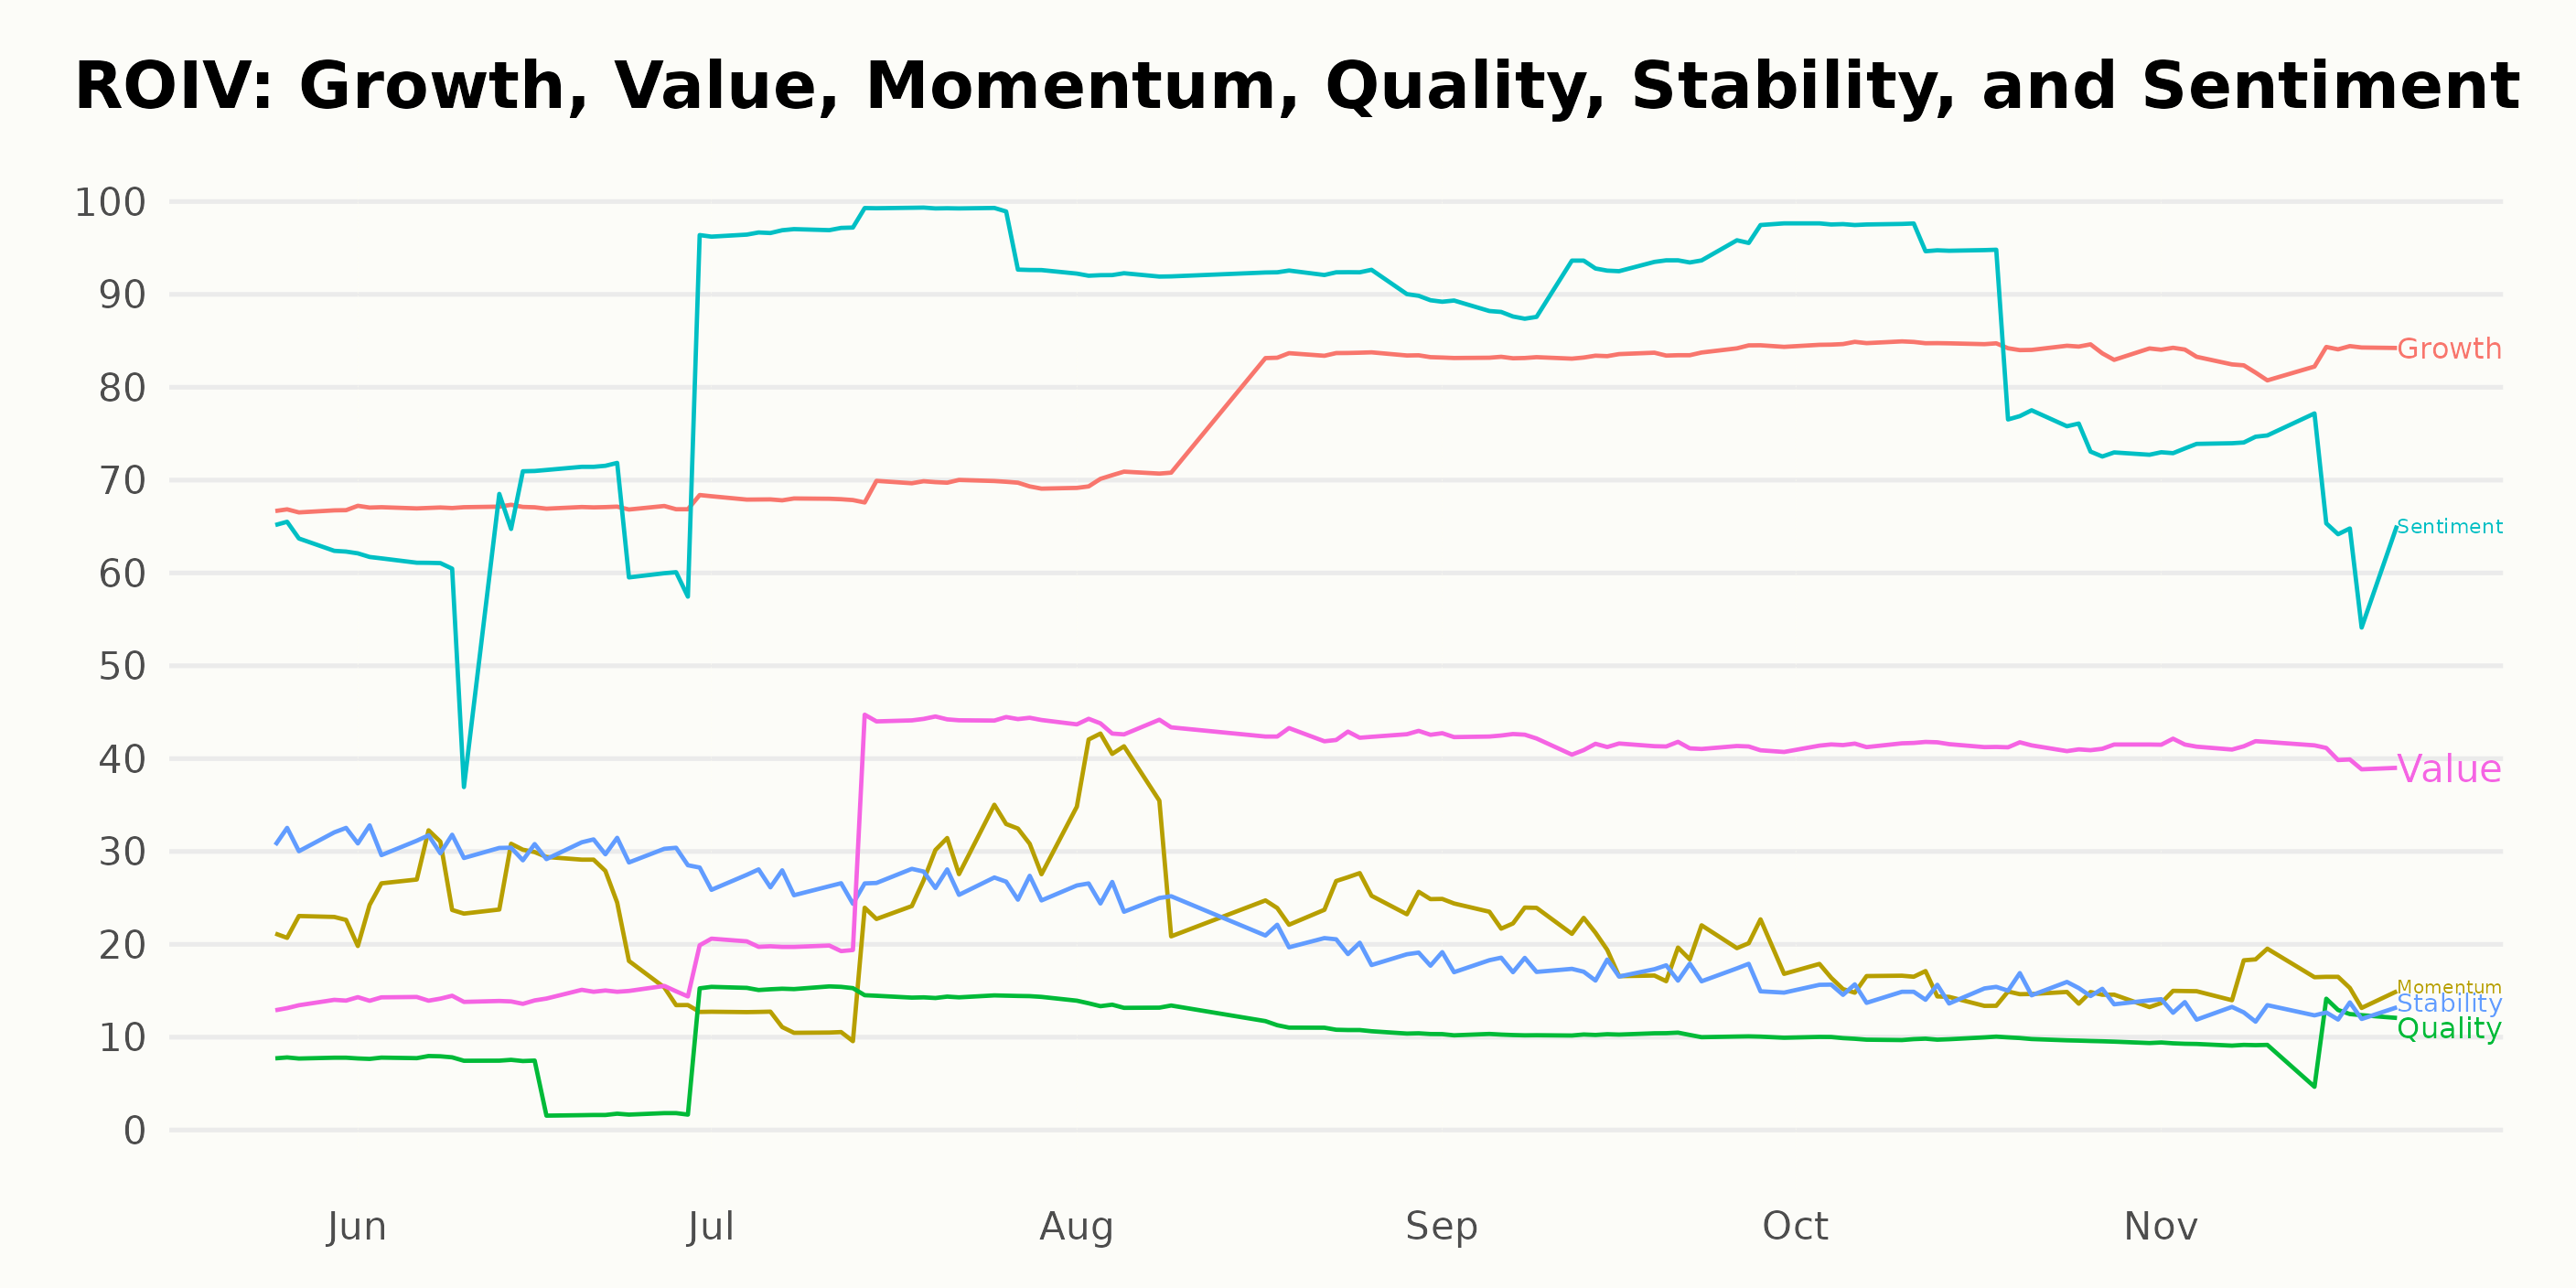
Examining Trends in ROIV’s Growth, Sentiment and Value Across 2023
ROIV has an overall D rating, translating to a Sell in our POWR Ratings system. It is ranked #177 out of the 345 stocks in the Biotech category.
Analyzing the POWR Ratings of ROIV across six dimensions, the three most noteworthy are: Growth, Sentiment, and Value.
Growth:
- In May 2023, the Growth dimension was rated at 67.
- There was a notable upward trend over the next few months, increasing to 84 by September 2023.
- Since then, the Growth rating has remained relatively stable, marginally decreasing to 83 by November 2023.
Sentiment:
- The Sentiment score showed a remarkable surge in the middle of the period, reaching a high of 97 in July 2023.
- However, this peak was followed by a downward trend, with ratings going from 92 in August and September to 70 in November 2023.
Value:
- The Value score for ROIV also observed a rising trajectory.
- Starting at just 13 points in May 2023, there was a threefold increase to 42 points in September 2023.
- It thereafter slightly dipped, sitting at 41 points throughout October and November 2023.
How does Roivant Sciences Ltd. (ROIV) Stack Up Against its Peers?
Other stocks in the Biotech sector that may be worth considering are Incyte Corporation (INCY - Get Rating), Otsuka Holdings Co Ltd (OTSKY - Get Rating), and Vertex Pharmaceuticals Incorporated (VRTX - Get Rating) — they have better POWR Ratings.
What To Do Next?
Discover 10 widely held stocks that our proprietary model shows have tremendous downside potential. Please make sure none of these “death trap” stocks are lurking in your portfolio:
Want More Great Investing Ideas?
ROIV shares were trading at $8.67 per share on Tuesday afternoon, down $0.13 (-1.48%). Year-to-date, ROIV has gained 8.51%, versus a 19.74% rise in the benchmark S&P 500 index during the same period.
About the Author: Subhasree Kar

Subhasree’s keen interest in financial instruments led her to pursue a career as an investment analyst. After earning a Master’s degree in Economics, she gained knowledge of equity research and portfolio management at Finlatics. More...
More Resources for the Stocks in this Article
| Ticker | POWR Rating | Industry Rank | Rank in Industry |
| ROIV | Get Rating | Get Rating | Get Rating |
| INCY | Get Rating | Get Rating | Get Rating |
| OTSKY | Get Rating | Get Rating | Get Rating |
| VRTX | Get Rating | Get Rating | Get Rating |


