
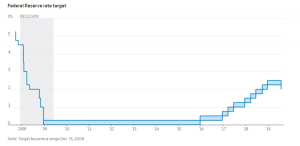
This was expected to be a crucial week for the markets as the highly anticipated Fed meeting was supposed to provide clarity on monetary policy. On Wednesday, Jerome Powell did give a 25 basis rate cut, the first over 10 years since the financial crisis.
The market initially sold off as some had hoped for a 50-basis point cut and the promise of more, from which Powell demurred — by mid-morning Thursday stocks were hitting new all-time highs.
Then Trump jolted the markets by tweeting without warning that he planned on increasing tariffs on China and escalating the trade war.
The Dow Jones Average went from up 300 points to down 300 in a matter of minutes. Stocks dependent on imports such as retail, especially apparel like Nike (NKE) & Ralph Lauren (RL) and technology stocks, like chip makers Micron (MU), were especially hard hit, losing 5%-10% on the day.
The repercussions were also felt in the bond and currency markets across the globe. The yield on bonds tumbled to lows as investors sought a safe haven in what is now expected to be a prolonged trade war and slowing economies. Yield on the U.S 10 Year Note sank to 1.85% today.
What’s amazing is that its far higher than the rest of the developed world.
Germany’s 29-year bond traded with a yield of minus 0.004% Friday as investors ditched risky assets including stocks and piled into havens like government bonds and currencies such as the Japanese yen and Swiss franc
In Germany now, every single maturity after yields on the country’s longest-term bond dipped into negative territory for the first time.
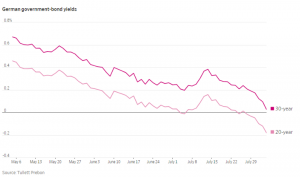
Worldwide, there is now over $14 trillion, with a ‘T’, in negatively yielding debt. With investors now have the pleasure of paying governments for the privilege of holding their money, you know that something historical has taken place.
If the Fed hadn’t cut short term rates the yield curve was in danger of inverting which has often signaled a coming recession. Wednesday’s move by the Fed was also seen as peremptory in case trade tension mounts.
Trump wasted no time in doing so as he seems to think the Fed will continue to cut rates to prevent a slow down that he himself is creating through the trade wars.
Why does the inversion predict economic slowdown? The thinking goes as we enter the late stage of the economic cycle, and recent signs such as a slowdown in housing and auto sales, and the decline in oil and copper prices, and overall slowing global growth, would warrant low long-term rates as investors choose the safety of bonds over investing in expansion.
One big difference between now and past rate cuts to spur activity is that rates were already historically low; during the last inversion and cutting cycle in 2006, we saw the 10-year yielding over 6.5% compared to the current 2%, meaning even a slight inversion doesn’t create a huge change in the cost of money.
Can Trump have both his trade war and a booming economy? I guess we will find out in the coming months.
SPY shares were trading at $291.72 per share on Friday afternoon, down $3.12 (-1.06%). Year-to-date, SPY has gained 17.81%, versus a % rise in the benchmark S&P 500 index during the same period.
This article is brought to you courtesy of Stock News.
About the Author: Option Sensei

Steve has more than 30 years of investment experience with an expertise in options trading. He’s written for TheStreet.com, Minyanville and currently for Option Sensei. Learn more about Steve’s background, along with links to his most recent articles. More...
More Resources for the Stocks in this Article
| Ticker | POWR Rating | Industry Rank | Rank in Industry |
| SPY | Get Rating | Get Rating | Get Rating |


