
Happy Monday, my smart and savvy friends.
Another summer has come and gone.
It’s been a challenging year. Lockdowns… fake news… civic unrest…
And a market that thinks it’s a pogo stick — up and down… up and down…
Right now, it’s at the ‘down’ part of that cycle.
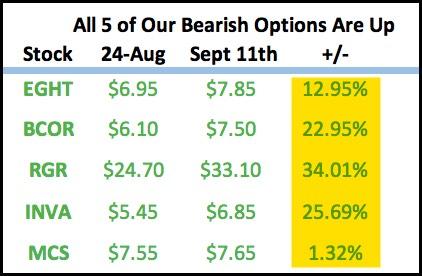
Lucky for us, we recently took a bevy of bearish positions in small-cap stocks. All had been underperforming the market as well as their sector peers.
As of this writing, all five are in the black. (Our Put options have gained in value as the underlying stocks lost value with the market selloff.)
Last week, the market continued the weakness that began with the September 3 selloff.
All major indices lost ground. Here they are, ranked from best to worst:
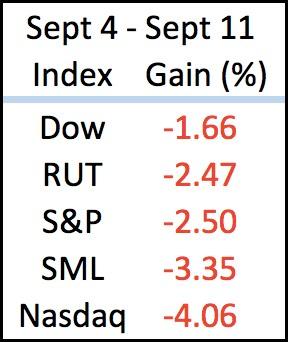
Technology took it on the chin. The Nasdaq Composite lost more than 4%.
On Thursday, my friend and colleague Costas Bocelli wrote about “the Nas”.
He pointed out that it had plunged -10% between September 3 and September 8.
That decline came just as the tech-heavy average had broken yet another all-time high.
And it marked the quickest correction (loss of 10% or greater) from an all-time high in the history of the Nasdaq.
Looking at the “internal market”, we’re seeing short-term weakness all around.
The Nasdaq’s Bullish Percent Index (BPI) chart has flipped into a column of Os.
That means the indicator is considered weak in the short term.

What’s more, the chart also just went on a “Sell signal” (the red arrow). That means the indicator is considered weak in the longer term.
The Bullish Percent Index charts for the S&P 500 Index, the Russel 2000 (RUT) and the S&P 600 (SML) are all in O-columns right now.
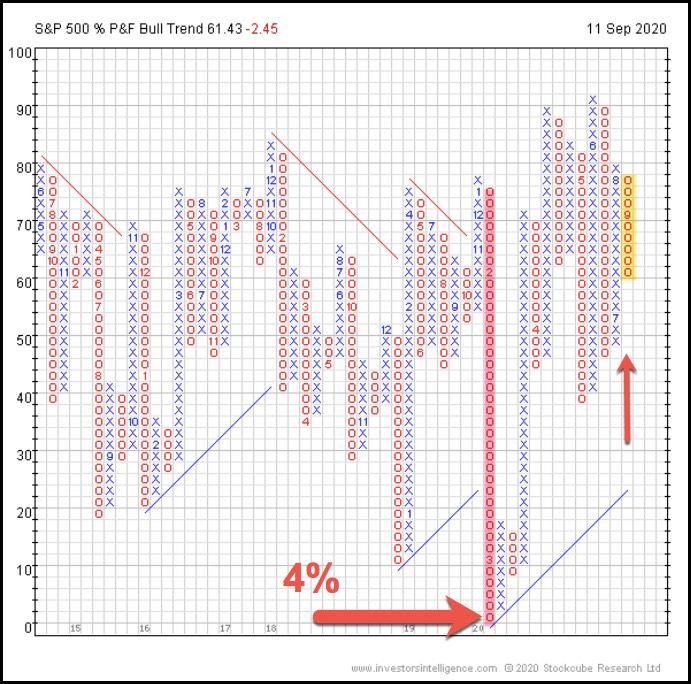
Here’s the S&P…
Like the Nasdaq, the S&P was recently far into “overbought” territory (the region of the chart up above the 70 level). A pullback was inevitable.
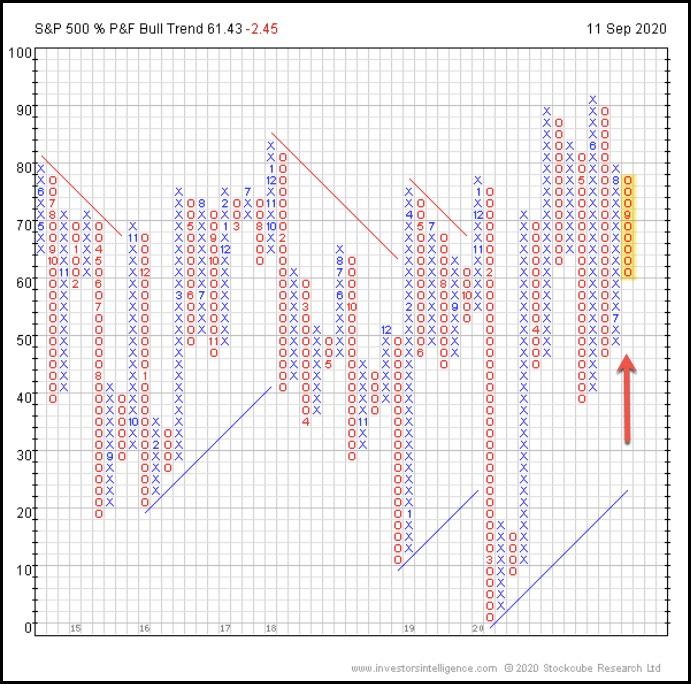
The chart is still on a “Buy signal”. That means the S&P is considered strong in the longer term. If the current O-column gets as low as the box marked by that red arrow, then the S&P will go on a Sell signal.
The RUT shows a similar set up. The chart is in Os (weak over the short term) but still on a Buy signal (strong over the longer-term).
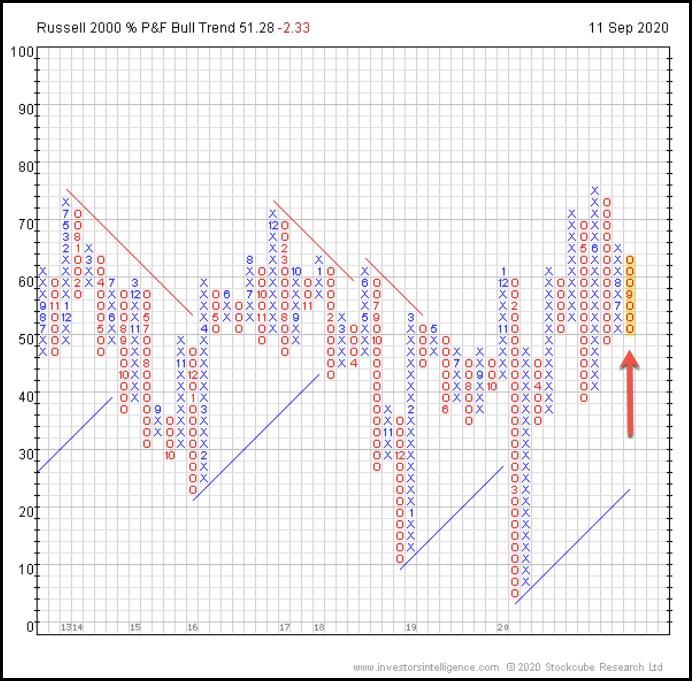
If the chart fills in just two more boxes (the red arrow) it will go on a Sell signal.
Same with the SML…
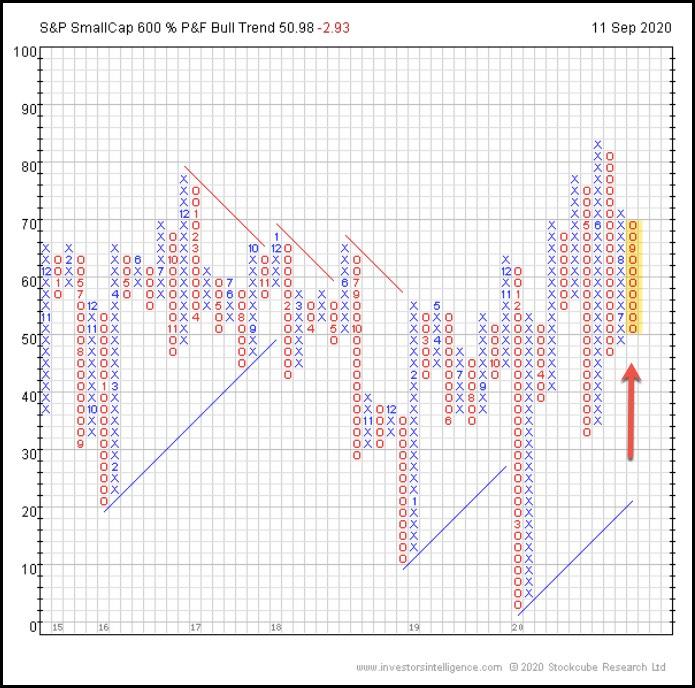
The only major BPI that’s still showing strength over the short term — still in a column of Xs — is the New York Stock Exchange BPI:
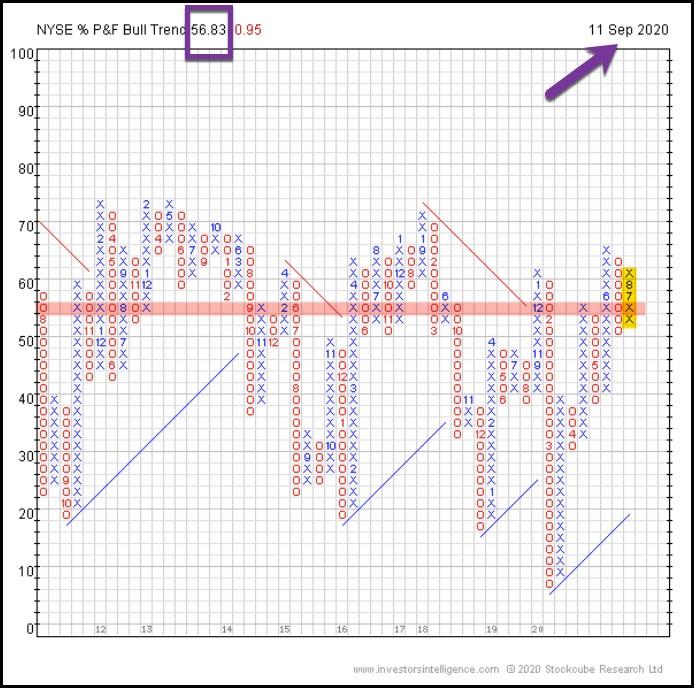
The NYSE BPI shows us the percentage of stocks trading on the NYSE that are currently on point-and-figure Buy signals on their respective price charts. The purple rectangle at the top right tells us that 56.83% of NYSE stocks meet that condition.
Follow the red highlighted bar from the far right-hand side of the chart across to the left-hand side.
It begins at an empty box immediately to the right of the current (highlighted) column.
You can see that it ends at the ’56 box’ — or “56%”.
If this chart falls to 56%, that box (and the two above it) will fill with Os and the NYSE BPI will have “flipped”. Supply will be in control.
We’re not there yet — but we’re close. Will we get there? The odds say “yes”. But “Mister Market” says: “That’s for me to know and you to find out.”
(For a lot more on the NYSE BPI, you should visit our BPI Portal. We update the page whenever the chart makes an important move.)
What’s not in doubt is that Supply has taken control of most market sectors.
Below are some snapshots of the market broken down into 45 sectors. (Image courtesy of our Premium data service, Sector Prophets Pro.)
The blue boxes show sectors whose BPI charts are in X-columns (meaning that Demand is in control of that sector)…
And the red boxes show sectors whose BPI charts are in O-columns (meaning that Supply is in control).
Just two weeks ago, on August 28, Demand (the bulls) controlled 30 sectors — 67%, or two-thirds of the market.
The bears controlled just 15.

Here’s a snapshot of the market as of Friday’s close:
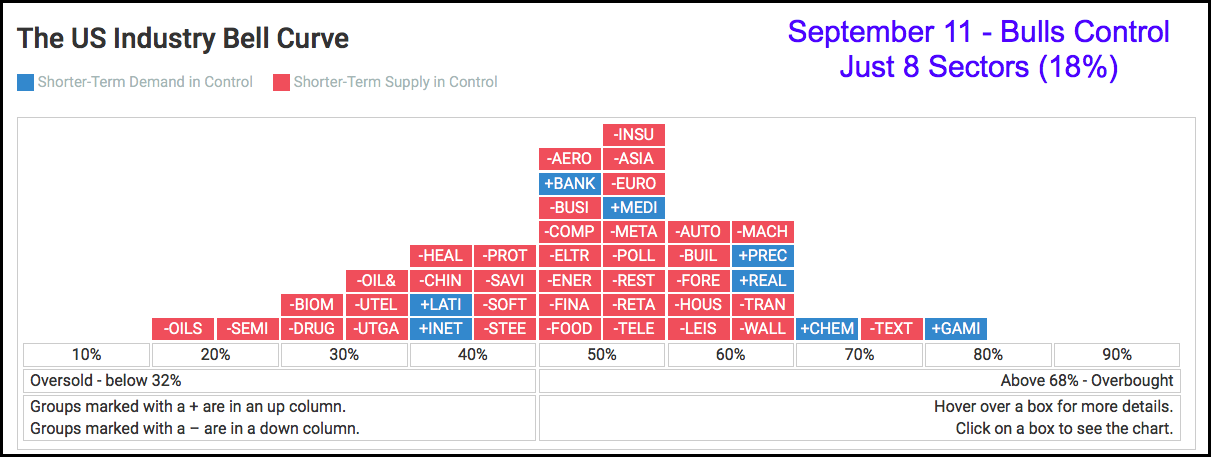
In two weeks’ time, we saw the bears rear up and seize 22 more sectors. They now control 72% of the market.
As always, we’re not going to try to predict what the market will do.
All we can do is see clearly where we are. The market was just wildly overbought. The S&P and Nasdaq were putting in new highs.
We expected a pullback, and we got it.
What’s more, the market had recently been historically oversold — washed out.
Here’s the BPI of the S&P again…
I’ve drawn a second red arrow showing the March 23 market bottom. As you can see, the chart got as low as 4%. Anything below 30% is considered oversold.
If the market were a blues singer, it’d be saying: “I’m so far down it looks like up to me”.
When the market is that oversold, all the scared or uncommitted investors head for the hills. They’re not all that eager to come back in right away.
A lot of that timid money is still on the sidelines. It’s available to push prices higher when the market rallies.
So, despite the recent tech-wreck/pullback… the market should still find it easier to rally higher again. Of course, that doesn’t mean it will.
For the moment, we’ll enjoy watching our bearish plays gun higher.
And we’ll keep our eyes peeled for more signs of weakness…
Or new signs of returning strength.
Then we’ll act accordingly.
Have a great week!
Want More Great Investing Ideas?
Free Report: The Right Investment At The Perfect Time
The Shocking Truth Why You Don’t Make More Money In Stocks
SPY shares were trading at $339.80 per share on Monday morning, up $5.74 (+1.72%). Year-to-date, SPY has gained 6.66%, versus a % rise in the benchmark S&P 500 index during the same period.
About the Author: Bill C. Spencer

Since 2016, Bill Spencer has served as Editor-in-Chief at True Market Insiders. He also runs two of their Premium trading services -- Founder’s Forecast which has a longer-term focus and Swing Tech Trader which plays the cutting edge of technology for fast profits. More...
More Resources for the Stocks in this Article
| Ticker | POWR Rating | Industry Rank | Rank in Industry |
| SPY | Get Rating | Get Rating | Get Rating |
| EGHT | Get Rating | Get Rating | Get Rating |
| BCOR | Get Rating | Get Rating | Get Rating |
| RGR | Get Rating | Get Rating | Get Rating |
| INVA | Get Rating | Get Rating | Get Rating |
| MCS | Get Rating | Get Rating | Get Rating |