In part 1 of these series, Why The Craziest Bubble In History Might Get Even Bigger, I explained why the current market rally is the most disconnected from economic fundamentals that the S&P 500 has ever been.
But, I also explained why JPMorgan’s Marko Kolanovic, head of macro quantitative and derivatives research for the bank, thinks that $400 billion in dumb money could be about to send stocks to record highs, even though we might currently be in a Moody’s depression.
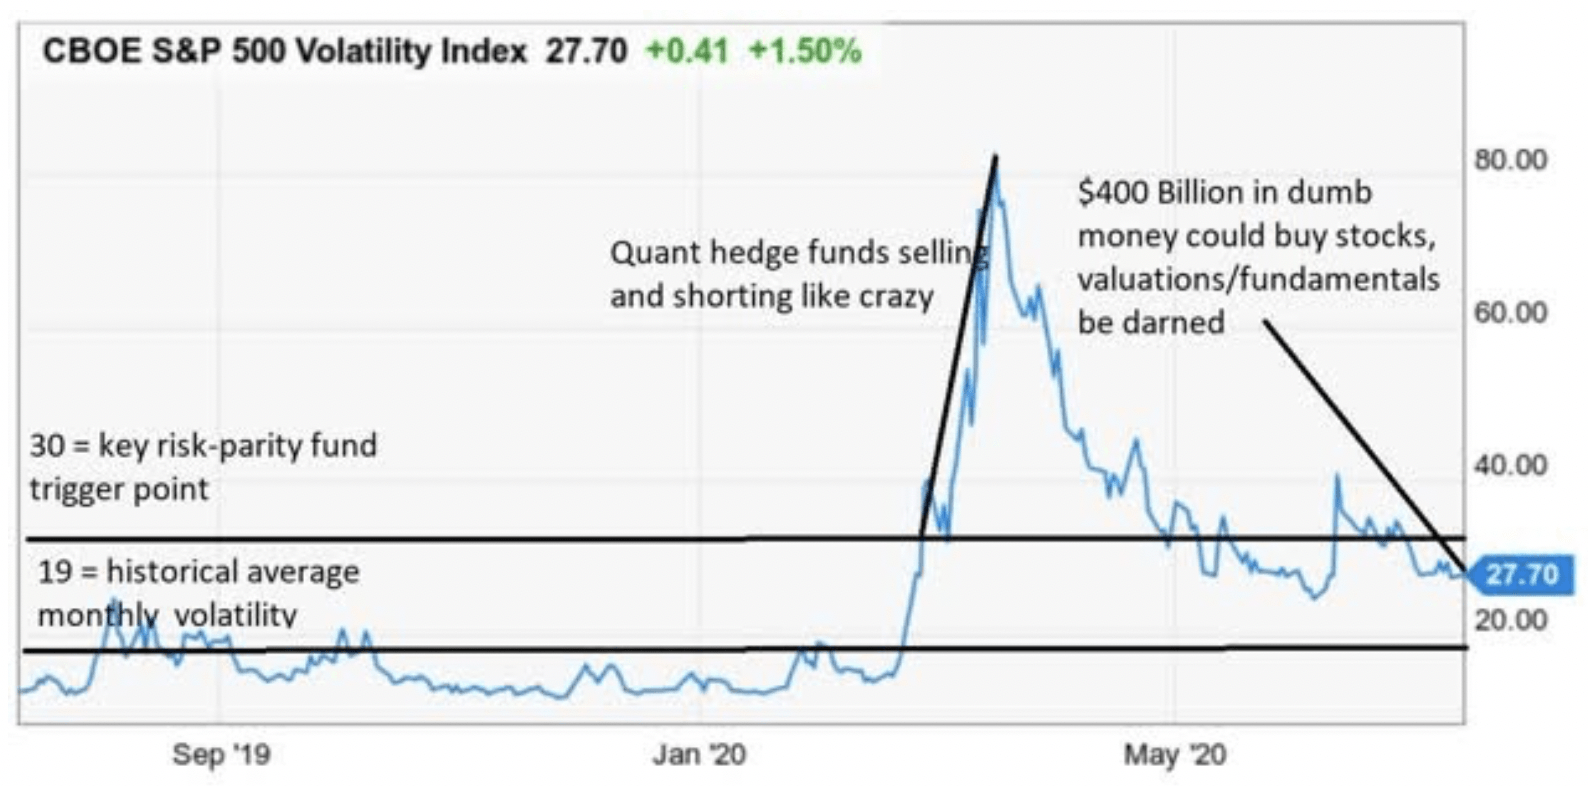
(Source: Ycharts)
The fundamental thesis that Mr. Kolanovic has is that:
- the lower volatility falls the more risk-parity quant funds have to buy stocks.
- the more stocks they buy, the lower volatility falls
- thus more and more money floods into the market, primarily S&P 500 index funds
- rising prices beget rising prices in a steadily less rational but self-fulfilling cycle of rampant and fundamentally irrational speculation
Now, I should point out that Wall Street is always full of smart people, making plausible-sounding predictions.
There is no guarantee that Mr. Koanovic is right. We’ll never actually know whether quant fund money is the primary reason stocks have been rising.
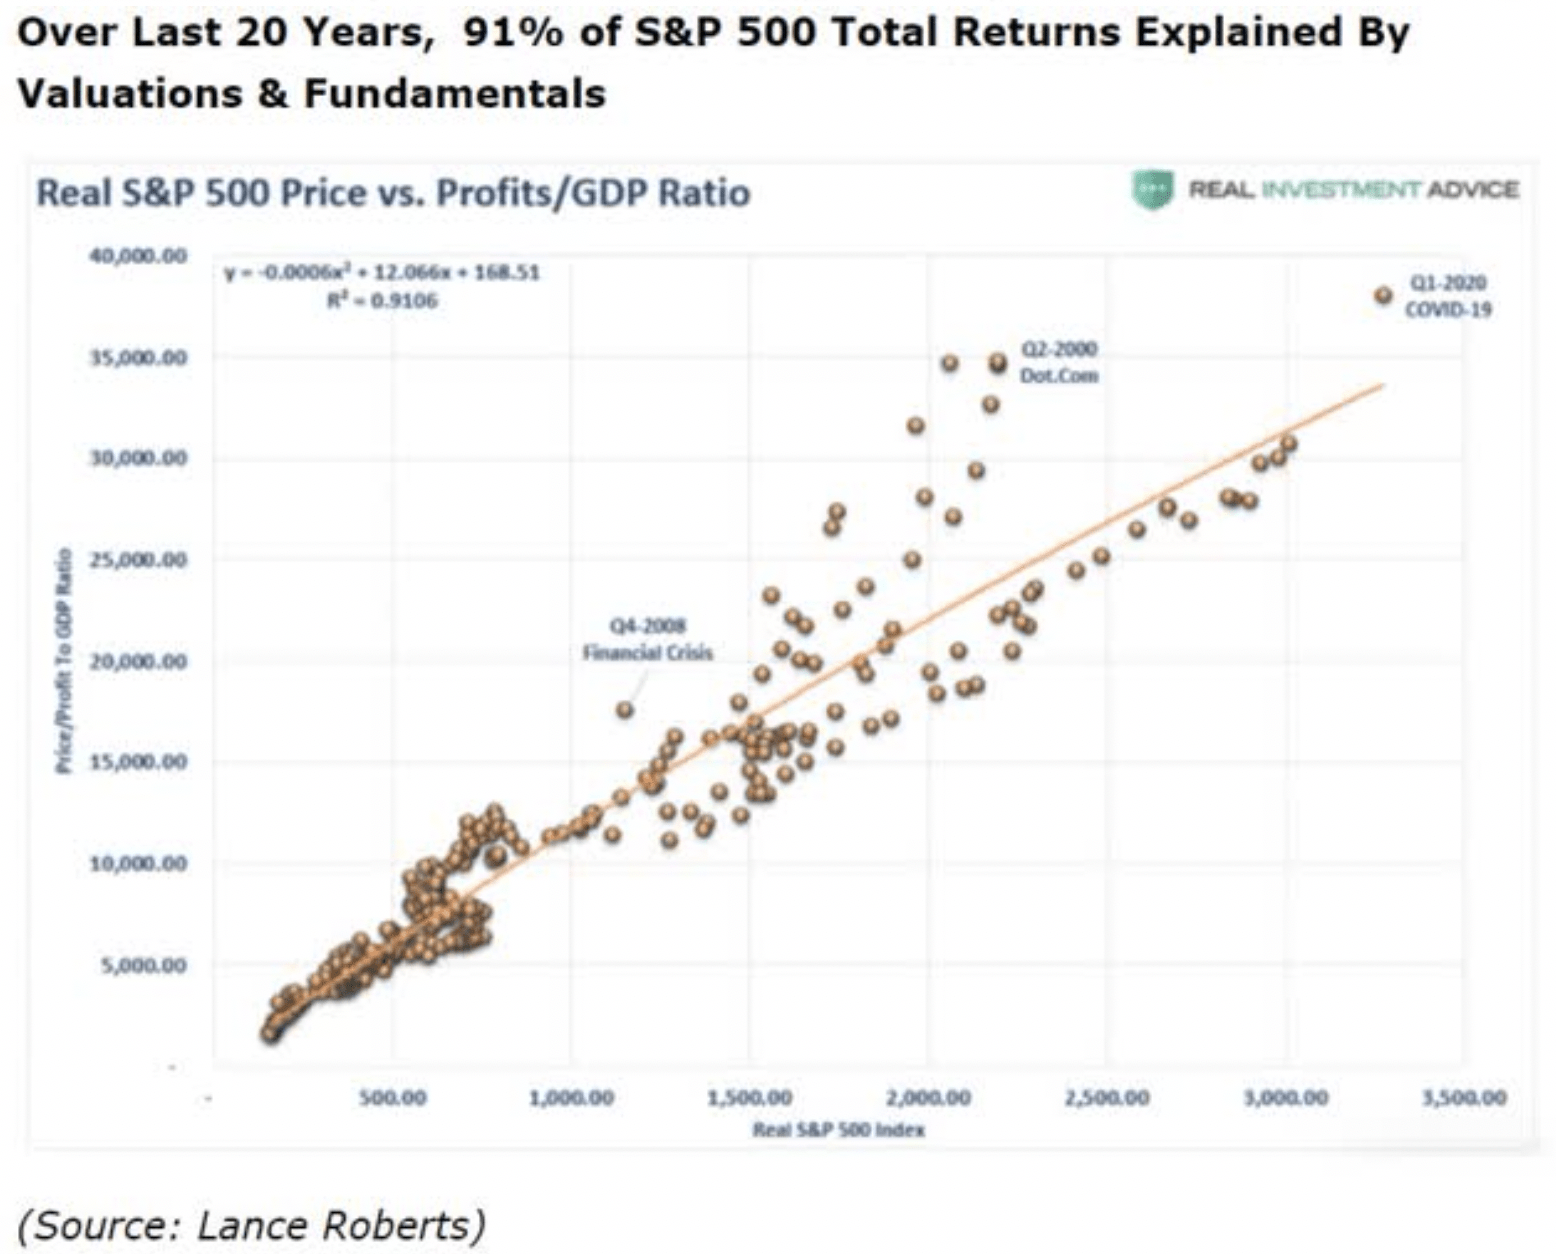
Stocks can remain irrational not just for months, but for years at a stretch. That’s how the tech bubble got so big, with stocks reaching a peak forward PE of 27.2. That was four years after Alan Greenspan warned everyone about “irrational exuberance” in stocks.
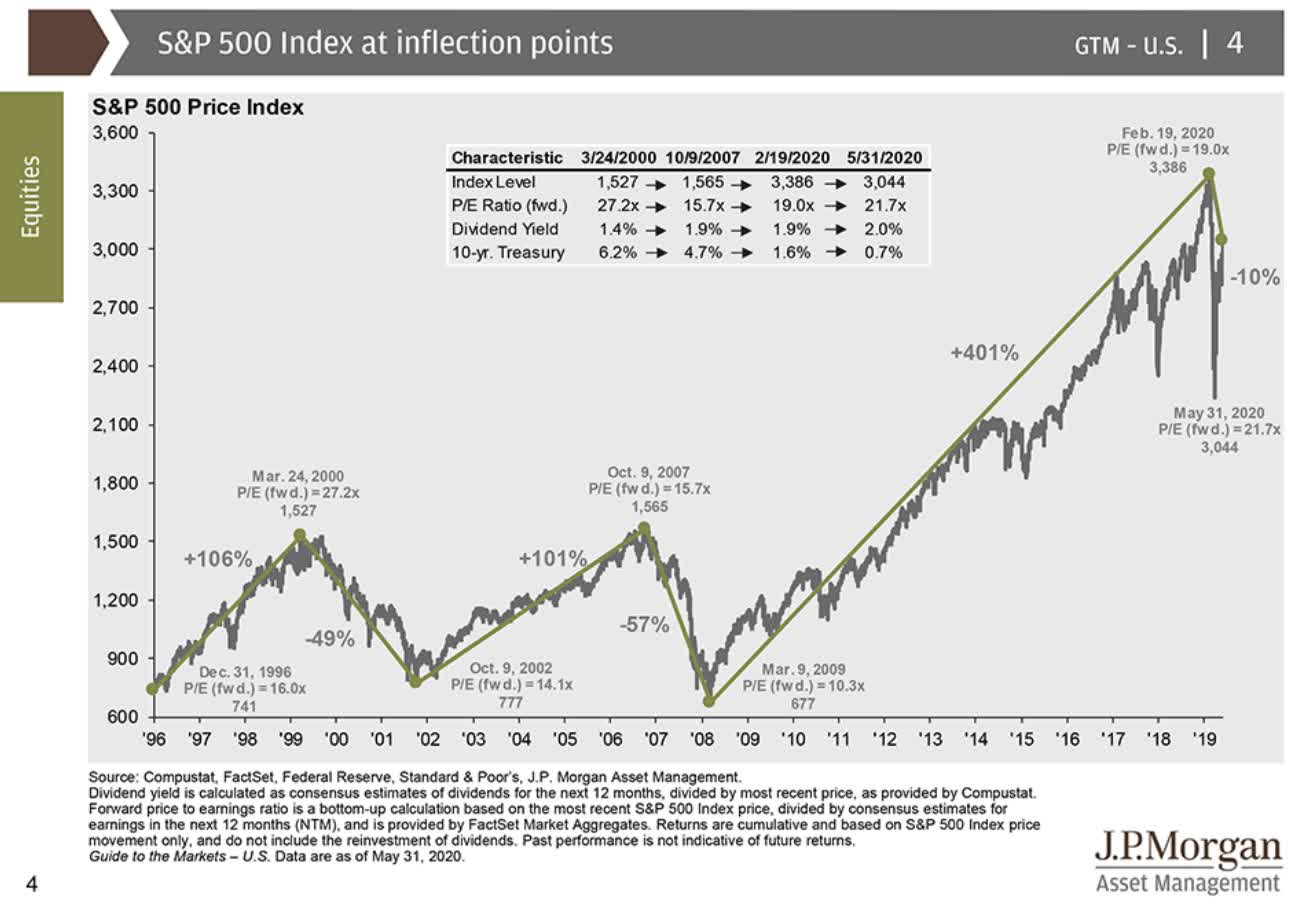
For context, the S&P 500 is currently at a 22.3 forward PE meaning it would have to rise 23% more to set a new record. But, if the $400 billion quant fund hypothesis is correct, or more importantly, if enough people believe it’s correct, then the “greater fool” theory of rampant market speculation might take over. At least for a while.
For example, in the late 1960s the so-called “nifty 50” stocks, fast-growing blue-chips like International Business Machines Corporation (IBM), Xerox (XRX), and McDonald’s (MCD), were what most fund managers were buying. They were paying 50 to 60 times earnings for companies that were growing quickly. But, not at the 50% to 60% CAGR that Peter Lynch would have said justified such outrageous valuations.
Were these men (they were all men at the time) idiots? No, in fact, some of them literally were sitting next to Warren Buffett in Ben Graham’s Columbia Business school class about securities analysis. The father of modern securities analysis and valuation, and Buffett’s mentor, taught some of these guys. Specifically, he taught them that for most companies 15 times earnings/cash flow was “reasonable and sound” valuation. Yet these fund managers, many who had lived through the crash of the Great Depression, and were willing to pay 50 to 60 times earnings for a company like IBM. Why? Because of confidence that their fellow fund managers would pay even more.
With what money? Why with the incoming fund flows that the rising market and soaring Nifty-50 were generating for ecstatic investors of course! The more money fund managers could make for clients buying companies like IBM at steadily higher valuations, the more money would come to them, to allow them to buy IBM at higher and higher prices. Then, as now, it was largely a self-fulfilling prophecy.
Everyone was happy, other than Graham purists like Buffett who were sitting out the mania and refusing to pay such multiples. The Nifty-50 crashed eventually, with some names falling 70% to 90% (just like tech bubble darlings decades later). How can retirees potentially protect themselves from a bubble that we know will end one day, but have no way of telling if it’s tomorrow or years from now?
Sound Risk-Management Strategies to Protect Yourself From the Craziest Bubble in History
The first step in prudent risk-management starts with asset allocation.
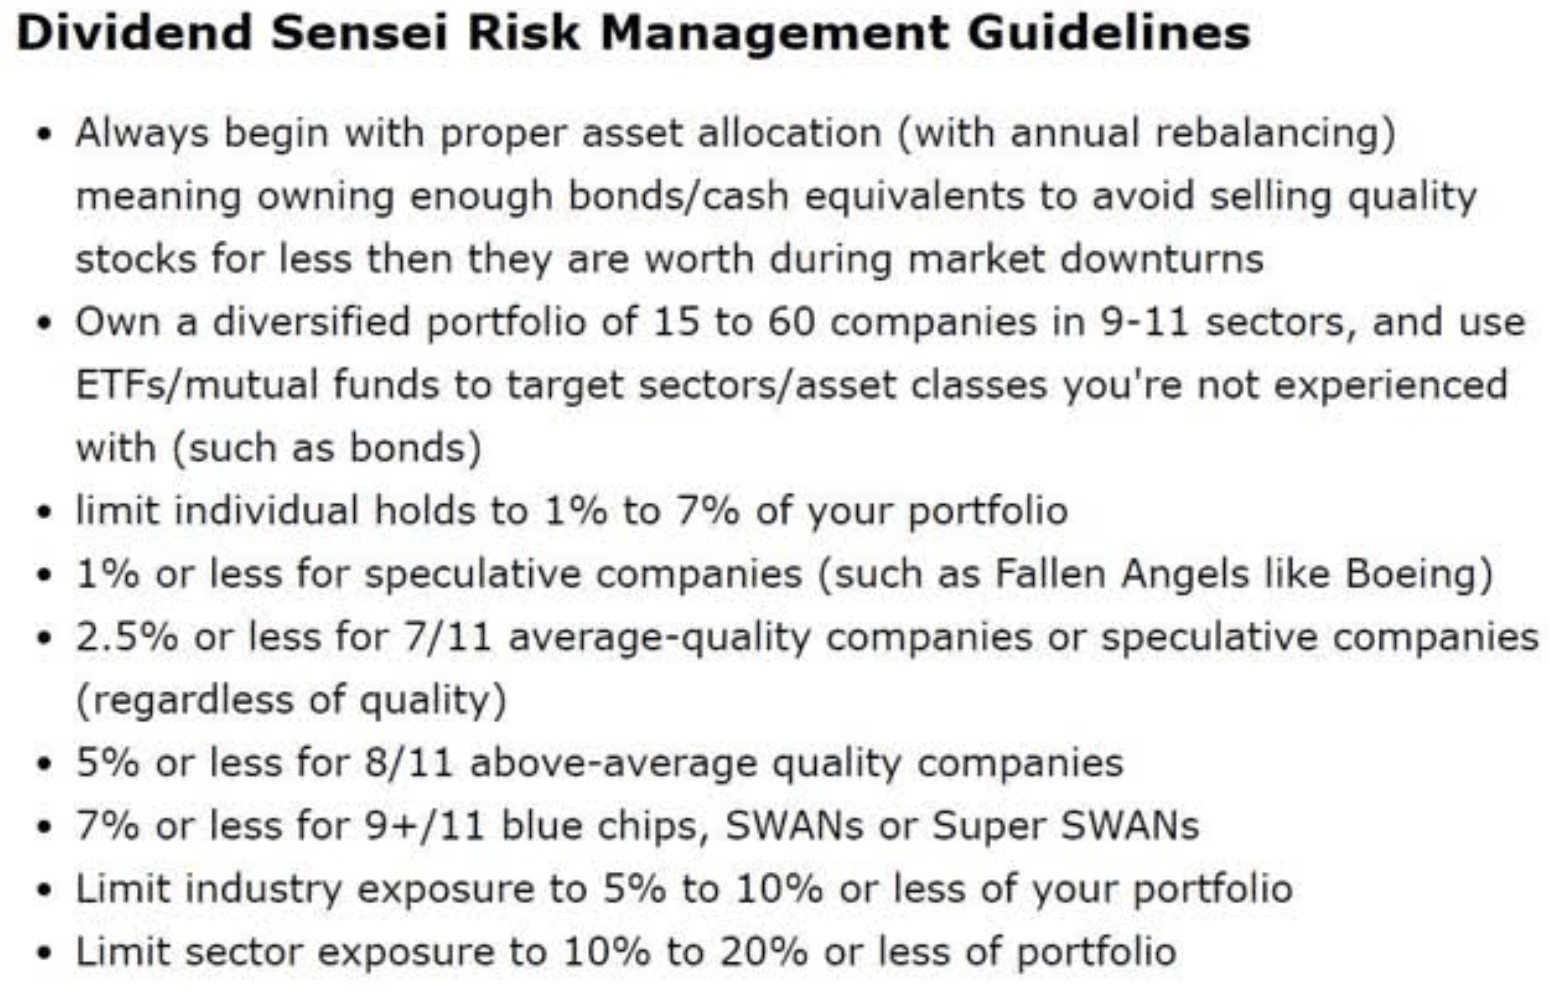
Studies show that 90% of total returns are a function of asset allocation.
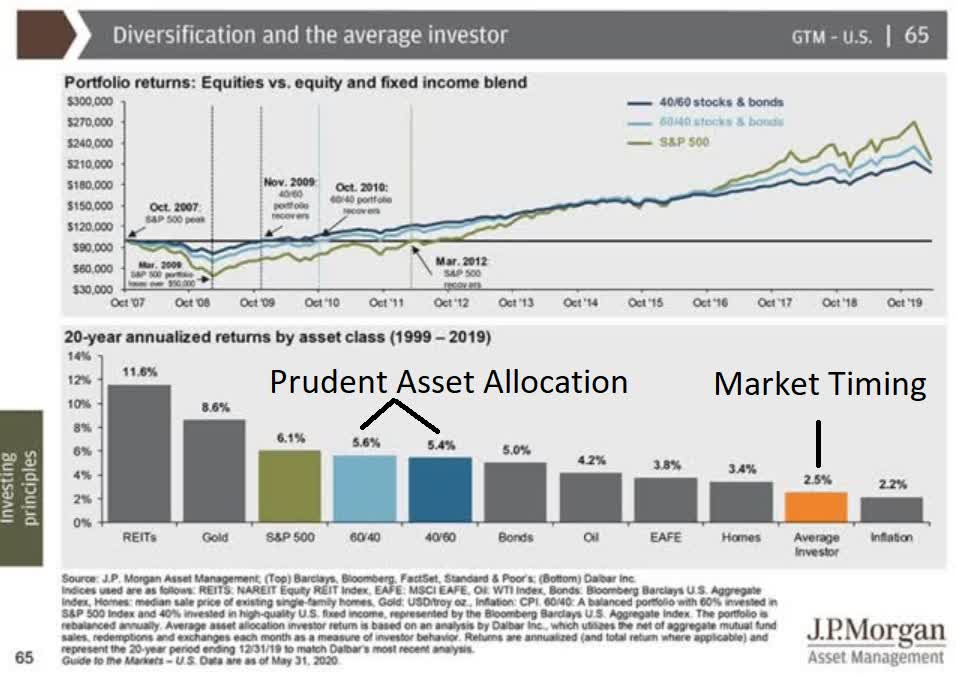
Rather than rely on market timing that not even professionals can pull off consistently asset allocation is the first line of defense against horrible retirement portfolio returns. Ultimately risk-management, including prudent diversification and sensible asset allocation, can make the difference between
- retiring in splendor
- retiring in comfort
- not retiring at all
Think about bonds in terms of protection, not yield. The stock market becomes more important when rates are on the floor but that doesn’t mean you can forsake bonds or cash altogether…
In a negative interest rate world, you have to change the way you think about bonds. Bonds have always acted as a shock absorber to stock market declines but this becomes even more important when the yield is more or less taken out of the equation.
Bonds can provide dry powder to rebalance into the stock market or pay for current expenses when the stock market inevitably goes through a nasty downturn. Bonds keep you in business even if they don’t provide high returns as they have in the past.” – Ben Carlson
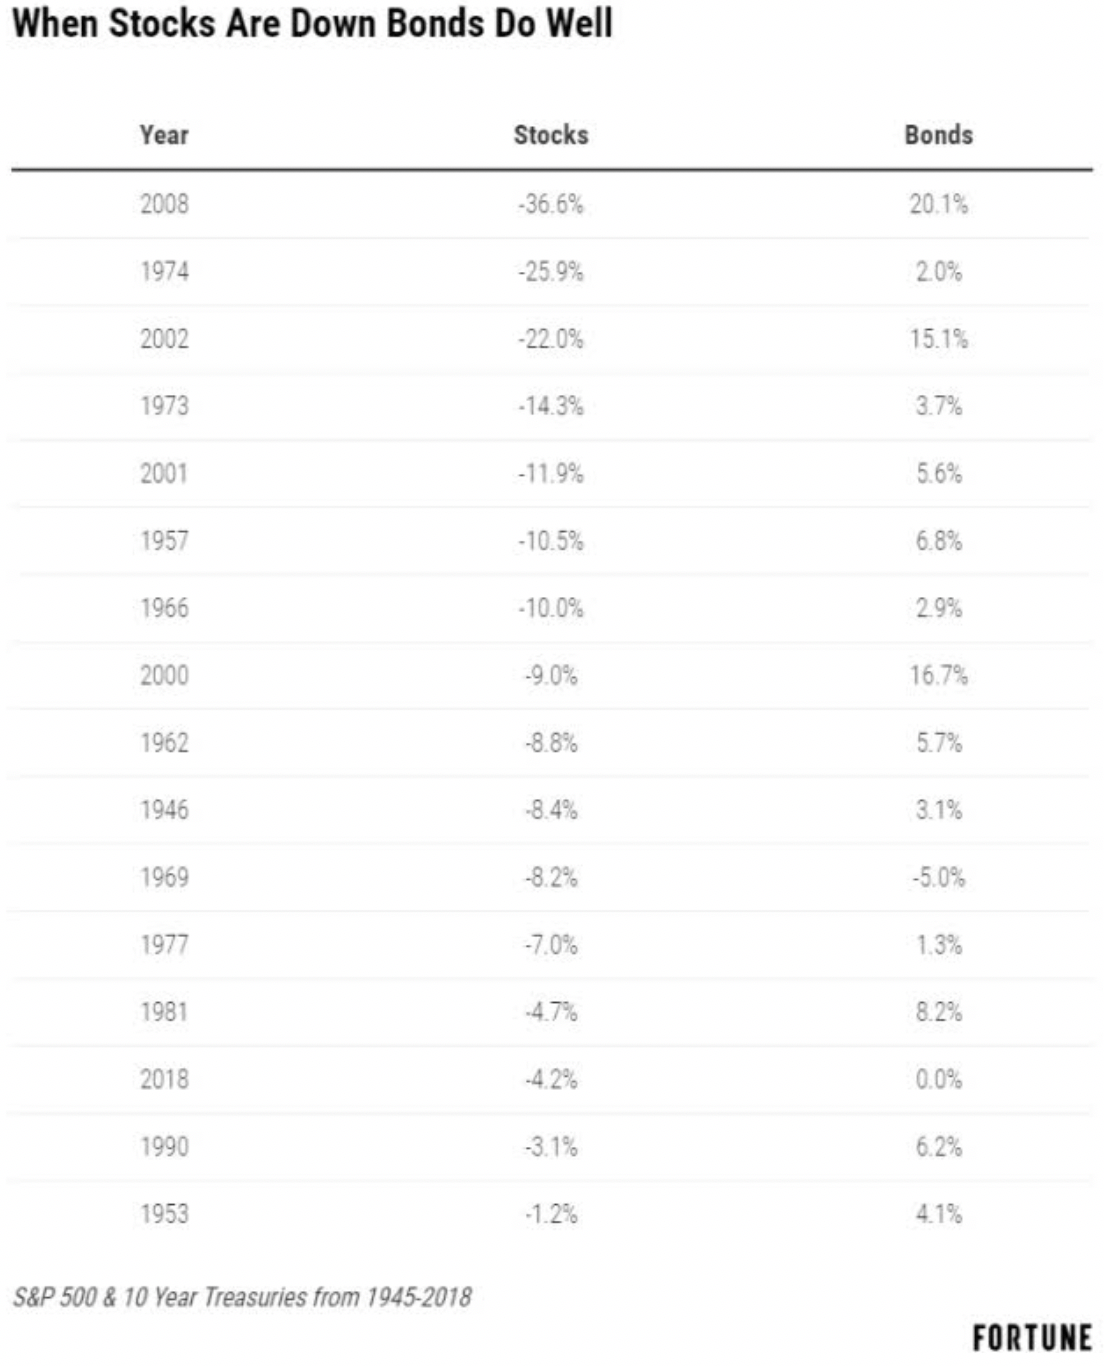
What Mr. Carlson is referring to is the fact that since 1945 bonds have remained stable or gone up in 92% of years that stocks fall.
A study from Duke University found that the humble long-duration Treasury bond fund was the single most effective form of passive hedging from 1985 to 2018.
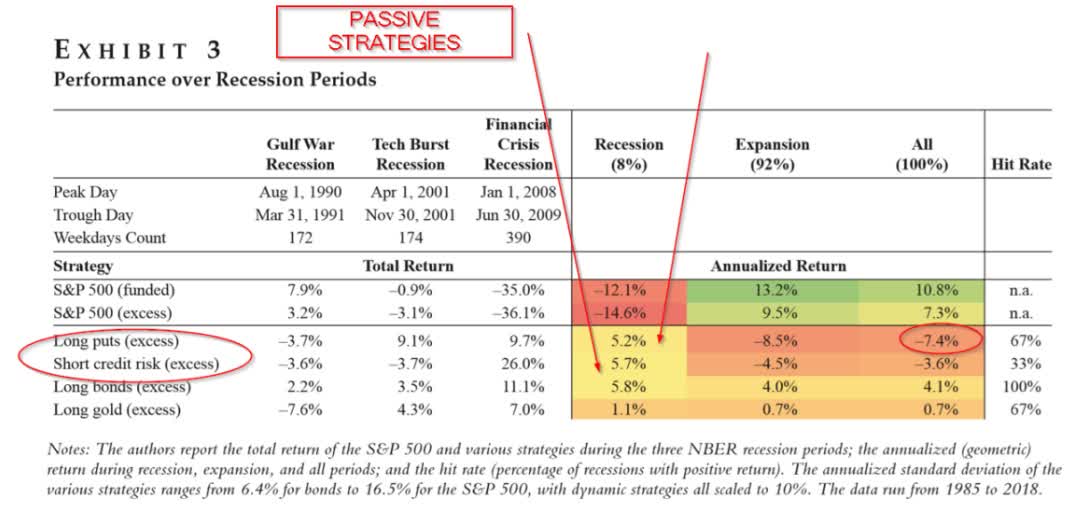
(Source: Duke University)
Not only do bonds tend to deliver positive returns over the entire economic cycle (though they will deliver less from a starting lower yield in the future) but they are far less costly to maintain than puts or credit default SWAPs. As long as US Treasuries (or other forms of sovereign bonds) are considered risk-free safe-haven investments, they will likely always serve as an effective hedge barring a sharp and unexpected spike in inflation.
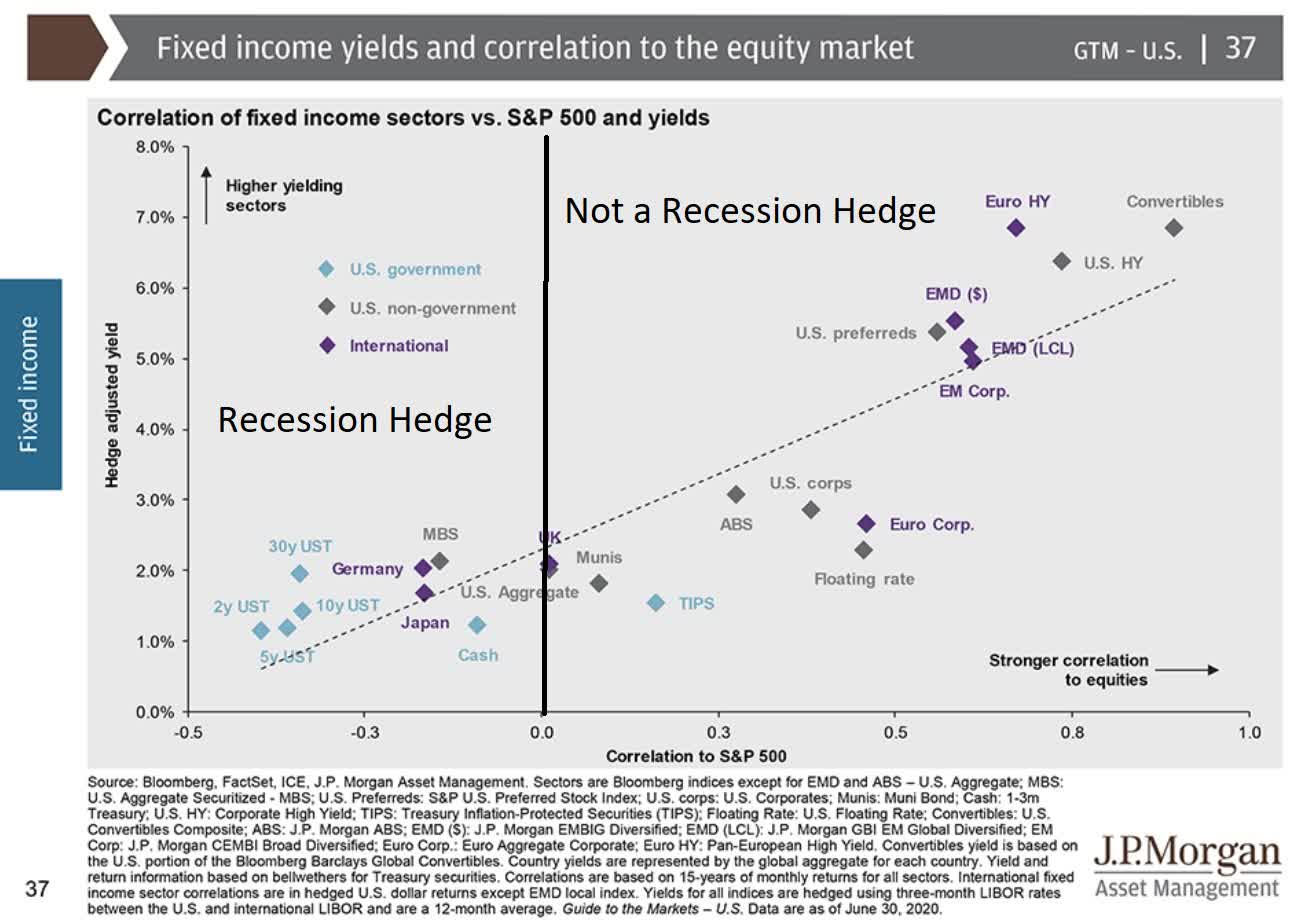
That’s because they tend to be negatively correlated assets relative to stocks. Thus the reason they are still worth owning, along with an appropriately sized cash position (such as high-yield savings or ultra-short-duration T-bills). Cash is what you hold to pay expenses during the rare times that global margin calls such as occurred in March, cause even bonds to fall, along with stocks.
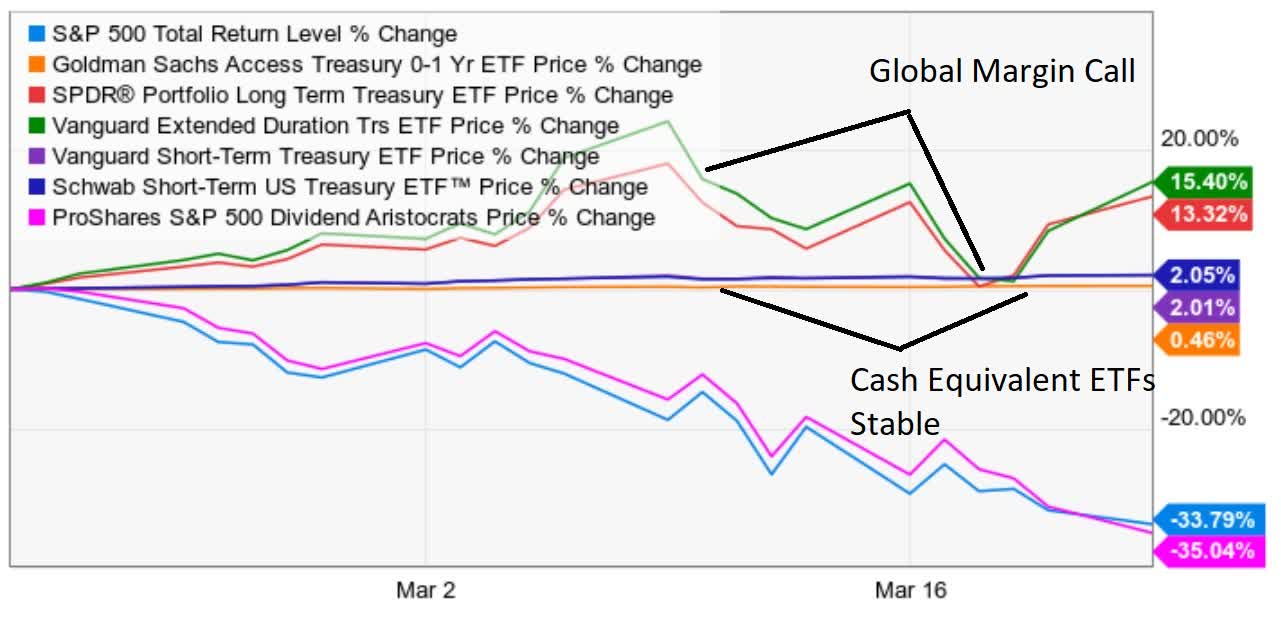
(Source: Ycharts)
The saying on Wall Street is “stocks help us eat well, bonds help us sleep well.”
You can’t be 100% in either stocks or bonds unless your portfolio is so large that you can literally:
- live off virtually zero inflation-adjusted returns from bonds
- live entirely off safe dividend income while ignoring stock price swings as large as 50+%
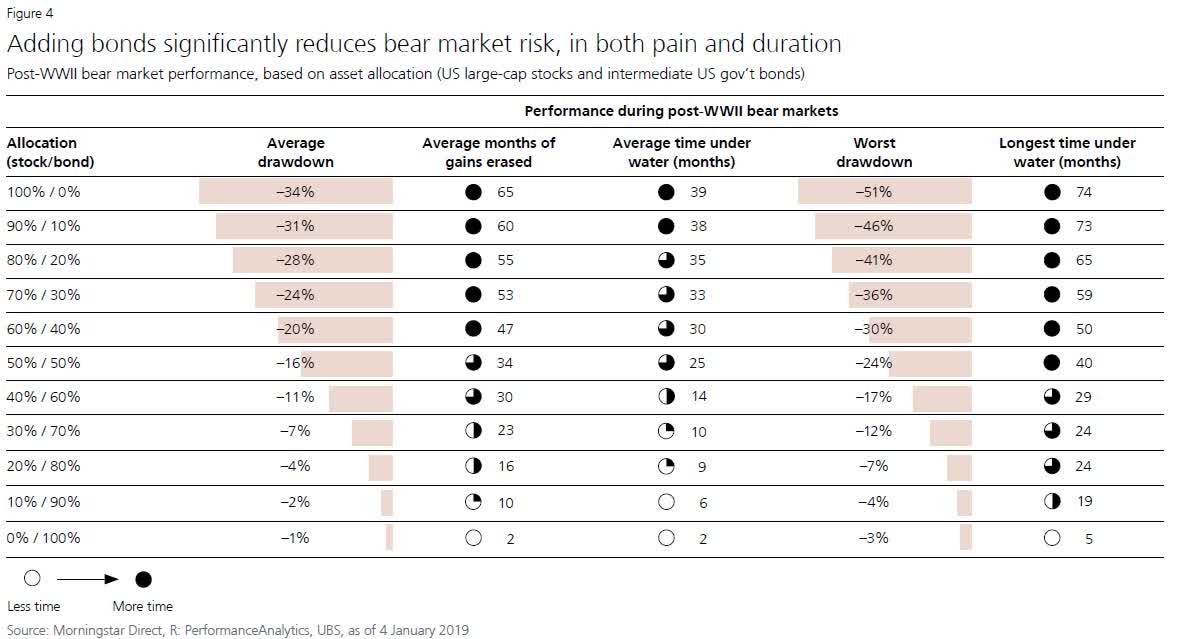
(Source: UBS)
You can use historical stock/bond allocation tables like this one to estimate what’s a prudent asset allocation for you. Jeremy Siegel, professor of finance at the University of Pennsylvania’s Wharton School, recommends a 75/25 stock/bond portfolio for most people.
We believe that the old 60/40 model just won’t be able to cut it anymore,” Siegel, who is also a senior investment strategy advisor at WisdomTree, said Monday on CNBC’s “ETF Edge.” “This environment of low-interest rates is not going to change,” Siegel said, noting that the dividend yield on the S&P 500 is higher than the U.S. 10-year Treasury’s 1.5% yield. “How is [that] … going to give you enough income?
“That’s why we recommend 75/25 as the equity/fixed-income allocation,” he said, adding that it “would be the best way for those approaching retirement to establish their assets to get enough income and gains so they can maintain spending through retirement.” – CNBC
I’ve tested Professor Siegel’s basic hypothesis of a 75/25 stock/bond portfolio and can indeed report that
- it is possible to create a diversified blue-chip dividend-focused 75/25 portfolio with equal or lower long-term volatility than a 60/40 stock/bond portfolio
- but with significantly better returns
- tested during and after the Great Recession, which was the 2nd worst market crash in US history
For an example of how to construct such a portfolio see this article:
BUT, I caution conservative income investors, such as retirees or those nearing retirement, from just assuming that a 75/25 stock/bond (cash included in bond allocation) is the right default setting for your needs.
Let’s consider two retirees.
One has a $1 million portfolio and one $300K. A $1 million portfolio size is sufficiently large that being 12.5% in cash (such as the t-bill ETF GBIL) represents $125,000.
(Source: Guggenheim Partners, Ned Davis Research)
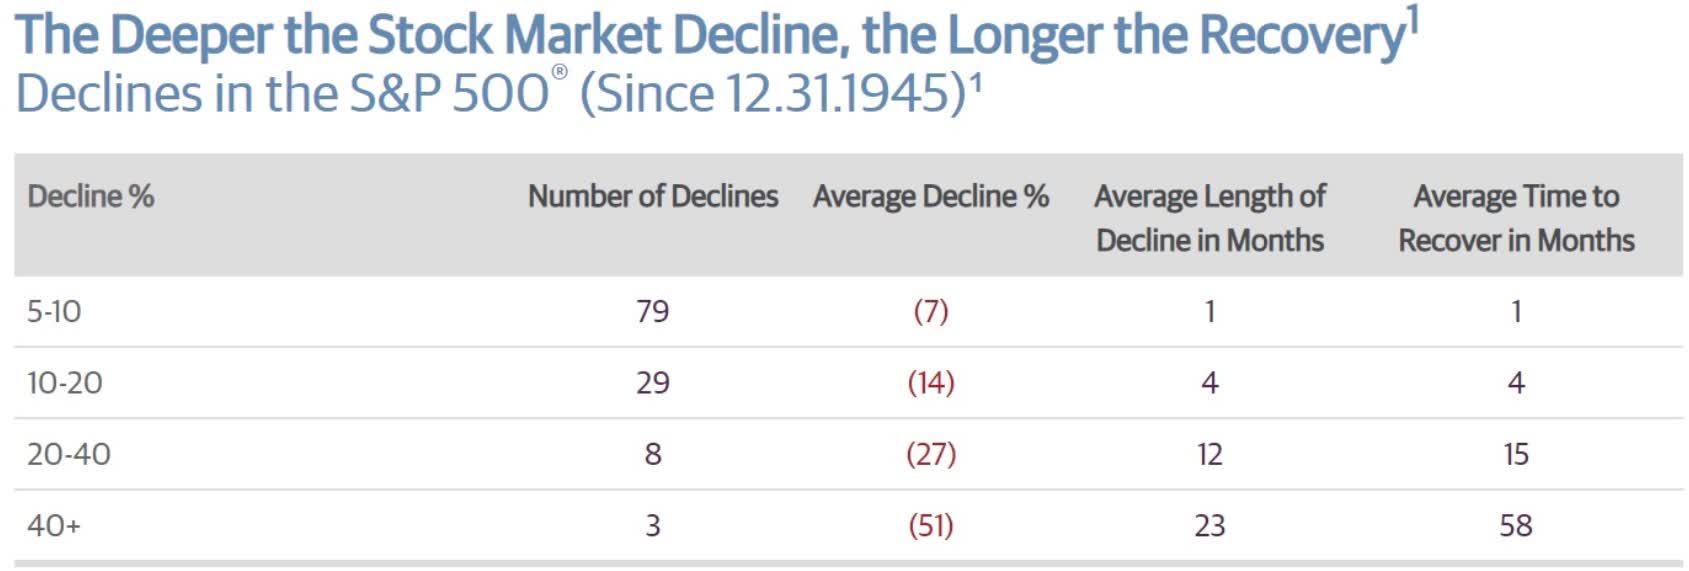
A 12.5% allocation to long-duration US Treasuries (such as EDV, which appreciates 24% when interest rates fall 1% in a market panic) also represents $125,000. The average historical bear market, a 20% to 40% decline such as we saw in March, lasts 27 months from market peak to new record high. $250,000 in cash/bonds is generally sufficient to cover expenses, including dividends, Social Security, and private pensions, that replenish the cash allocation of your portfolio.
BUT, note that in prolonged bear markets, which can last for several years (S&P 500 took six years to recover from Great Recession crash) you will need to rely on your bonds as well as cash, to avoid becoming a forced seller of your stocks. Now imagine you have a $300K portfolio so that 25% cash/bond allocation represents just $75K. If your expenses are low enough, then it’s POSSIBLE that this will be enough to fund your expenses through a prolonged bear market.
(Source: Lance Roberts, Dalbar)
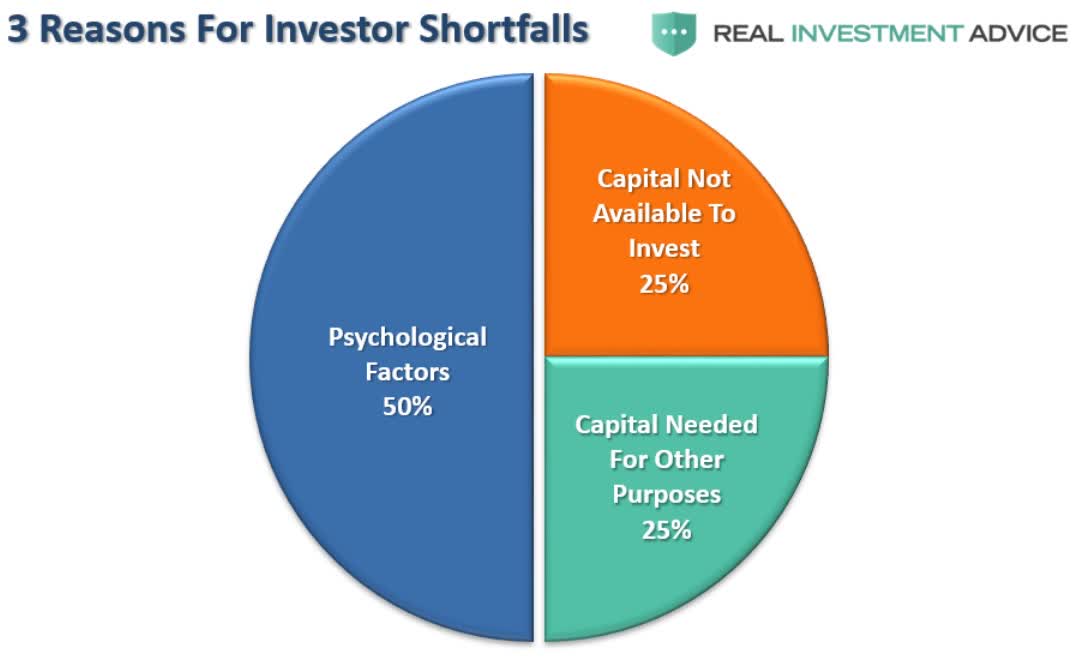
But, what if it lasts five or six years before stocks recover record highs? The prospect of running out of stable or appreciating assets to sell and having to sell quality blue-chips at ridiculously low valuations could keep up at night during a bear market. 50% of terrible long-term investor returns are due to emotional panic selling. Just 25% are from needing to tap your portfolio for emergency expenses.
But, ultimately 75% of subpar investor returns, such as the 0.3% inflation-adjusted returns the average investor has experienced over the last 20 years, are the result of improper asset allocation. For example, if your annual living expenses are 20K above what dividends + Social Security + private pensions (which most people don’t have) then you may want to maintain $100K to $150K in cash/bonds. That would likely be enough to get you through a 5 to a 7-year bear market, without having to sell stocks (which are paying safe and rising dividends if you select them carefully) at a potential loss.
For someone with a $1 million retirement portfolio, this could mean that you could safely be 90/10 or 85/15 stocks/bonds. For someone with a $300K portfolio, this might require a 50/50 stock/bond portfolio. There are obviously issues with being overly allocated to cash/bonds, primarily that they yield almost nothing today and future returns are likely to be on the order of 1% to 2% CAGR. But, there is no magic solution to asset allocation. If your portfolio isn’t large enough there are no easy solutions to generating sufficient SAFE income and sufficient returns to allow for a comfortable retirement.
In Part 3 of this series, I’ll conclude our discussion of protecting yourself from the eventual (though impossible to predict) bubble popping, by explaining the other cornerstone of prudent risk-management in a manic market like this one.
Want More Great Investing Ideas?
9 “BUY THE DIP” Growth Stocks for 2020
Top 5 WINNING Stock Chart Patterns
7 “Safe-Haven” Dividend Stocks for Turbulent Times
SPY shares were trading at $320.27 per share on Wednesday afternoon, up $1.35 (+0.42%). Year-to-date, SPY has gained 0.53%, versus a % rise in the benchmark S&P 500 index during the same period.
About the Author: Adam Galas

Adam has spent years as a writer for The Motley Fool, Simply Safe Dividends, Seeking Alpha, and Dividend Sensei. His goal is to help people learn how to harness the power of dividend growth investing. Learn more about Adam’s background, along with links to his most recent articles. More...
More Resources for the Stocks in this Article
| Ticker | POWR Rating | Industry Rank | Rank in Industry |
| SPY | Get Rating | Get Rating | Get Rating |


