
Constellation Brands, Inc. (STZ), boasting a market cap of $46.47 billion, ranks as one of the largest beverage corporations globally. For the fiscal quarter ended May 2023, steadily increasing demand and favorable pricing for its alcoholic beverages resulted in a year-over-year net sales growth of 6.4% to $2.51 billion.
However, its financial landscape is not devoid of challenges. Alongside a non-GAAP EPS hike of 9.4% year-over-year to $2.91, its GAAP EPS nosedived by 64.1% to settle at $0.74. Similarly, stark contrasts can be observed in terms of comparable operating income. Its comparable operating loss came in at $62.5 million against the prior-year quarter’s operating income of $23.9 million.
Moreover, escalating costs hampered the beer segment’s operating margins by an alarming 220 basis points during the quarter.
Despite outperforming analysts’ expectations for top and bottom lines, STZ faces substantial margin pressure due to surging raw material costs and heightened marketing expenditure.
Considering the mentioned factors, adopting a cautious approach toward investing in STZ may be wise until a more appropriate entry point presents itself. Analyzing the company’s key metrics will further clarify the reasoning behind such caution.
Analyzing Constellation Brands Inc.’s Financial Performance: Trends in Net Income, Revenue, Gross Margin, and Current Ratio (August 2020 – May 2023)
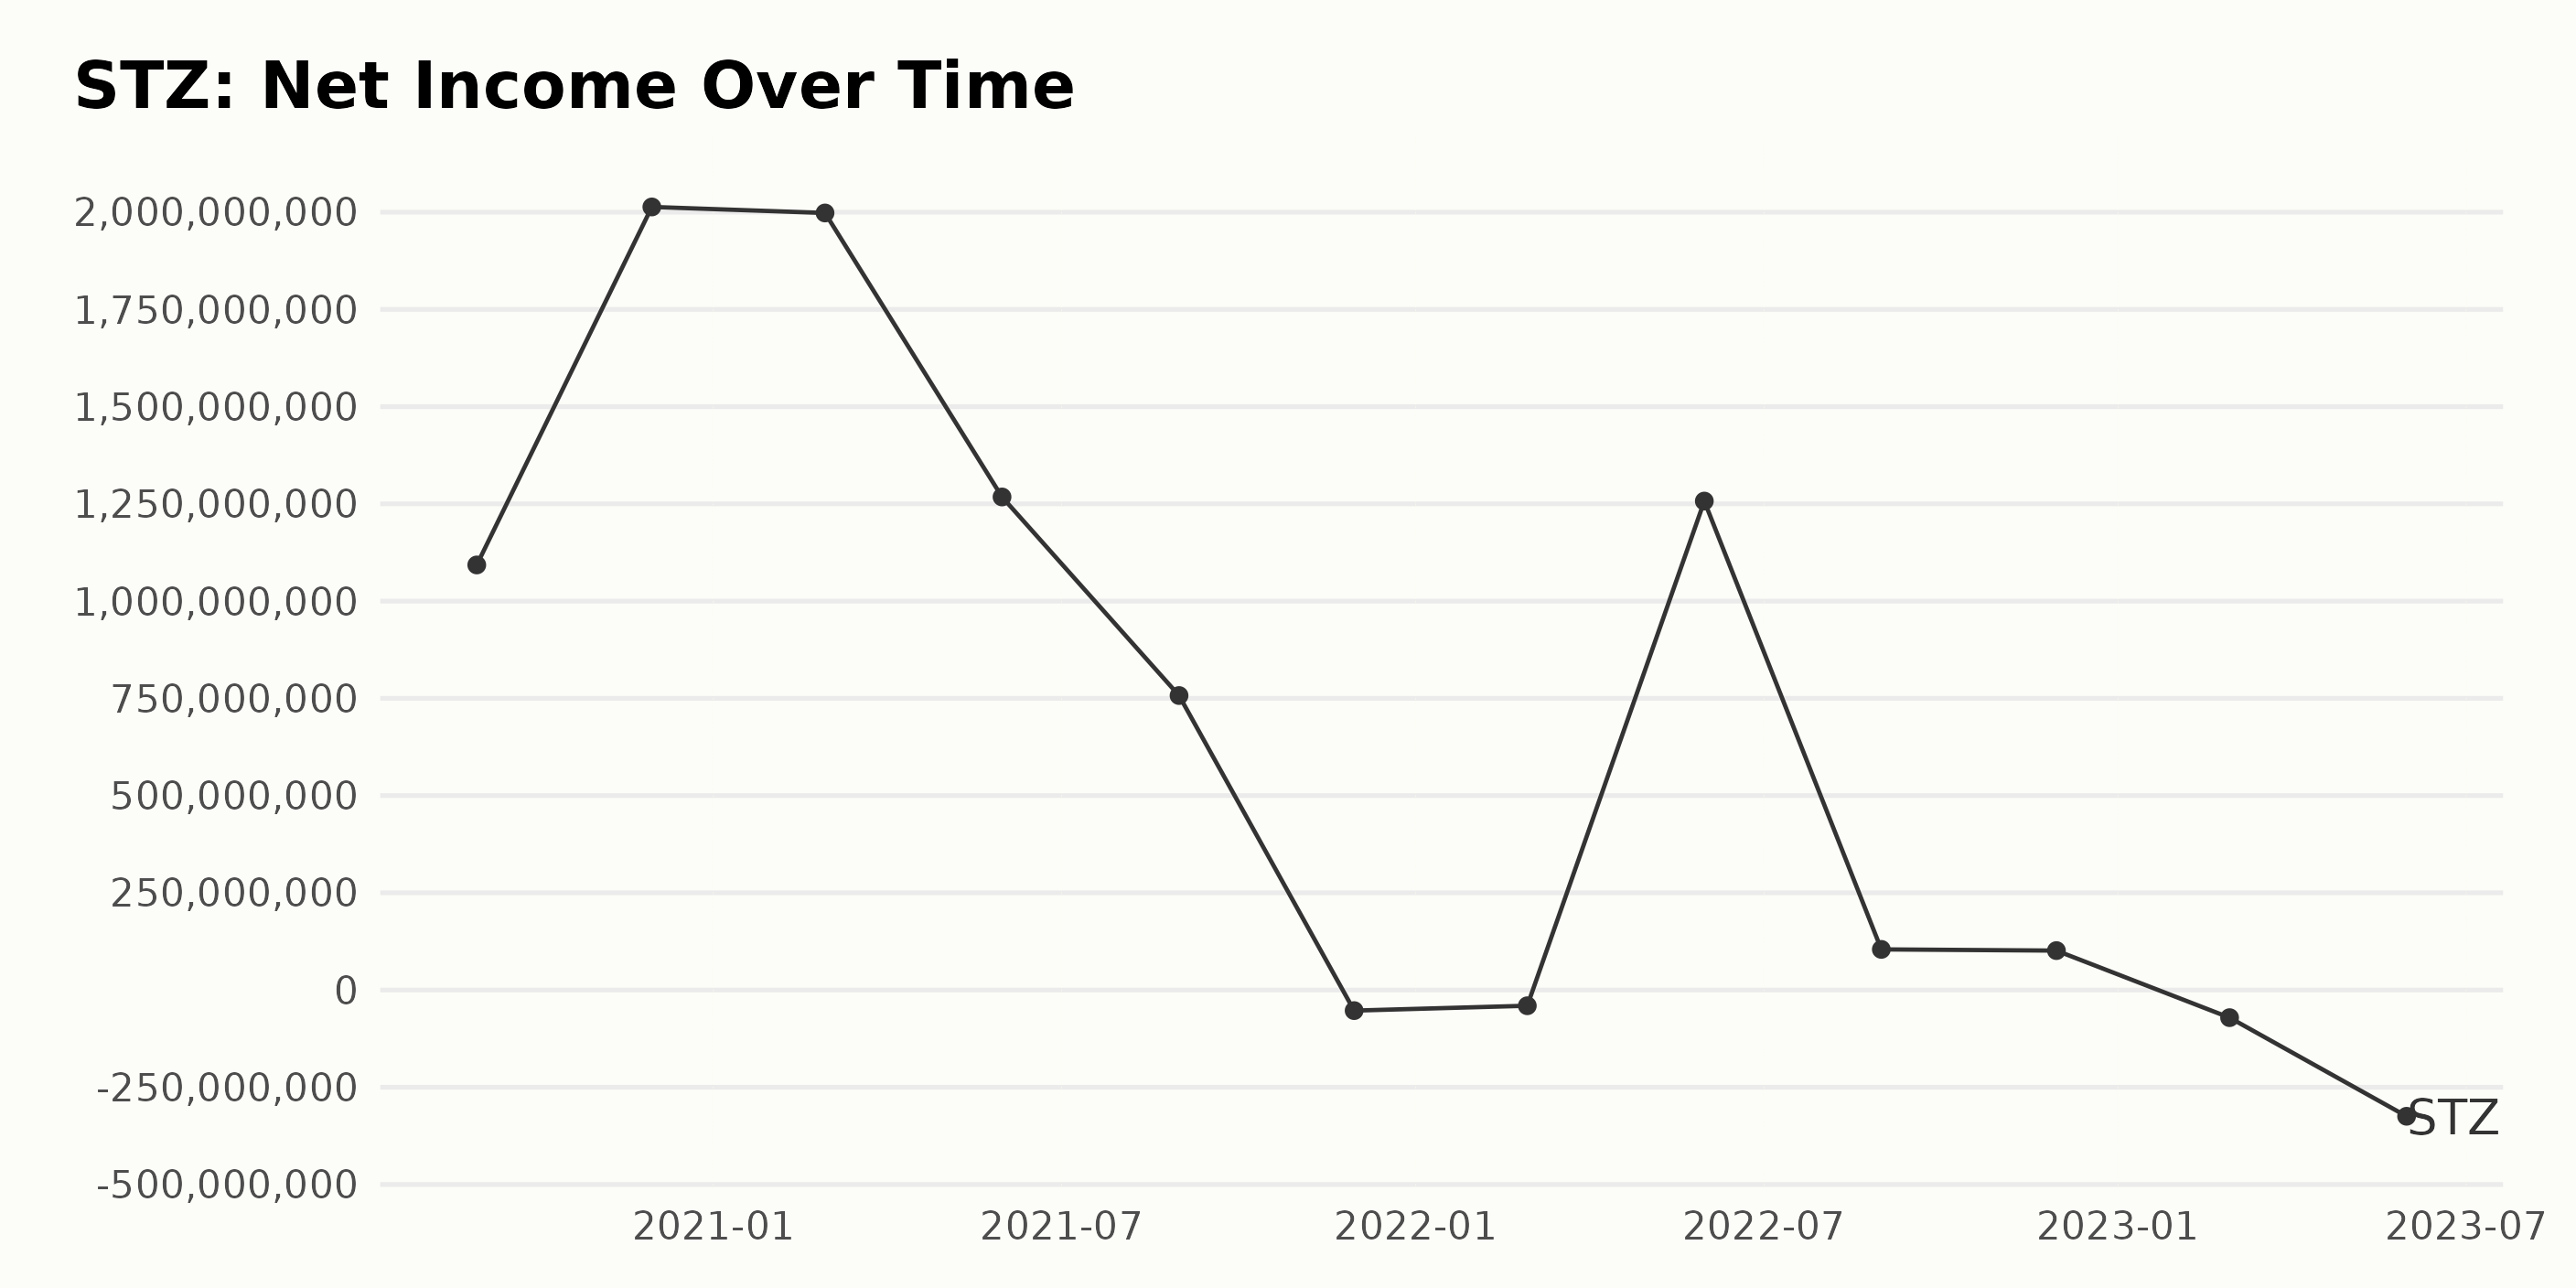
Here’s a summarized view of the trailing-12-month net income trend and fluctuations of STZ for the periods from August 2020 to May 2023:
- In August 2020, net income stood at $1.09 billion.
- There was a sharp increase to $2.01 billion by November 2020, representing an upward trend.
- After slightly falling to $1.99 billion in February 2021, the net income plummeted to $757 million in August 2021.
- The fluctuation continued, with net income dipping into the negatives in November 2021 at -$52.9 million and a trough at -$404 million in February 2022.
- By May 2022, there was a drastic recovery as the net income surged to $1.25 billion.
- However, the upward hike was short-lived as the company saw a massive decline in August 2022 ($104.5 million), maintained up to November 2022 ($101.4 million).
- In 2023, the net income slipped back into the negative quadrant, getting as low as -$324.6 million in May.
The overall trend depicts a volatile pattern with significant peaks and troughs. The initial growth period culminated in a sharp fall to the negative region, followed by a dramatic recovery and subsequent decline. Calculating from the first (August 2020: $1.09 billion) to the last value (May 2023: -$324.6 million), there is a decline of approximately -130%. Given the sequence of both strong eruptions and falls within the series, STZ has experienced a fairly erratic financial performance regarding net income during this period.
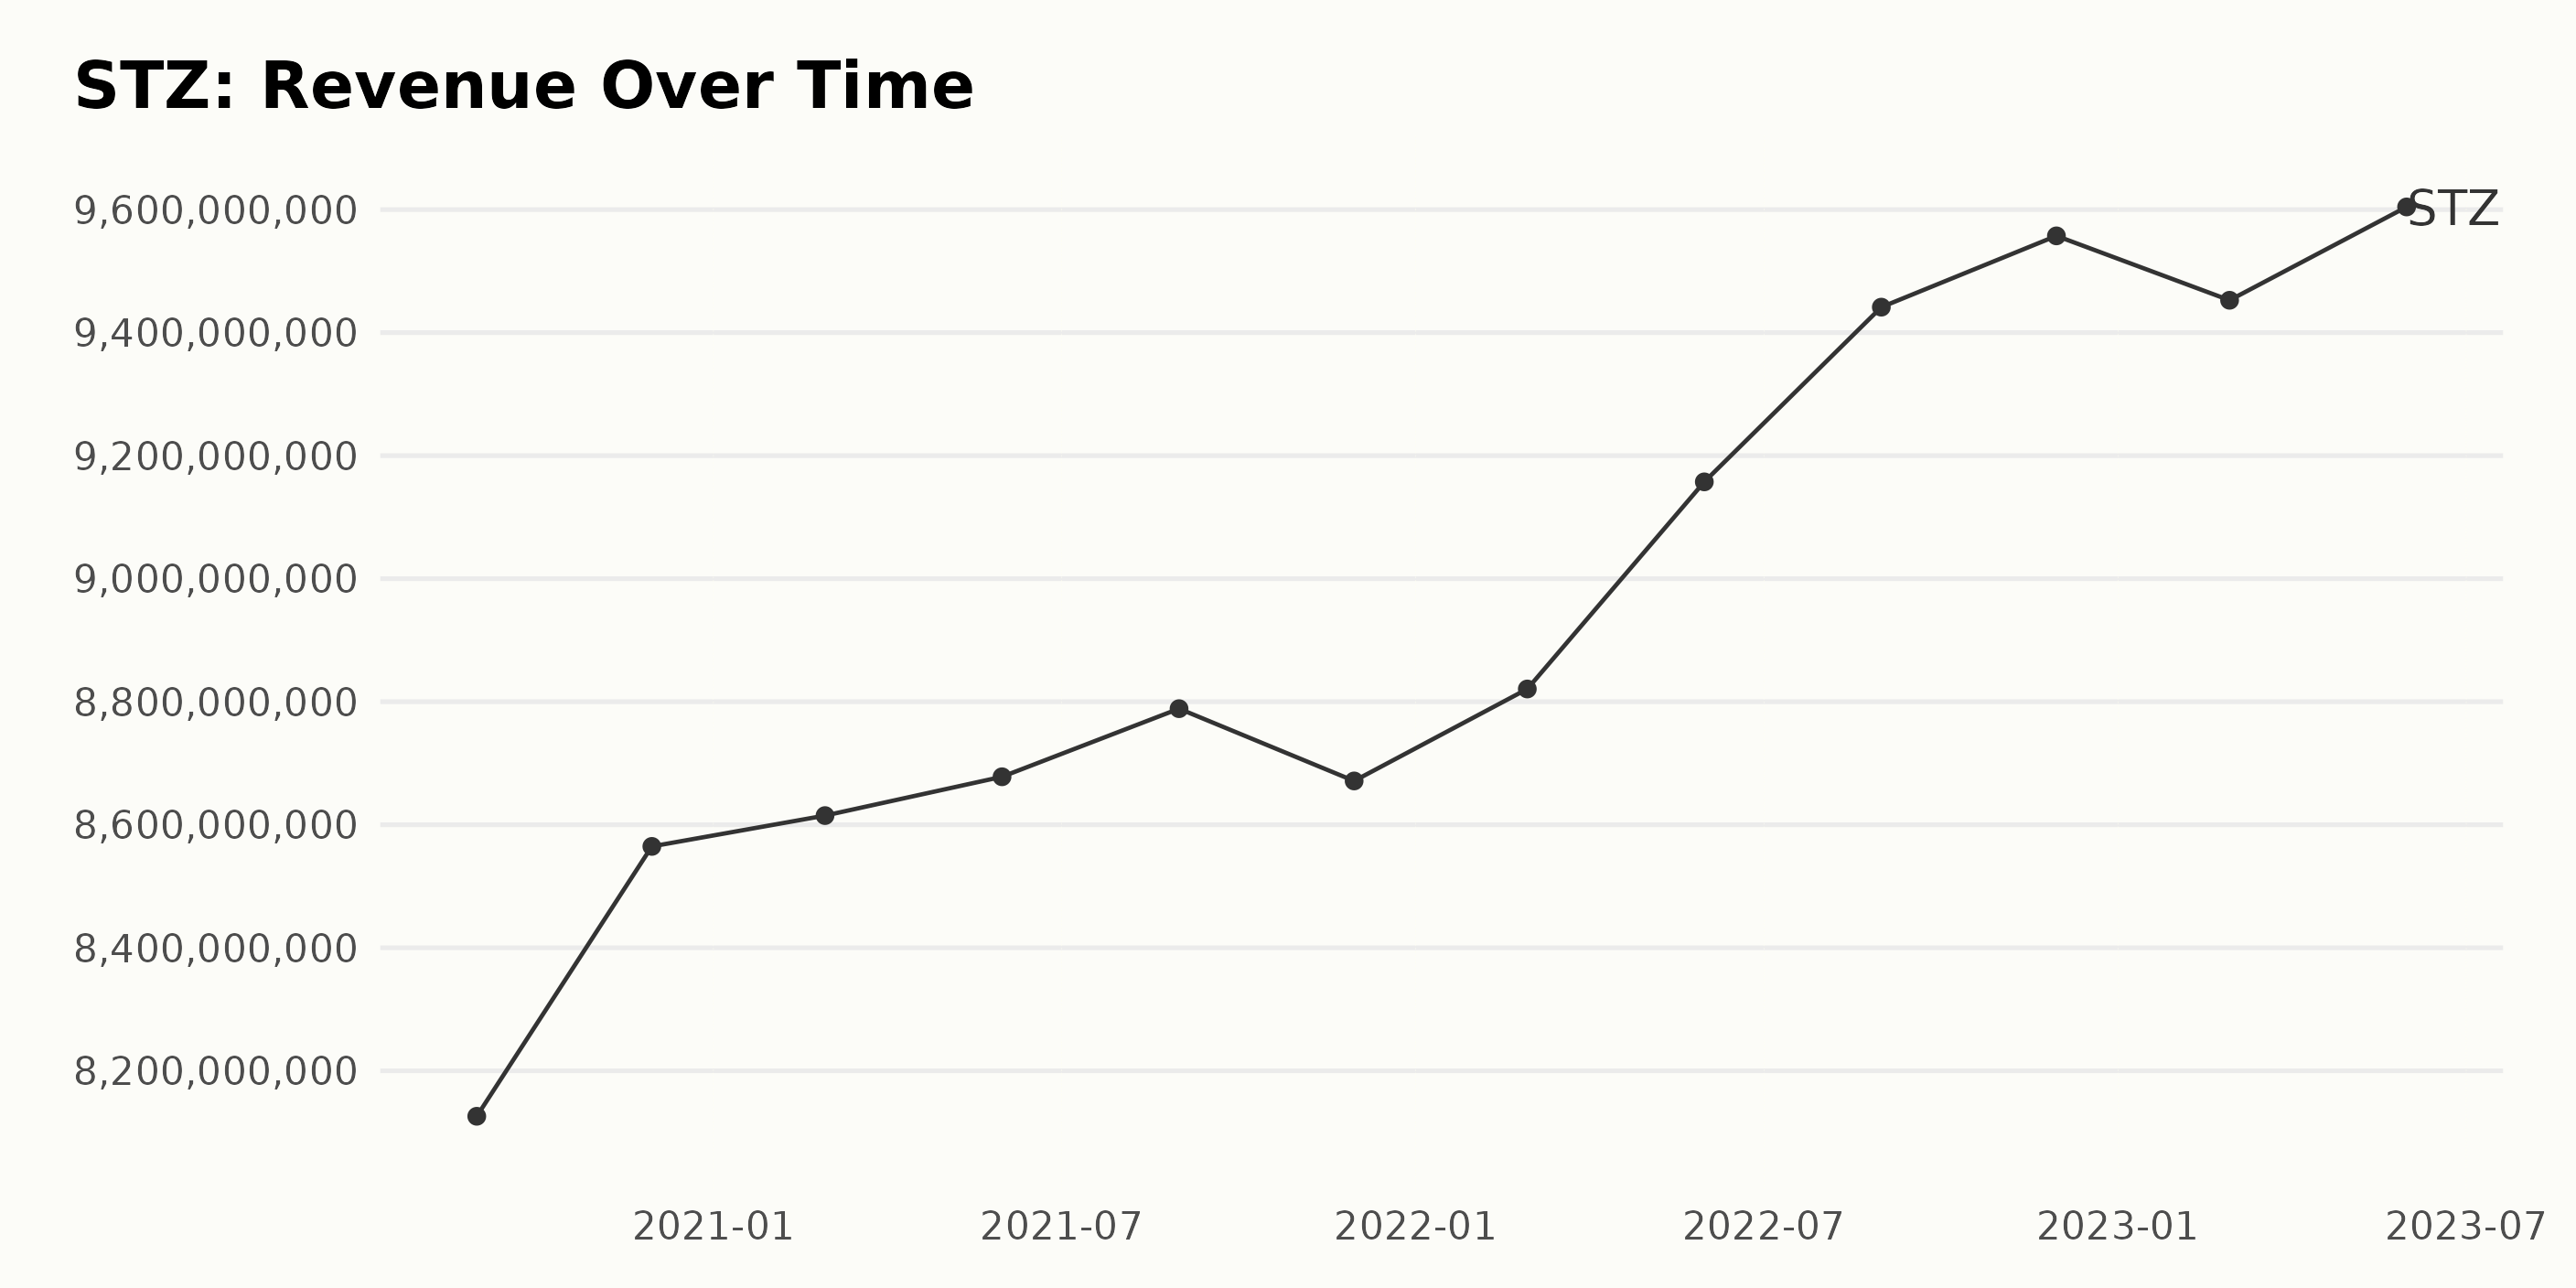
The trailing-12-month revenue of STZ exhibits a positive growth trend over the observed period, with some minor fluctuations experienced in the more recent years.
- As of August 2020, STZ reported revenue of $8.13 billion.
- This value saw a consistent uptick, crossing the $8.56 billion mark by November 2020 and gradually reaching $8.78 billion by August 2021.
- A slight dip occurred in November 2021 to $8.67 billion but was quickly amassed by an increase to $8.82 billion by February 2022.
- Significant jumps are seen in May and August of 2022, with generated revenue of $9.16 billion and $9.44 billion, respectively.
- Revenue peaked at $9.56 billion in November 2022 but dropped slightly in February 2023 to $9.45 billion before closing the series at $9.6 billion in May 2023.
From August 2020 to May 2023, STZ’s revenue increased by $1.47 billion, or roughly 18%. More recent data from 2022 to 2023 shows a marked acceleration in this growth.
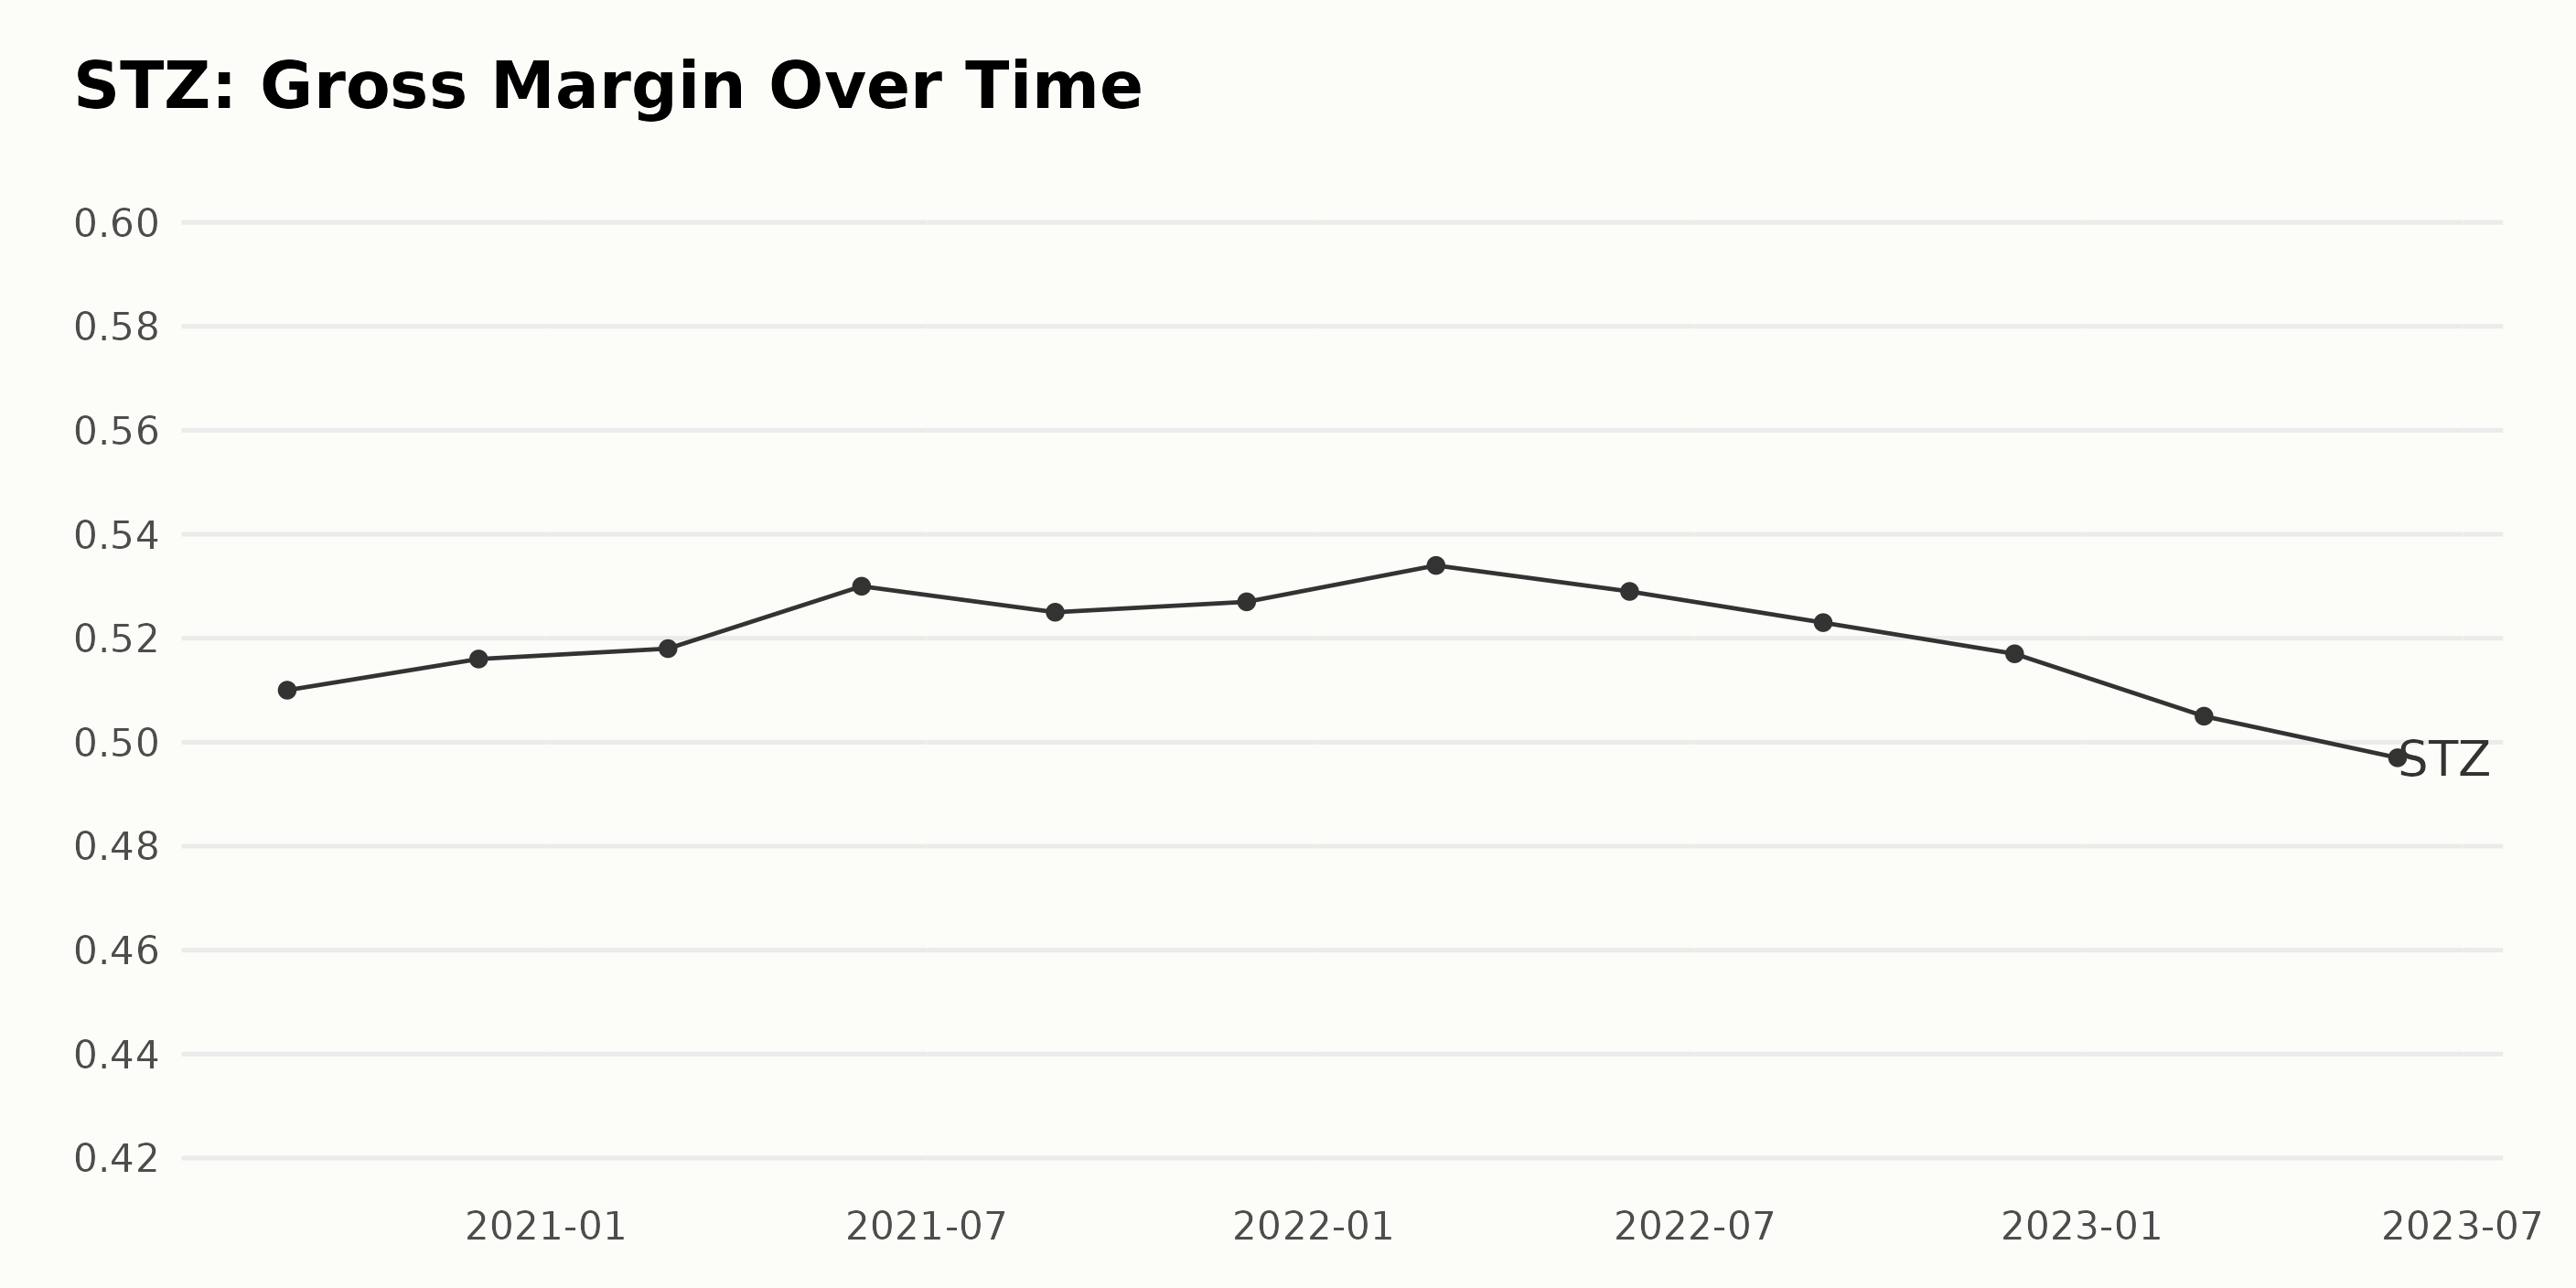
The trend for STZ’s gross margin shows overall fluctuations but a noticeable fall in recent times. Here are key points drawn from the provided data:
- In August 2020, STZ reported a gross margin of 51.00%.
- There was a steady increase until May 2021, when it peaked at 53.00%.
- However, from May 2021 onward, the gross margin fluctuated, reaching 52.50% in August 2021.
- Post-August 2021, the gross margin steadily declined, registering 51.70% in November 2021 and 52.30% in February 2022.
- The gross margin was 52.30% in August 2022 and dropped to 51.70% by November 2022.
- As of May 2023, the gross margin sits at 49.70%, showcasing a downward trend from its previous peak in May 2021.
Comparing the first recorded gross margin in August 2020 to the last record in May 2023, STZ’s gross margin decreased by approximately 1.30%. This suggests that although the gross margin had periods of growth, the recent trend indicates a decline.
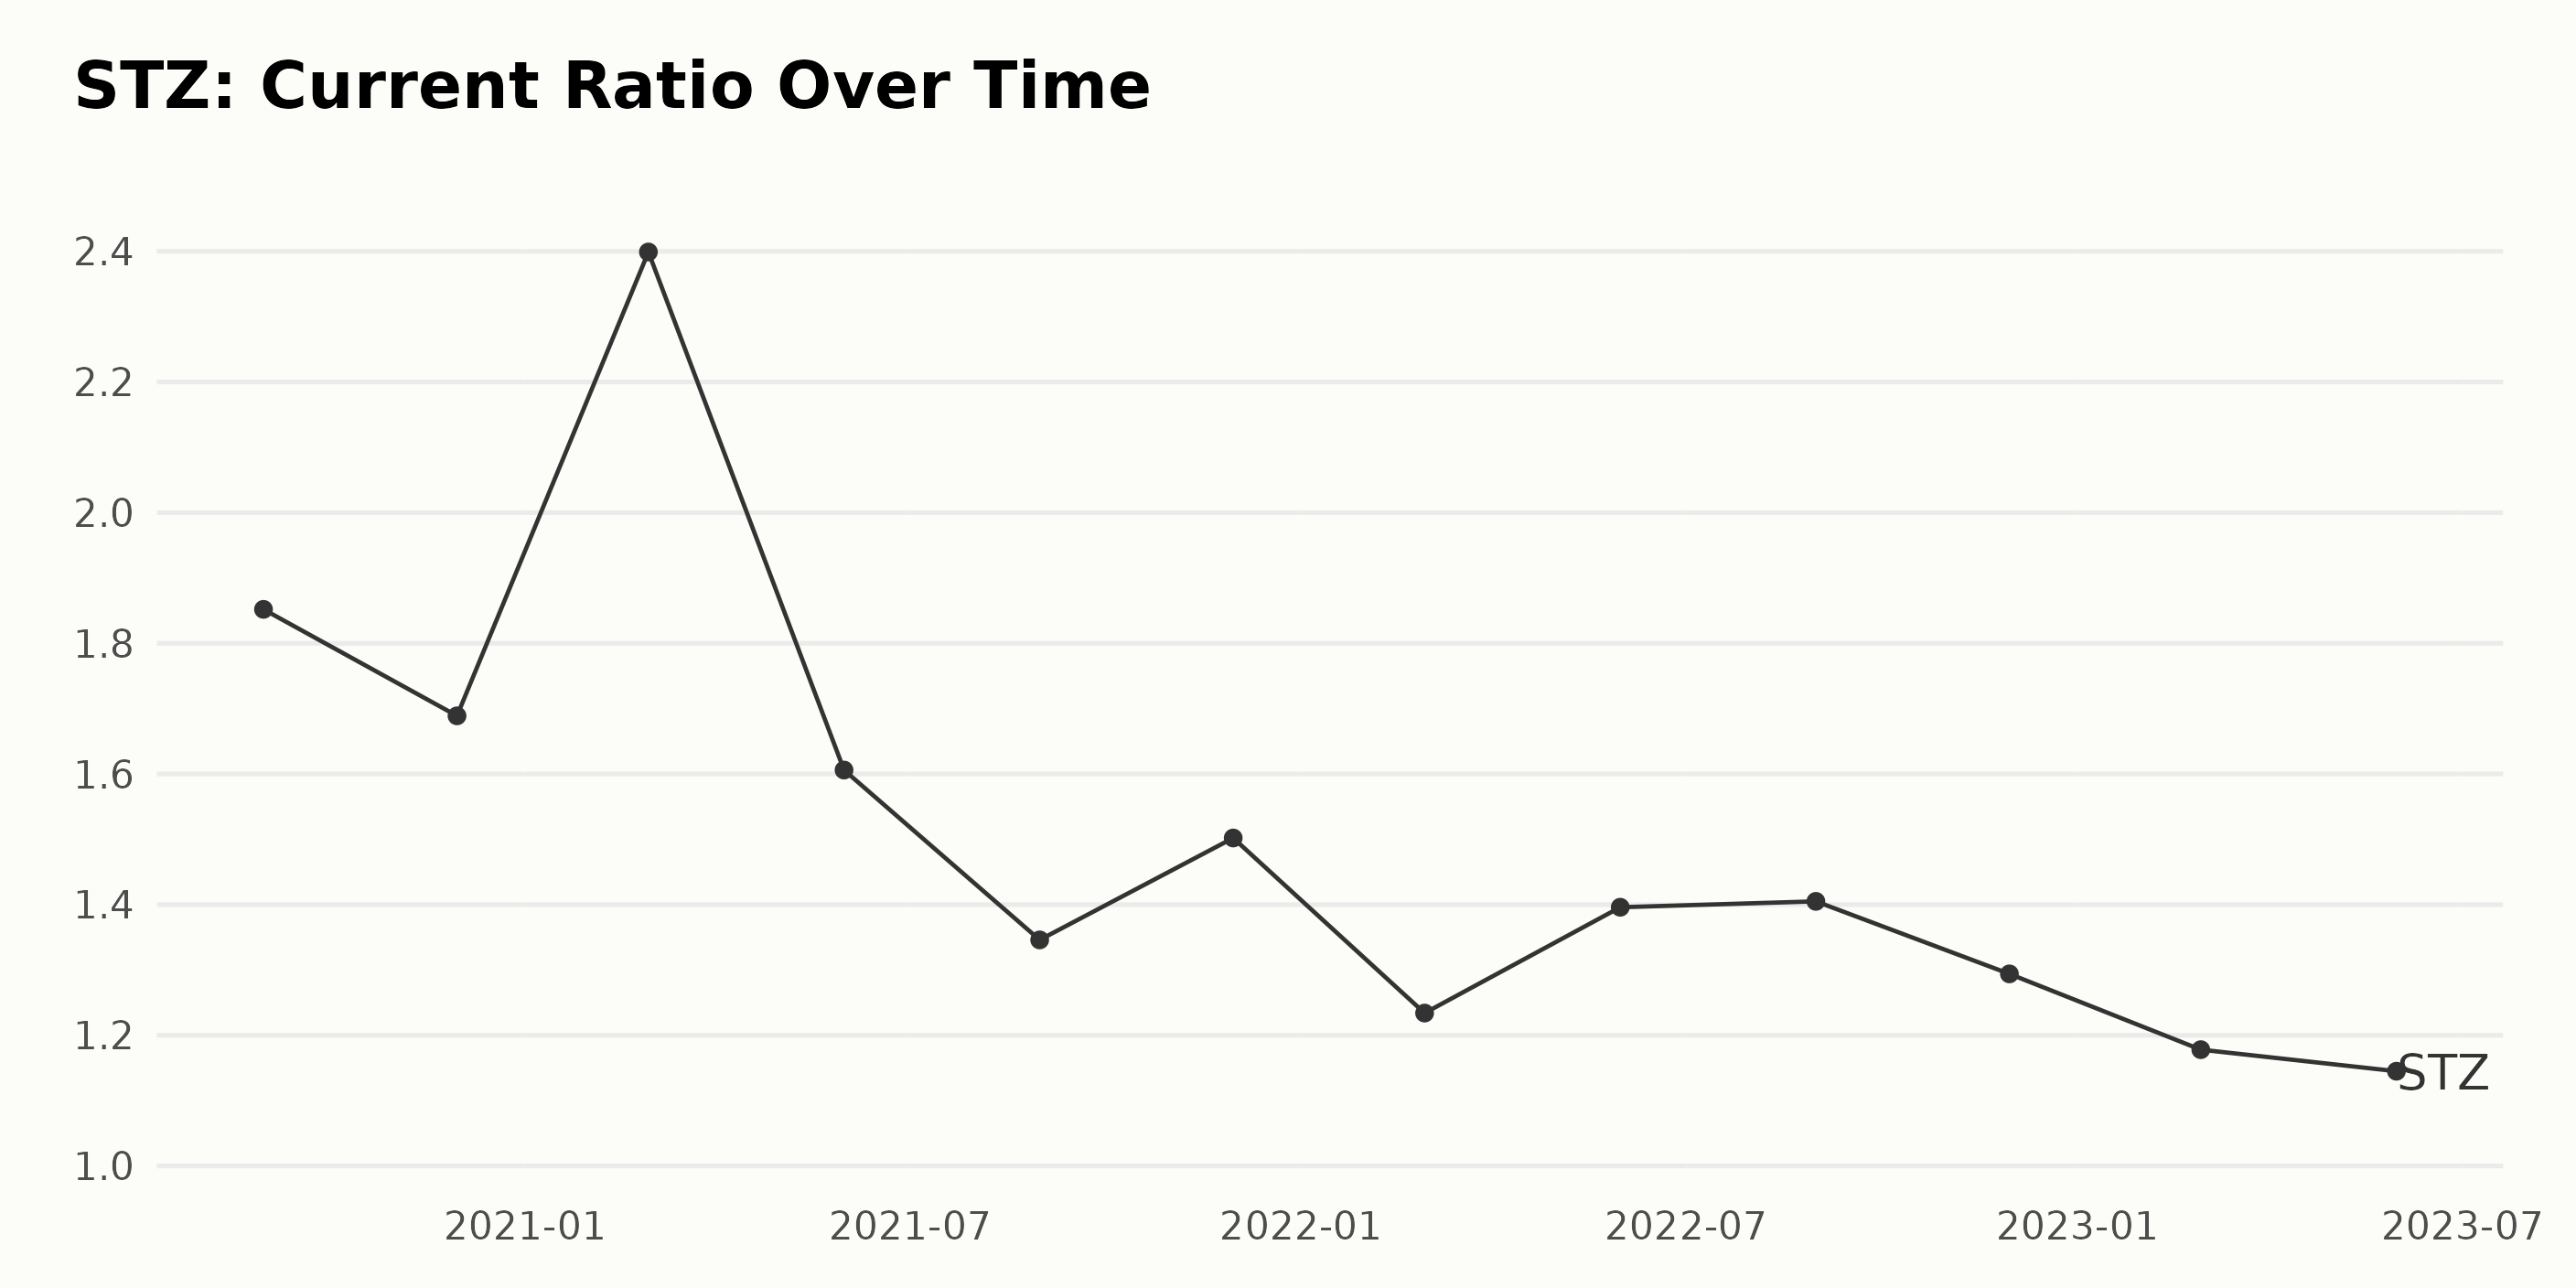
The current ratio of STZ has seen fluctuations over a two-year period, and overall, there’s a decline in this value. Below is the clear trend:
- In August 2020, the current ratio stood at 1.85 (August 31, 2020).
- It dropped to 1.69 by November 2020 (November 30, 2020).
- February 2021 witnessed a sharp rise as it reached a value of 2.40 (February 28, 2021), which is the highest for this period.
- The value then fell to 1.61 by May 2021 and kept declining till it touched 1.35 in August 2021 (May 31, 2021 – August 31, 2021)
- A slight recovery was seen as the value increased to 1.50 in November 2021 (November 30, 2021) but started dropping again afterward.
- Despite a minor hike in May 2022, taking it to 1.40, the current ratio continued to fall over the next year to reach 1.15 by May 2023 (May 31, 2022 – May 31, 2023).
Looking specifically at the most recent figures, the current ratio stood at 1.29 in November 2022, then decreased to 1.18 in February 2023. The value then slightly decreased to end at 1.15 in May 2023. Between August 2020 and May 2023, the current ratio declined by roughly 38.4%. This shows that, in general, the ability of STZ to cover its short-term liabilities with short-term assets has worsened over the study period. The emphasis on more recent data indicates this downward trend is continuing, indicating potential concerns for liquidity risk in STZ.
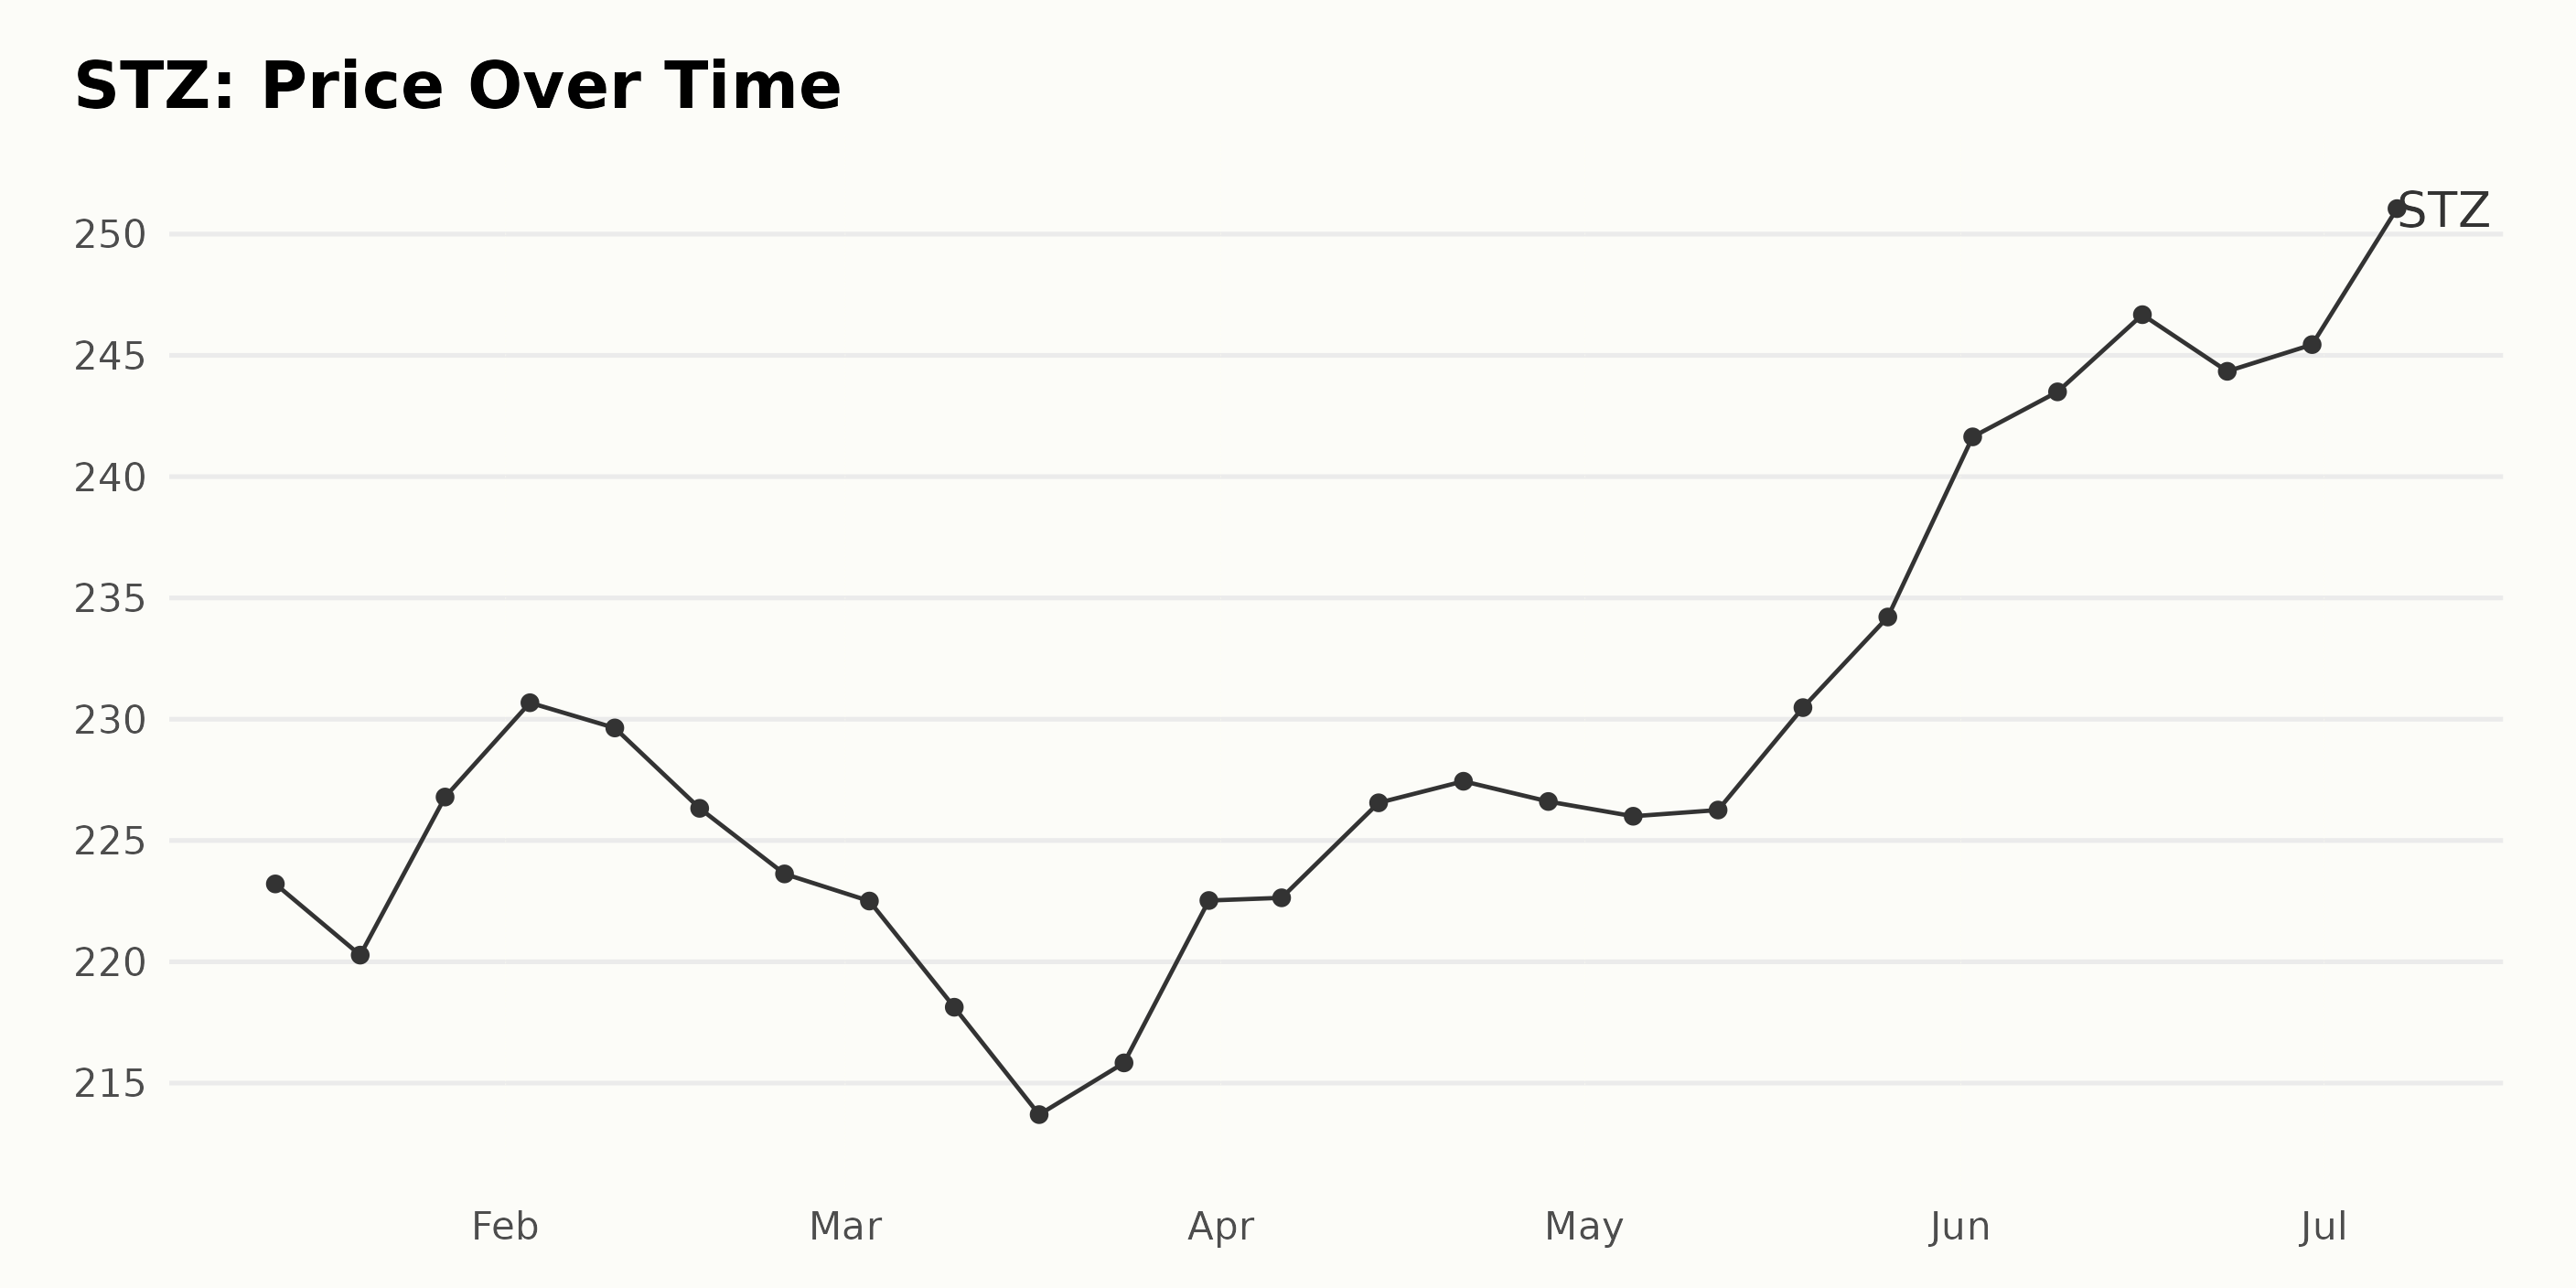
Tracking Constellation Brands Stock Price: A Six-Month Analysis and Trend Overview
Analyzing the data for STZ’s share prices, the following pattern arises:
- On January 13, 2023, the price was $223.21.
- Over the next week, it dropped slightly to $220.28 by January 20.
- The price then increased to $226.79 on January 27 and peaked at $230.68 on February 3.
- Afterward, a moderate fluctuation occurred, peaking again at around $229.64 on February 10 before gradually descending to $213.7 by March 17.
- By March 24, the price rebounded to $215.83 before showing another increase to $222.53 by the end of March.
- In April, prices remained relatively stable with minimal volatility, hovering just above $220.
- From May, prices began to rise steadily, starting at $226 on May 5 and climaxing at $234.21 at the end of that month.
- June saw the most significant growth, starting at $241.64 on June 2 and reaching $246.68 on June 16. Despite a slight decrease afterward, it ended the month at around $245.44.
- By July 7, the price had escalated to its highest point in this data set at $253.49.
In terms of trend, there is an overall growth in the share price over the six months from January to July 2023. However, this growth is inconsistent – it undergoes fluctuations along the way. The most noticeable acceleration in growth occurred in June 2023, followed by a slight deceleration towards the end of that month. A stronger trend towards increase appears later in the time frame. Here is a chart of STZ’s price over the past 180 days.
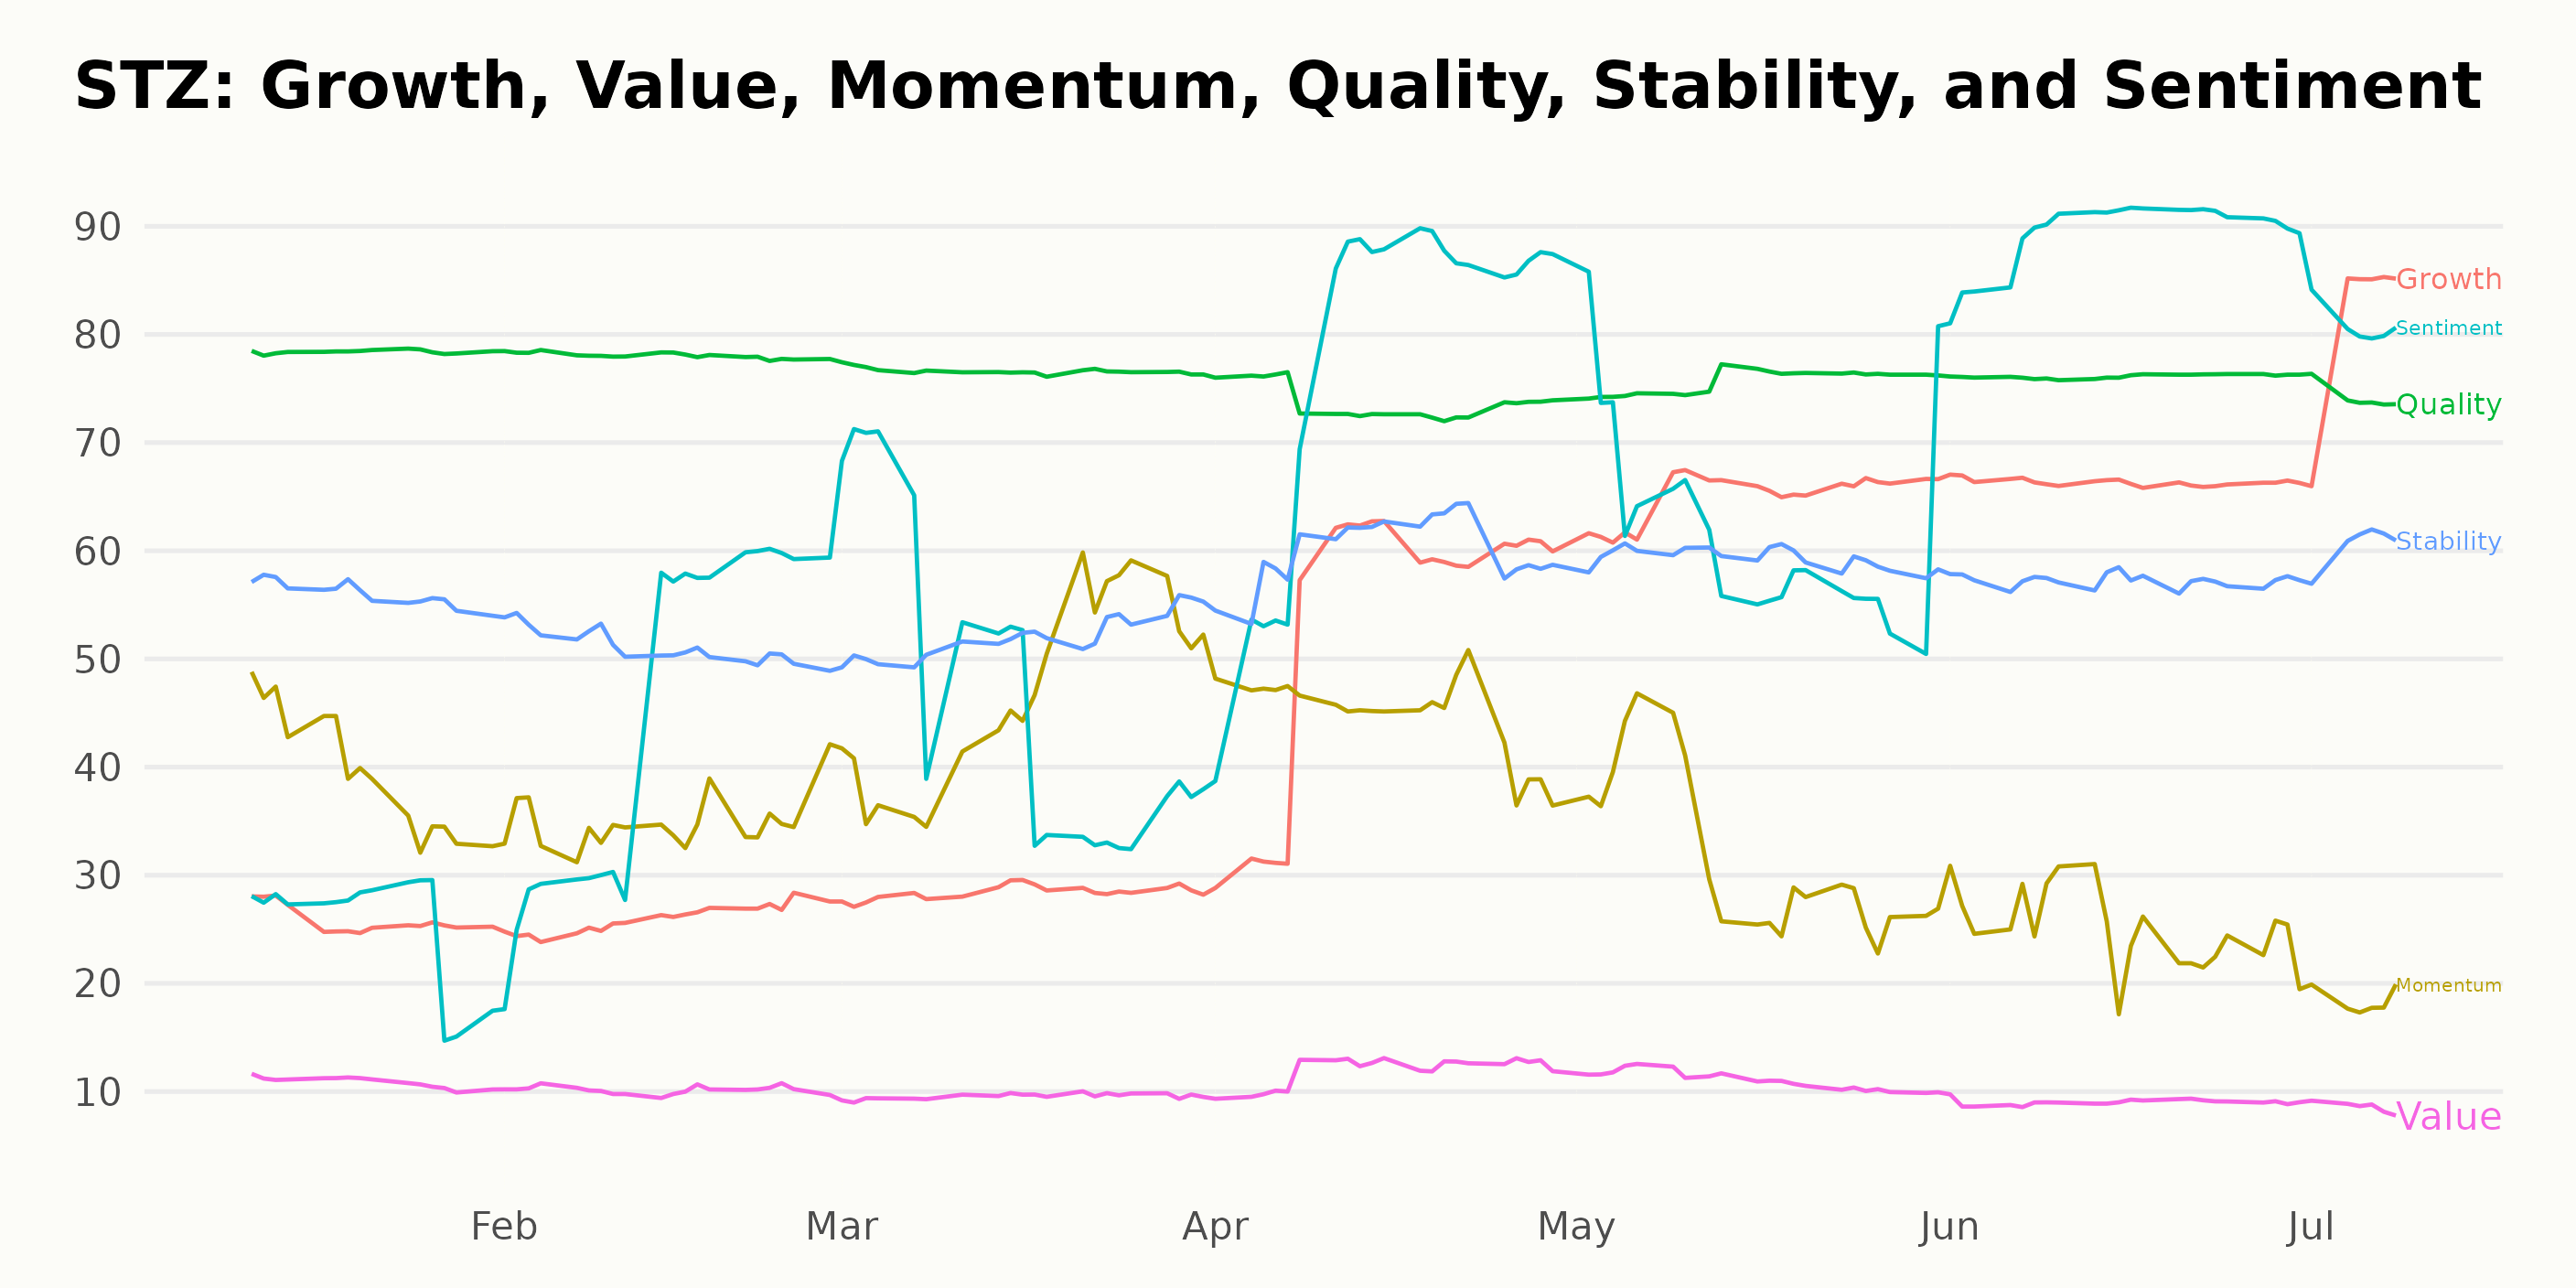
Analyzing STZ’s POWR Ratings
STZ has an overall C rating, translating to a Neutral in our POWR Ratings system. It is ranked #23 out of the 36 stocks in the Beverages category. It also has a C grade for Stability and Quality.
Observe how STZ’s ranking and POWR Ratings have evolved from January to July 2023:
- January 2023: Rating – C, Rank in category – 29/36
- February 2023: Rating – C, Rank in category – fluctuated between 29/36 and 30/36
- March 2023: Rating – C, Rank hit a low of 28/36 but ended at 31/36
- April 2023: Rating – C, Rank improved significantly, beginning at 30/36 and ending at 25/36
- May 2023: Rating – C, Rank remained relatively stable, fluctuating between 27/36 and 28/36
- June 2023: Rating – C, Rank improved further, with position increasing to 24/36 and then 23/36
- July 2023: Rating – C, Rank remained steady at 23/36
While maintaining a consistent rating of C throughout these months, STZ improved its ranking from #29 to #23 within its category.
Stocks to Consider Instead of Constellation Brands Inc. (STZ)
Other stocks in the Beverages sector that may be worth considering are Coca-Cola Bottling Co. Consolidated (COKE), Embotelladora Andina S.A. (AKO.B), and Suntory Beverage & Food Ltd (STBFY) — they have better POWR Ratings.
What To Do Next?
Discover 10 widely held stocks that our proprietary model shows have tremendous downside potential. Please make sure none of these “death trap” stocks are lurking in your portfolio:
Want More Great Investing Ideas?
STZ shares were unchanged in premarket trading Monday. Year-to-date, STZ has gained 10.19%, versus a 15.54% rise in the benchmark S&P 500 index during the same period.
About the Author: Subhasree Kar

Subhasree’s keen interest in financial instruments led her to pursue a career as an investment analyst. After earning a Master’s degree in Economics, she gained knowledge of equity research and portfolio management at Finlatics. More...
More Resources for the Stocks in this Article
| Ticker | POWR Rating | Industry Rank | Rank in Industry |
| STZ | Get Rating | Get Rating | Get Rating |
| COKE | Get Rating | Get Rating | Get Rating |
| AKO.B | Get Rating | Get Rating | Get Rating |
| STBFY | Get Rating | Get Rating | Get Rating |