

Calgary, Canada-based integrated energy company Suncor Energy Inc. (SU - Get Rating) is set to report its third-quarter results on November 8. The company has come under fire after a statement raised concerns that the company is backtracking from its climate pledges. However, the company has reiterated its net-zero emission goal by 2050.
Last month, SU announced it would acquire French energy company TotalEnergies SE’s (TTE - Get Rating) Canadian operations for C$1.47 billion ($1.07 billion). This is expected to bolster the company’s bitumen production capacity.
Amid this, let’s look at the trends of SU’s key financial metrics to understand why it could be wise to watch and wait for a better entry point in the stock.
Exploring Suncor Energy Inc.’s Financial Performance from 2020 to 2023: A Comprehensive Analysis
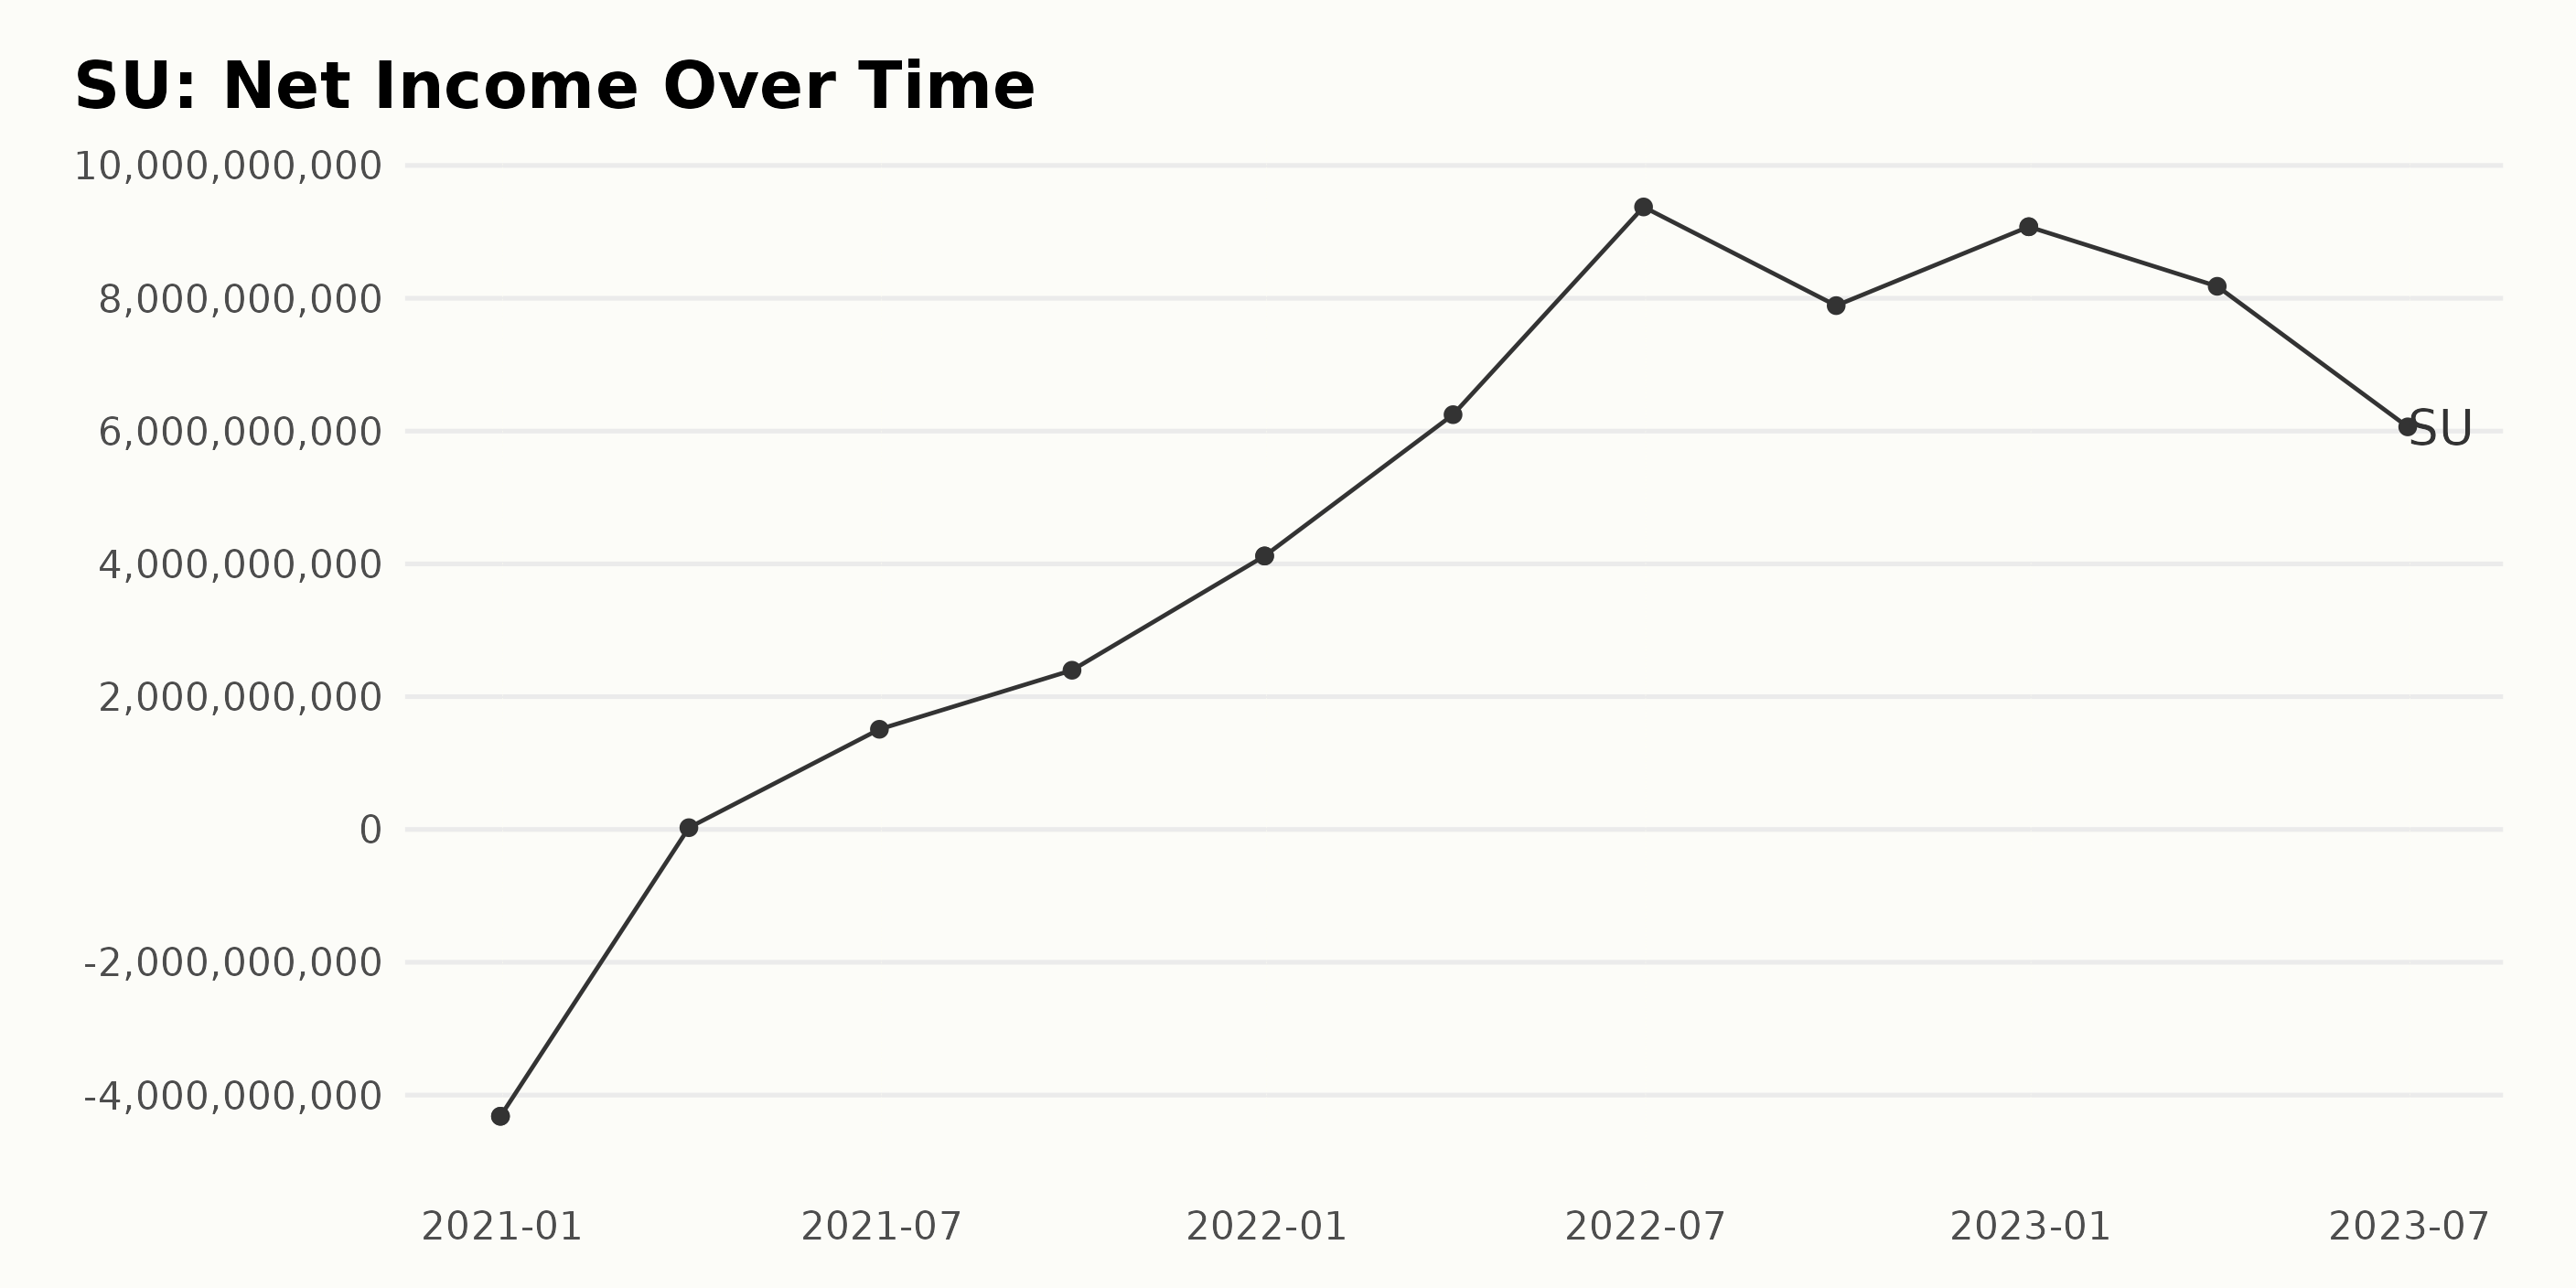
In examining the trailing-12-month net income for SU, a few key points come to light:
- At the end of 2020, SU reported a substantial net loss with a net income of -$4.32 billion.
- By March 31, 2021, there was a stabilization, and a positive trend started with the Net Income reporting at $27 million.
- A significant increase by June 30, 2021, was noticed as SU’s net income rocketed to $1.51 billion.
- This positive trend continued, leading into 2022, with figures hitting as high as $9.38 billion by June 30, 2022.
- Despite a slight dip in the third quarter of 2022 to $7.89 billion, SU concluded the year on a high note with a net income of $9.08 billion.
- Interestingly, the data shows a subsequent decline over the first half of 2023, sliding from $8.18 billion in the first quarter to $6.06 billion by June 30, 2023.
Overall, the financial health of SU has shown meaningful growth between 2020 and 2023. The net income rose from -$4.32 billion at the end of 2020 to $6.06 billion in June 2023, representing a strong rebound following the significant loss reported in 2020. However, growth has decelerated in the first half of 2023 relative to the rapid increase from 2021 through 2022.
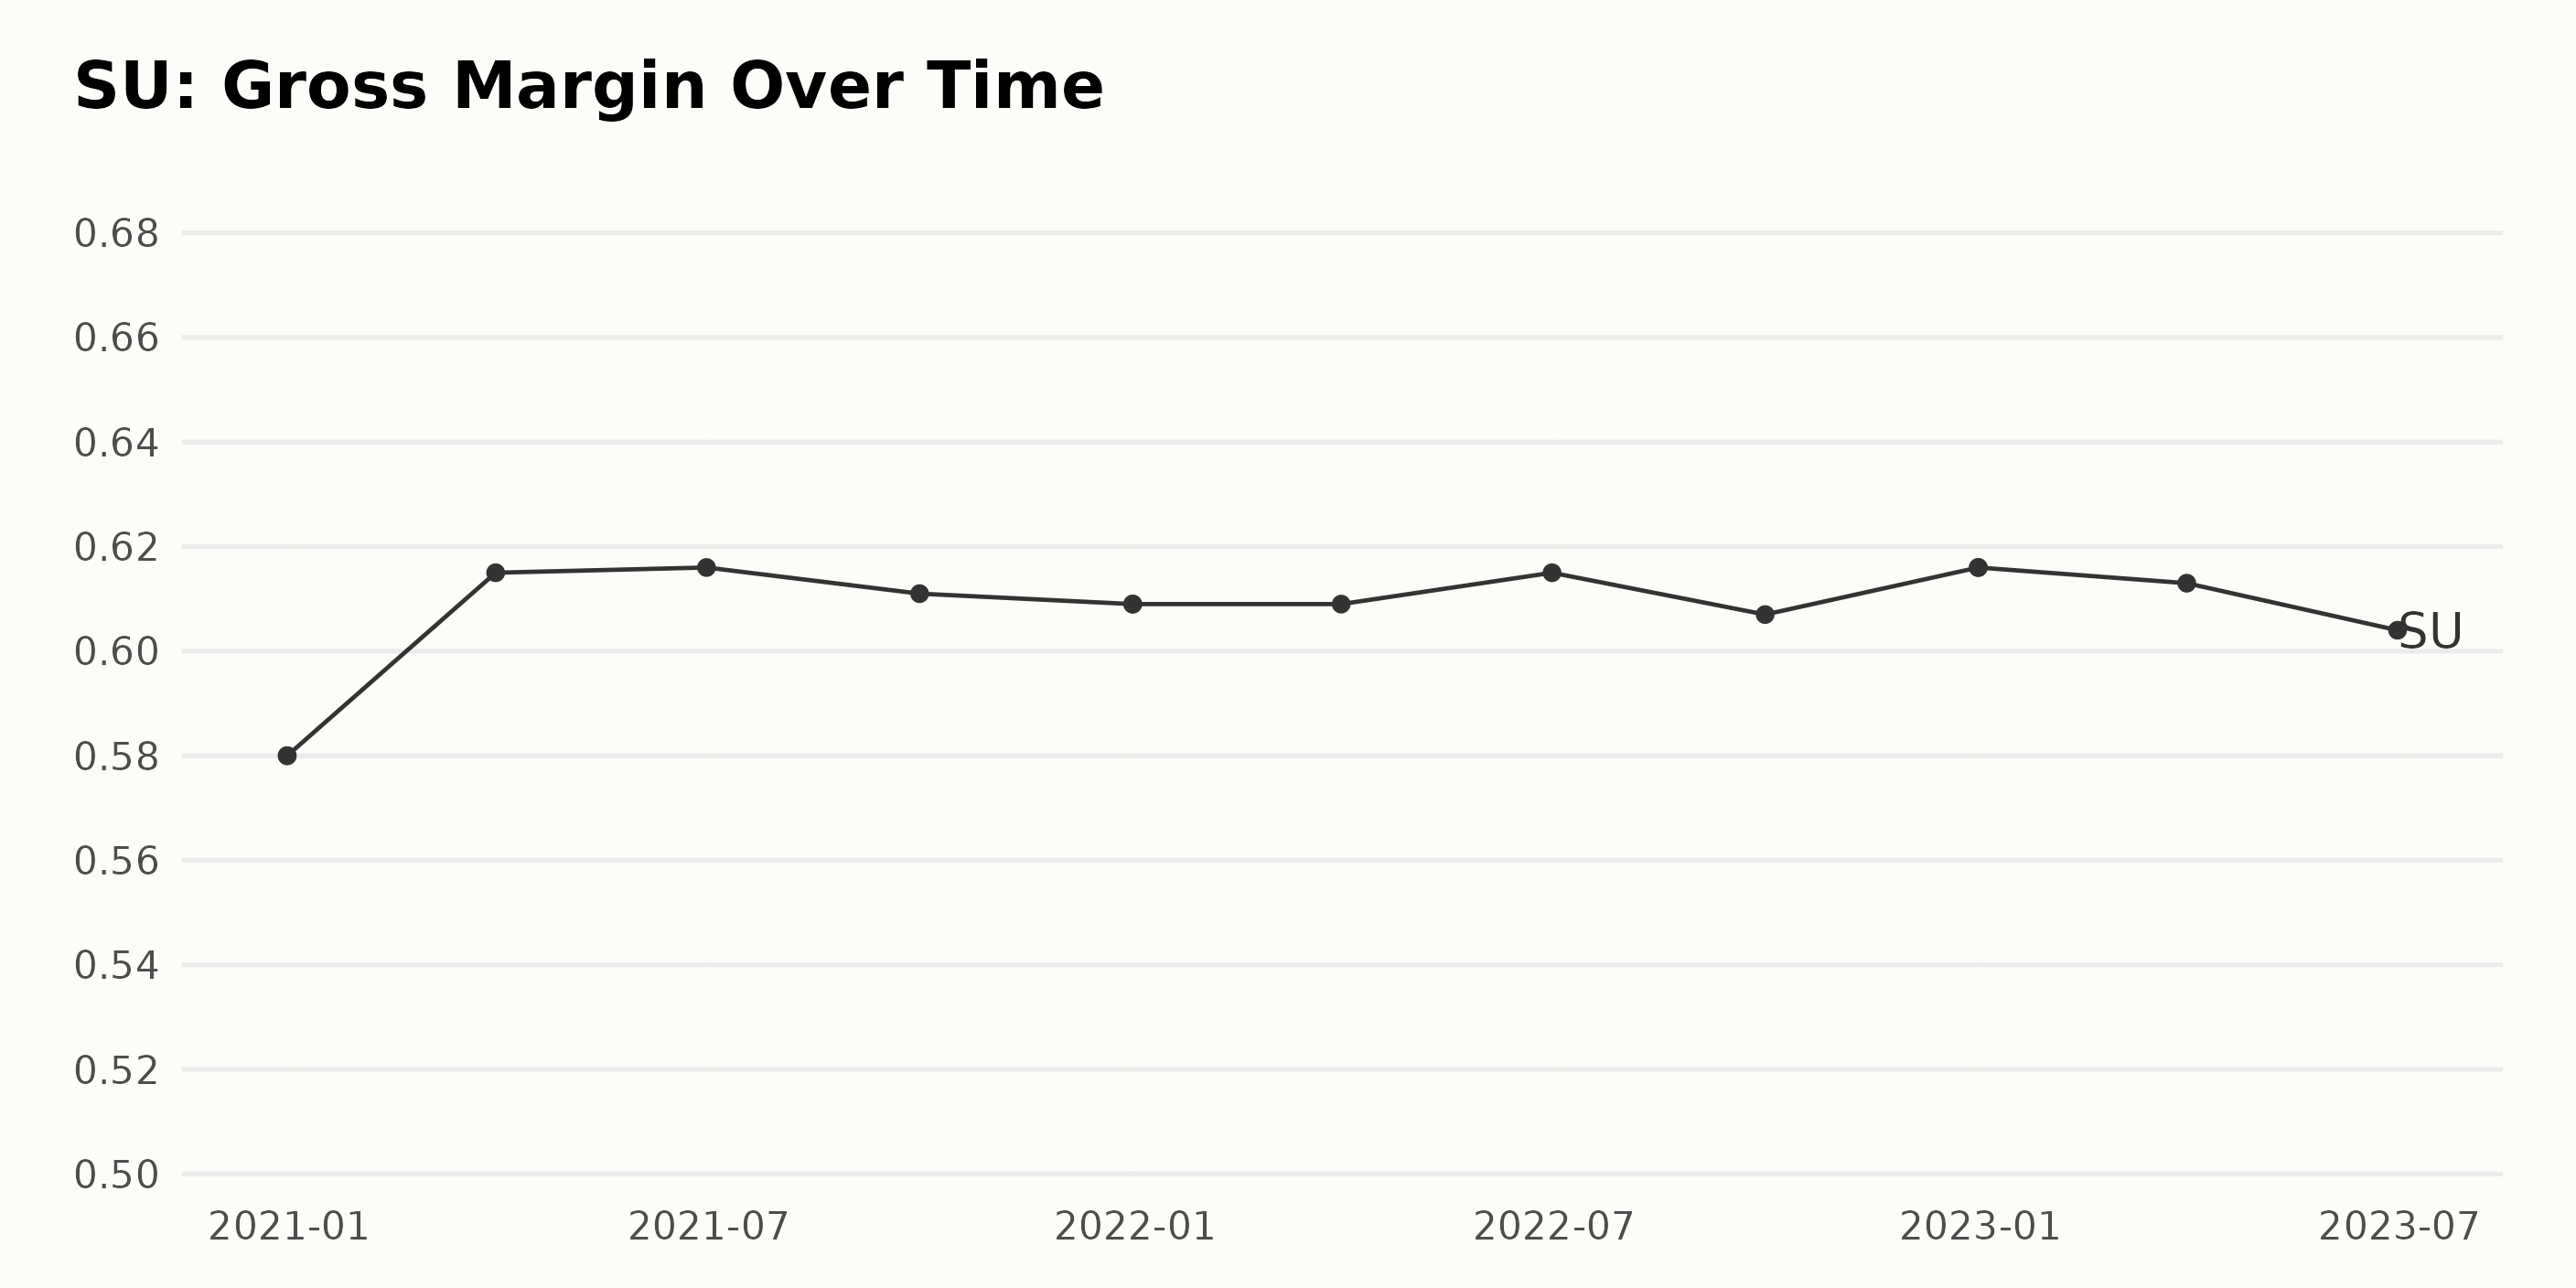
The gross margin of SU has seen moderate fluctuations over the reported period between late 2020 and mid-2023. Here are the key points:
- In December 2020, SU reported a gross margin of 58.00%.
- The company saw an increase in gross margin to 61.50% by the end of the first quarter of 2021.
- Over the year 2021, slight fluctuations were present, ranging between 60.90% to 61.60%.
- By December 2021, the gross margin perceivably decreased to 60.90% but rebounded to 61.50% in June 2022.
- The gross margin then dipped to 60.70% by September 2022 but rose again to 61.60% by the close of the year.
- In the subsequent quarters of 2023, a general downward trend was observed, ending with a gross margin of 60.40% by June 2023.
Over the whole period, from December 2020 to June 2023, SU witnessed an increase in its Gross Margin from 58.00% to 60.40%, indicating a small growth rate over these years. Despite moderate short-term fluctuations, the long-term trend shows a slightly upward trajectory when considering the first data point and the last.
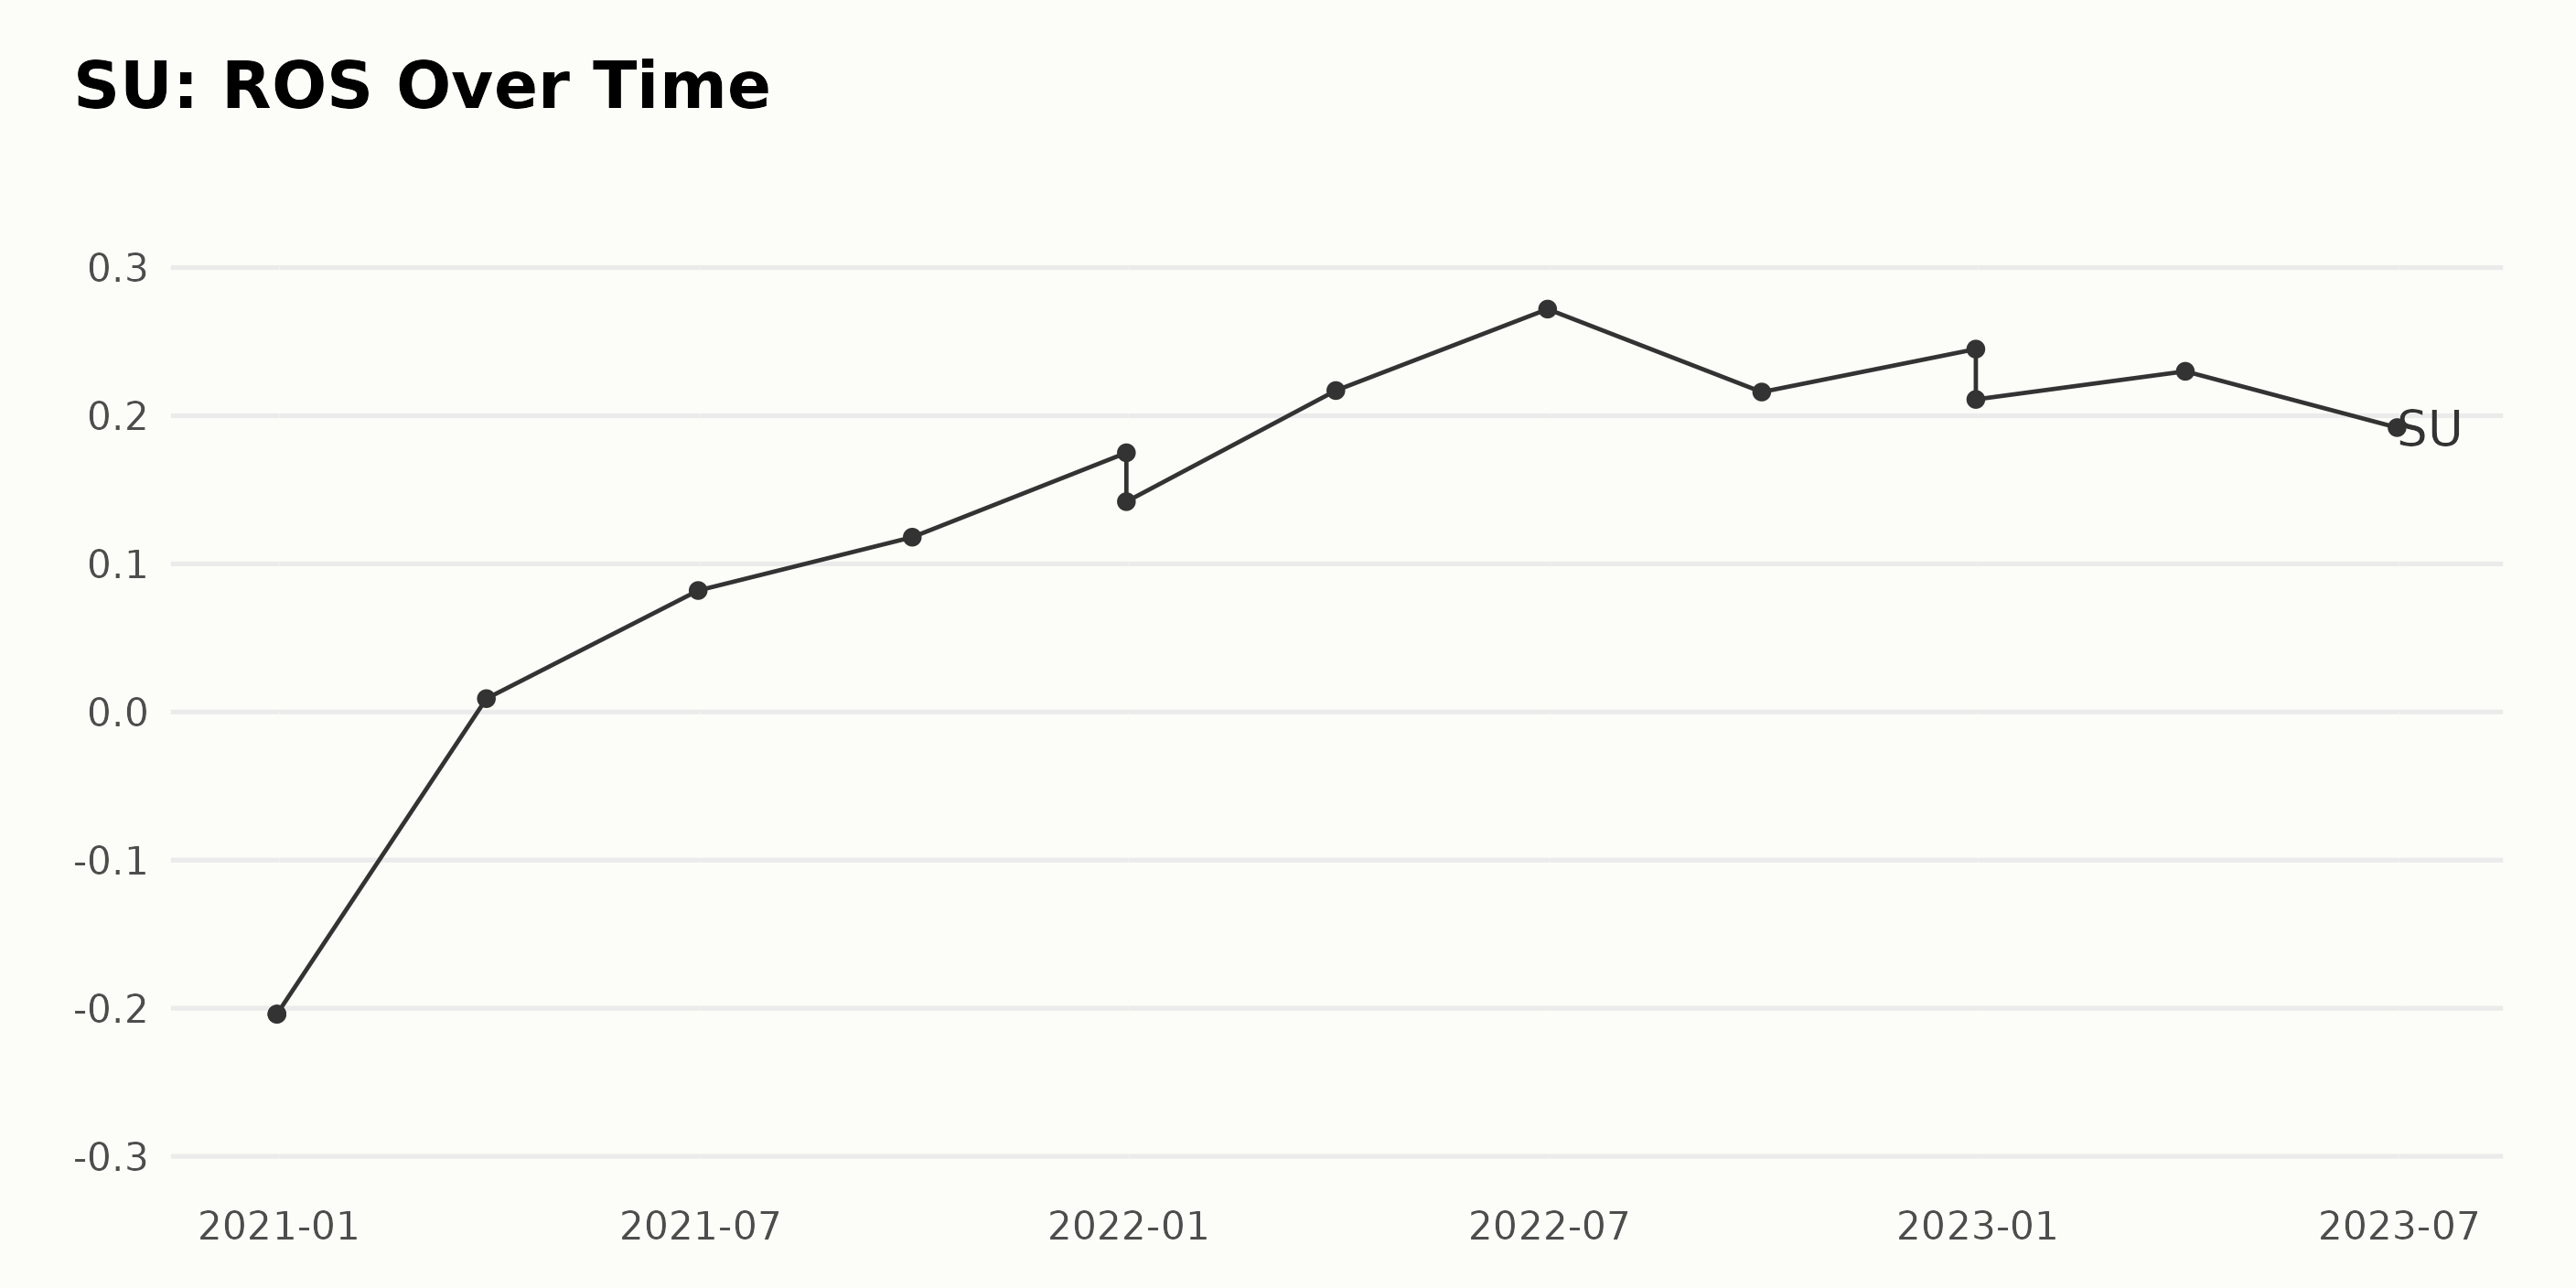
An analysis of SU’s Return On Sales (ROS) shows a significant fluctuation from the values given in the data series. The following points outline the change and trends:
- On December 31, 2020, the ROS was -0.20, indicating that the company was not profitable at this time.
- A positive turn occurred on March 31, 2021, when the ROS rose to 0.01. This rise continued, and by June 30, 2021, the ROS had increased to 0.08. It continued improving and reached 0.12 by the end of September 2021.
- For the rest of 2021, the ROS experienced minor fluctuations but remained generally positive. It stood at 0.18 on December 31, 2021.
- There was growth throughout the first half of 2022, with the ROS peaking at 0.27 on June 30, 2022. This fell slightly to 0.22 by the end of September 2022 and finished the year with a ROS of 0.21 on December 31, 2022.
- The ROS was relatively stable in the first half of 2023, with recorded values of 0.23 and 0.19 for the first and second quarters, respectively.
Overall, from the period December 2020 to June 2023, SU noted an improvement in its ROS from -0.20 to 0.19. Therefore, there is a total increase of approximately 0.39, or a 195% increase, when measuring the last value from the first.
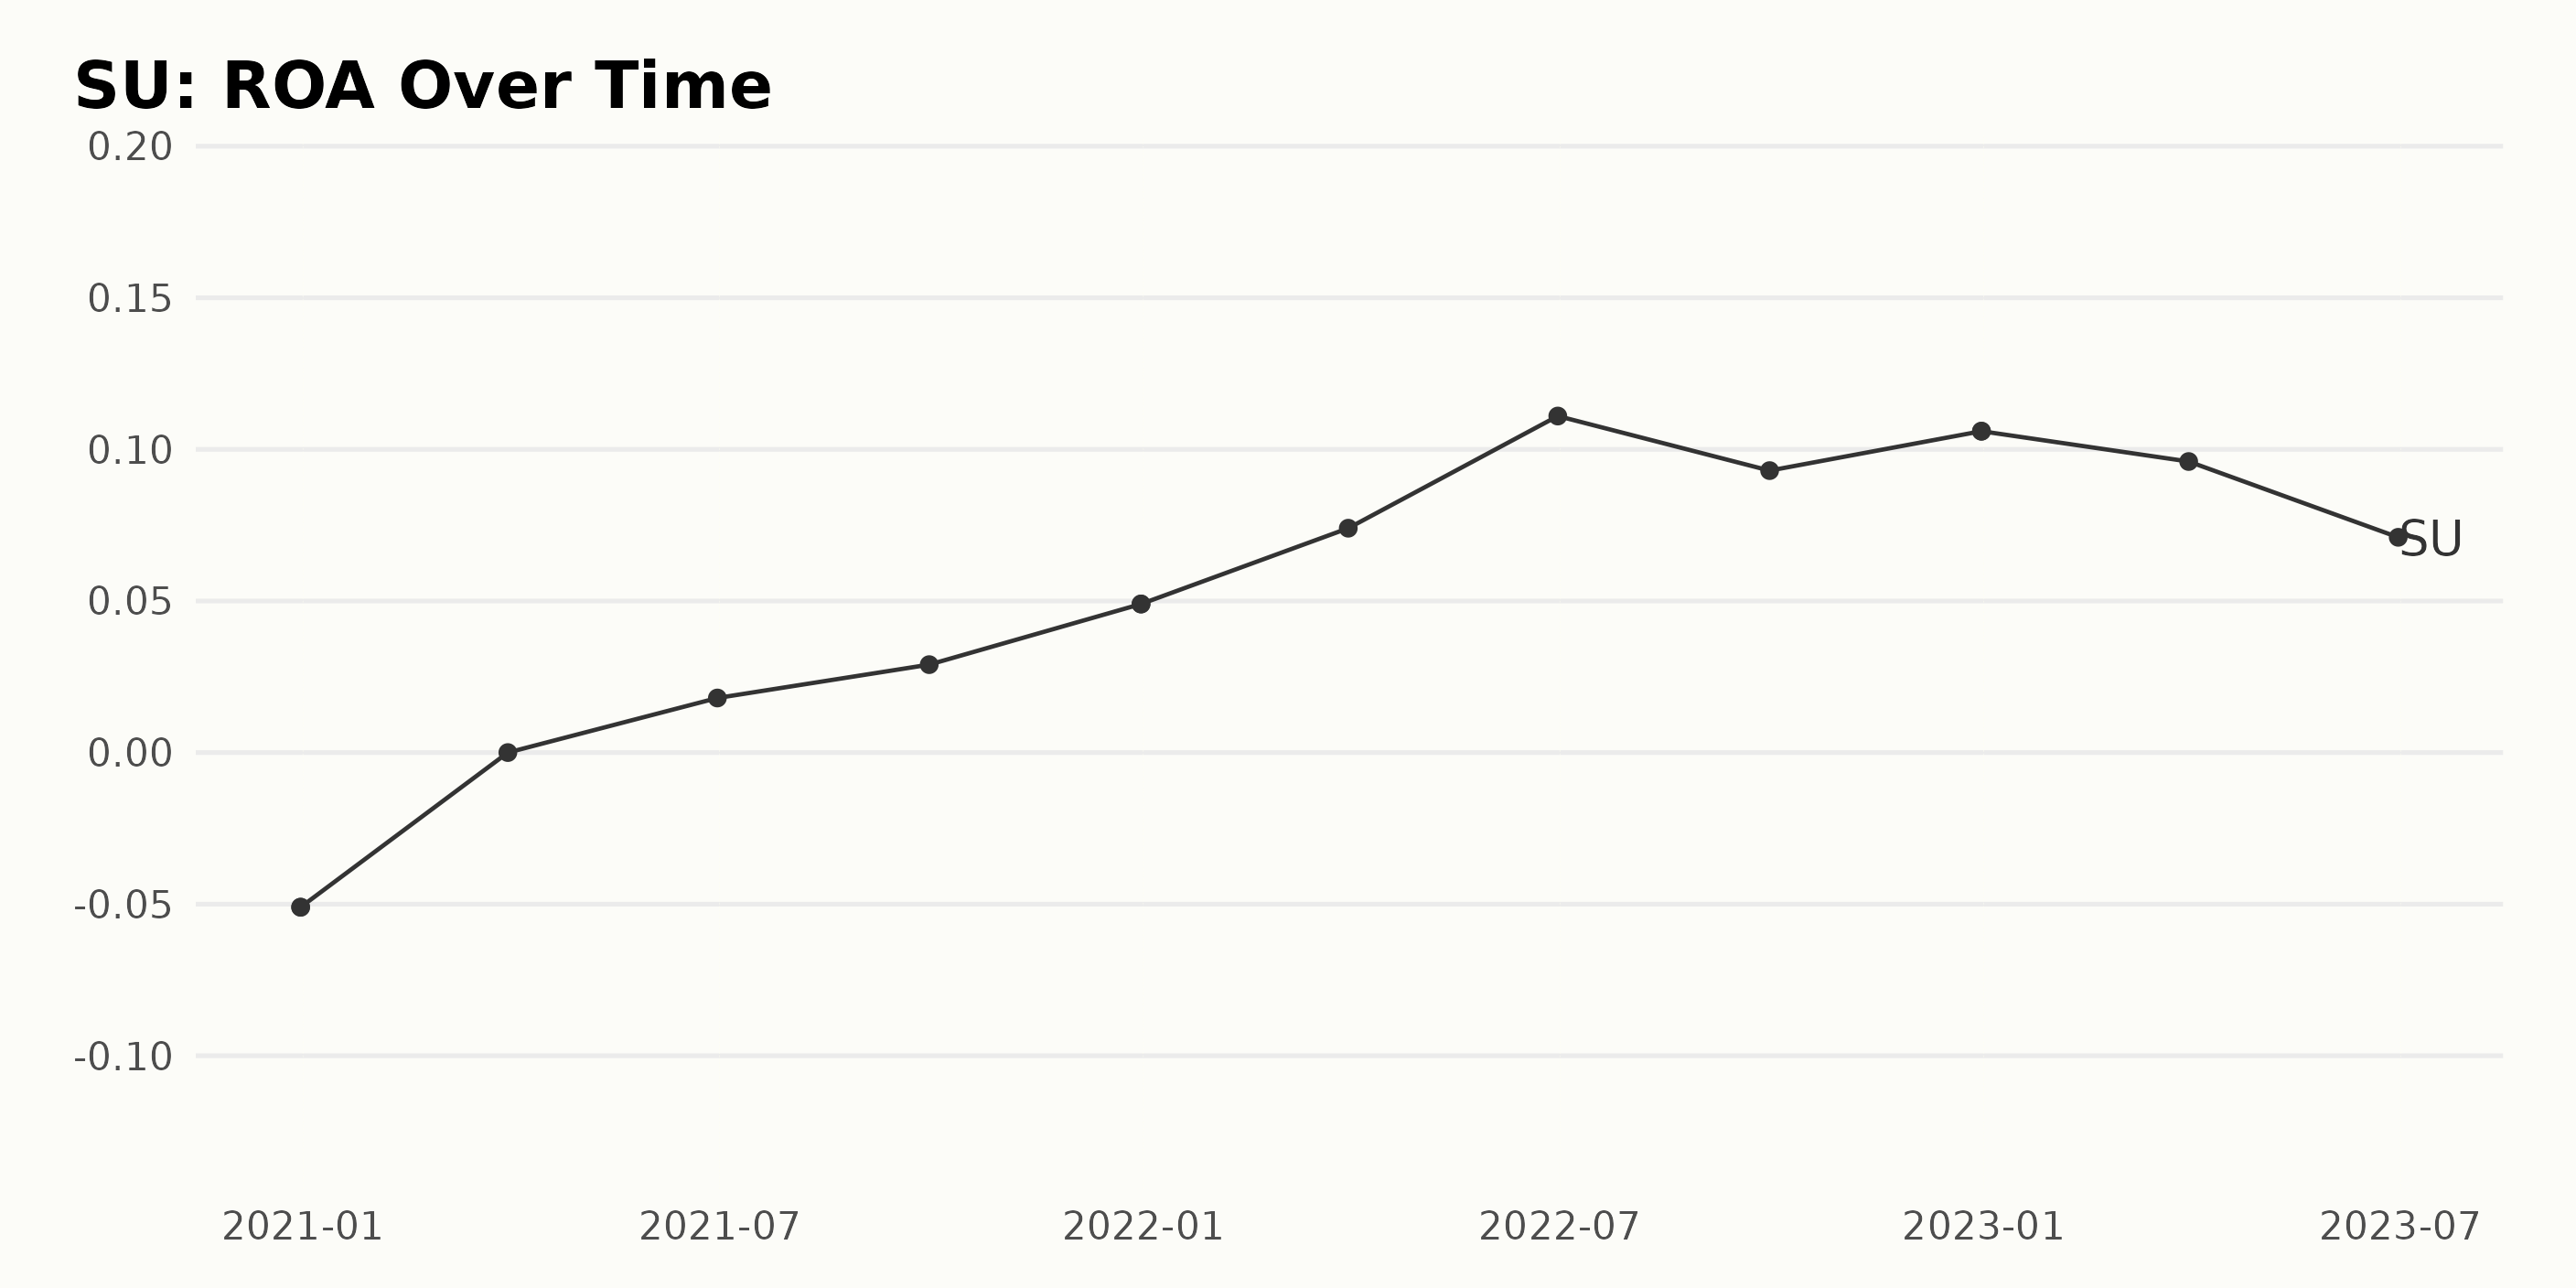
The Return On Assets (ROA) of SU exhibited considerable fluctuations during the period from December 2020 to June 2023.
- December 2020: The ROA was -0.051, implying that the company was struggling with profitability in 2020 during the year’s end.
- March 2021: The ROA improvement up to 0, symbolizing a recovery from negative returns.
- June 2021: The ROA reached 0.018, indicating a positive yet slight growth compared to March 2021.
- December 2021: Notable progress was evident by the year’s end, with the ROA achieving 0.049.
- June 2022: A significant increase in ROA at 0.111 was observed by mid-2022, which signified a substantial uplift in the company’s profitability.
- September 2022: A brief dip in the ROA to 0.093 followed this substantial growth.
- December 2022: By the end of 2022, the ROA had rebounded slightly to 0.106.
- June 2023: From this point onward, ROA began to decrease, maintaining a value of 0.071 as of June 2023.
Overall, despite initial losses and ongoing fluctuations, SU’s ROA presented an upward trend from -0.051 in December 2020 to 0.071 in June 2023. This amounts to a positive growth rate over this period. More recent data, from 2022 onwards, maintains a greater emphasis and reveals ongoing fluctuations but an overall positive trajectory.
Tracking Suncor Energy’s Share Price: A Six-Month Trend Analysis (May-November 2023)
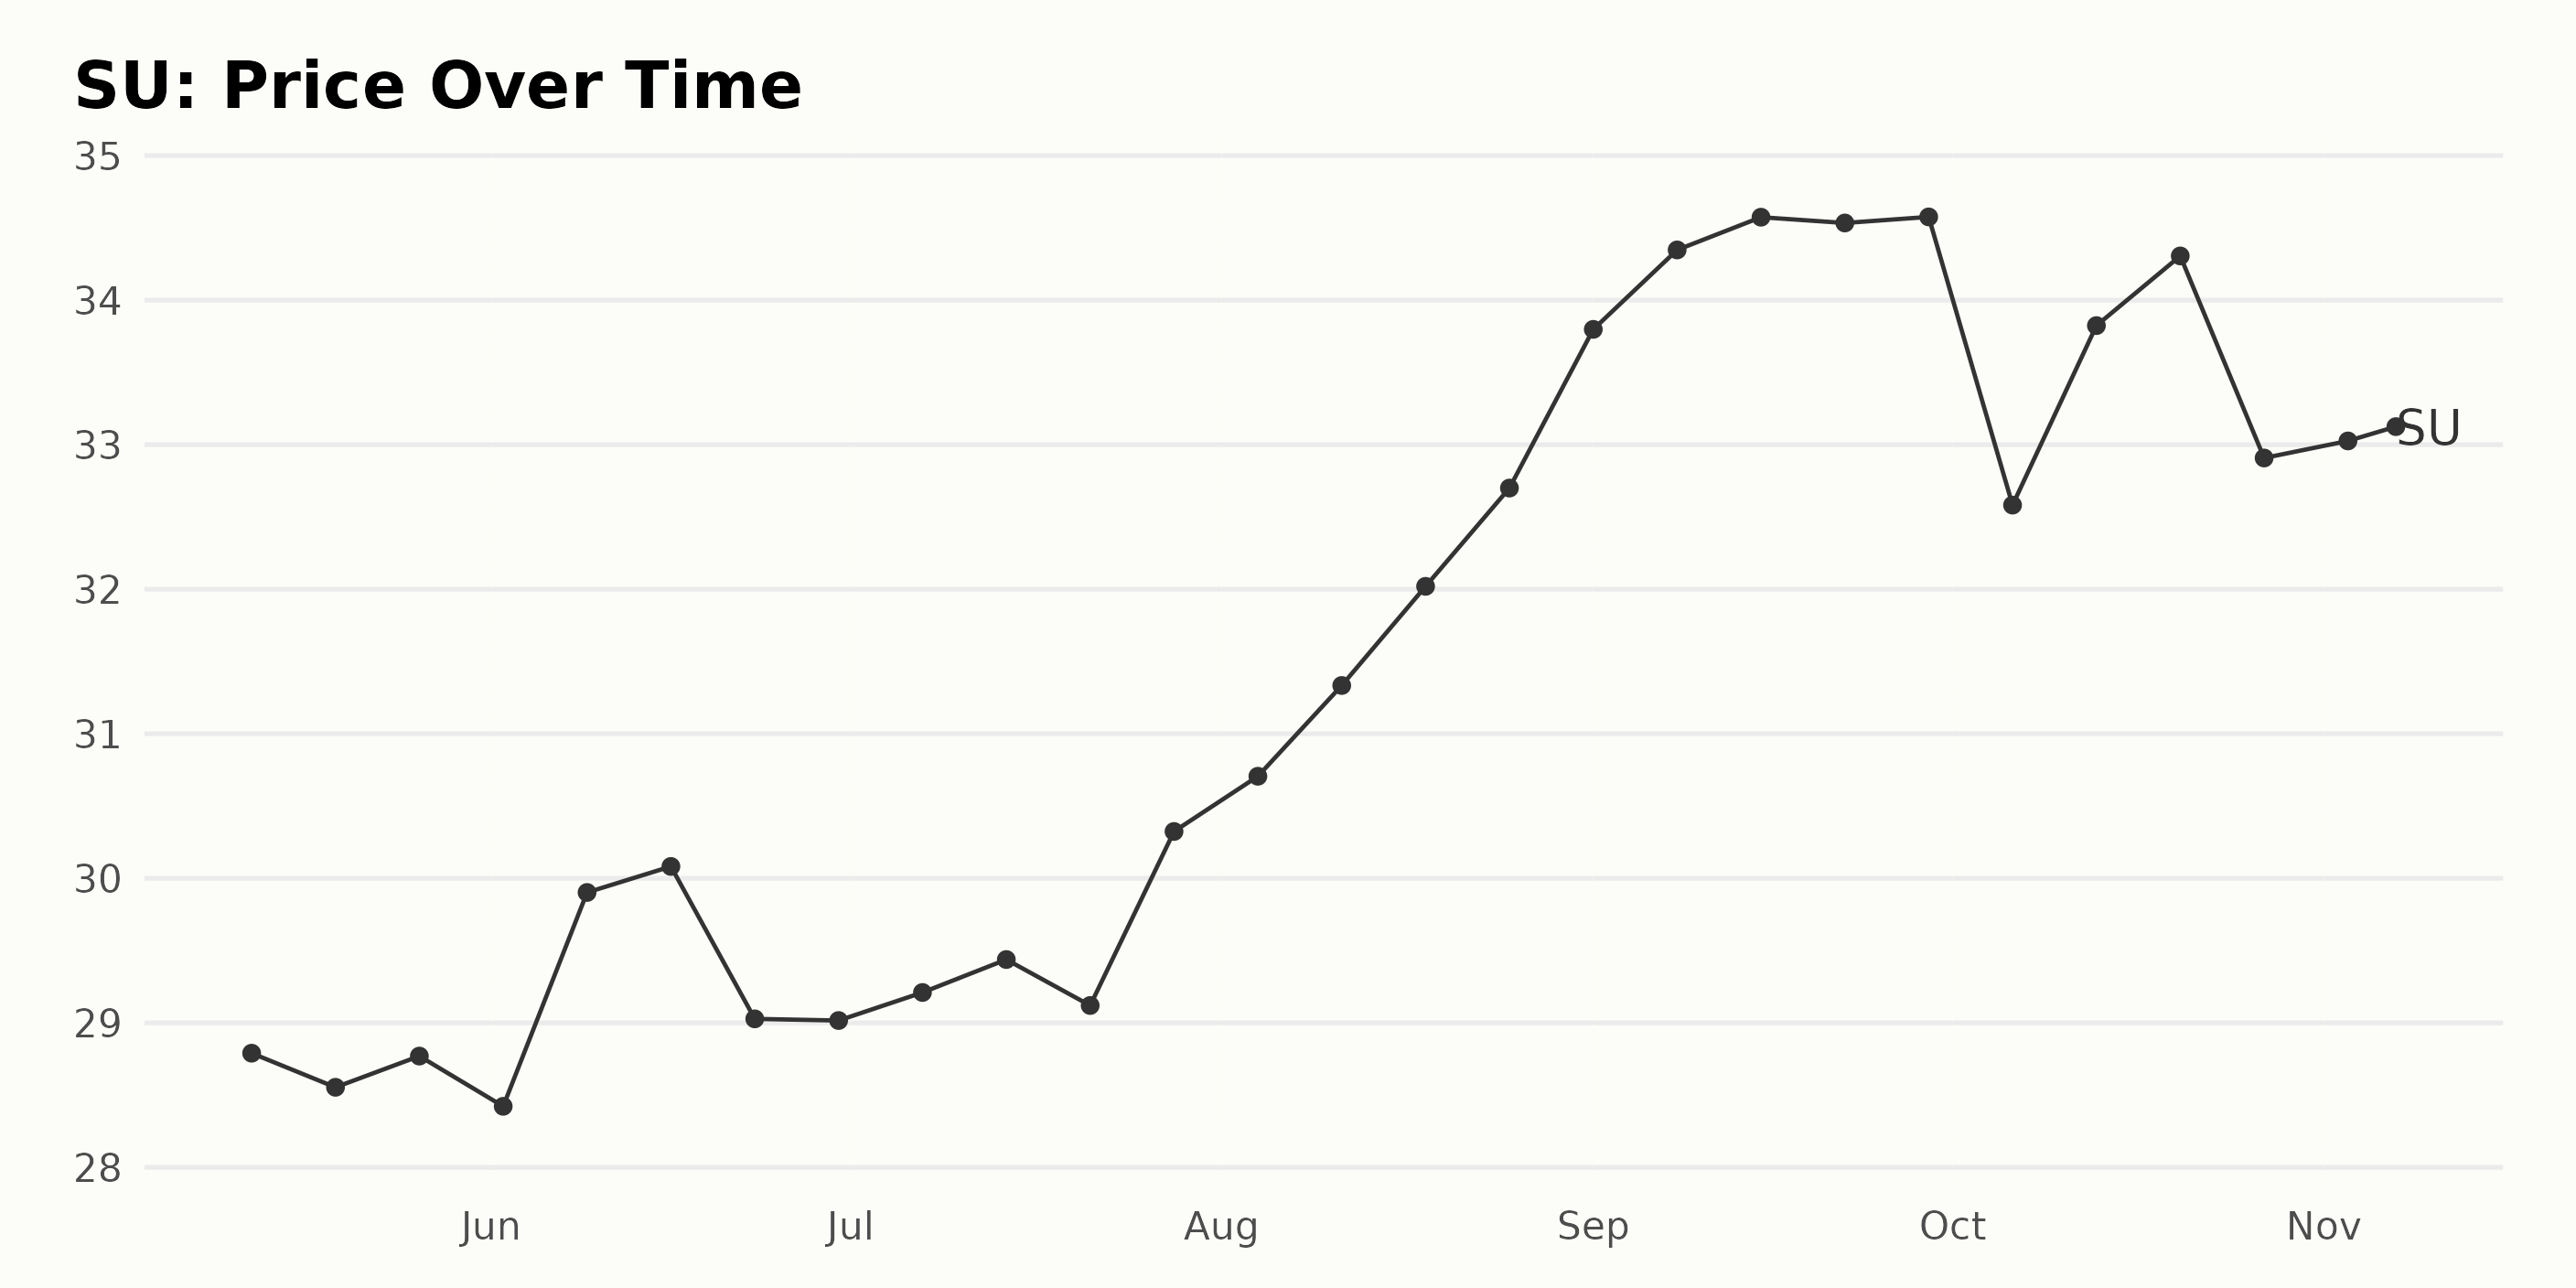
The data provided above shows a relatively clear trend in the price of shares for SU from May 2023 to November 2023.
- On May 12, 2023, SU’s share price was $28.79.
- Over the rest of May, the share price slightly varied, ending at $28.77 as of May 26, 2023.
- From June to mid-July 2023, we see a mixture of slight rises and falls, generally leading to an increase by mid-July. SU’s share price reached a value of $29.44 on July 14, 2023.
- By the end of August, there is a clear upward growth, peaking at $32.70 on August 25, 2023.
- The upward trend continued into September with some fluctuations, achieving the highest value of $34.58 by the end of the month.
- There was a notable dip around October 6, 2023, when the share price went down to $32.58, but it recovered to $34.31 by October 20, 2023.
- The data ends in November with minor oscillations, with the share price value noted as $32.06 on November 7, 2023.
In summary, the overall trend for the given period shows a positive growth rate with sporadic dips and declines. The data reflects a slow initial growth, followed by a more rapid increase from late July to September 2023, touching its peak.
There is a clearly noticeable decline in October, which leads to minor variations through November 2023. This suggests an accelerating growth trend through late summer followed by a decelerating trend entering autumn. Here is a chart of SU’s price over the past 180 days.
Analyzing Suncor Energy’s Strength in Momentum, Quality, and Improving Growth
Based on the data, SU, a stock in the Energy – Oil & Gas category, currently holds a POWR Ratings Grade of C (Neutral). This grade reflects the overall assessment and performance of the stock. Here are some key points from the data:
- The latest value of POWR Grade for SU is C (Neutral) as of November 8, 2023.
- SU has shown varying positions within its category, ranking anywhere between #21 and #49 among the 85 total stocks.
- As of the last available date, SU’s rank in its category is #24. This implies a decent performance within its sector.
SU maintained a consistent POWR Grade of C (Neutral) throughout the referenced period from May 13, 2023, to November 8, 2023. To summarize:
- POWR Grade: C (Neutral)
- Latest Value Date: November 8, 2023
- Rank in Category (latest): #24 out of 85
- Stock Category: Energy – Oil & Gas
It’s important to keep monitoring these values to track SU’s progress and performance.
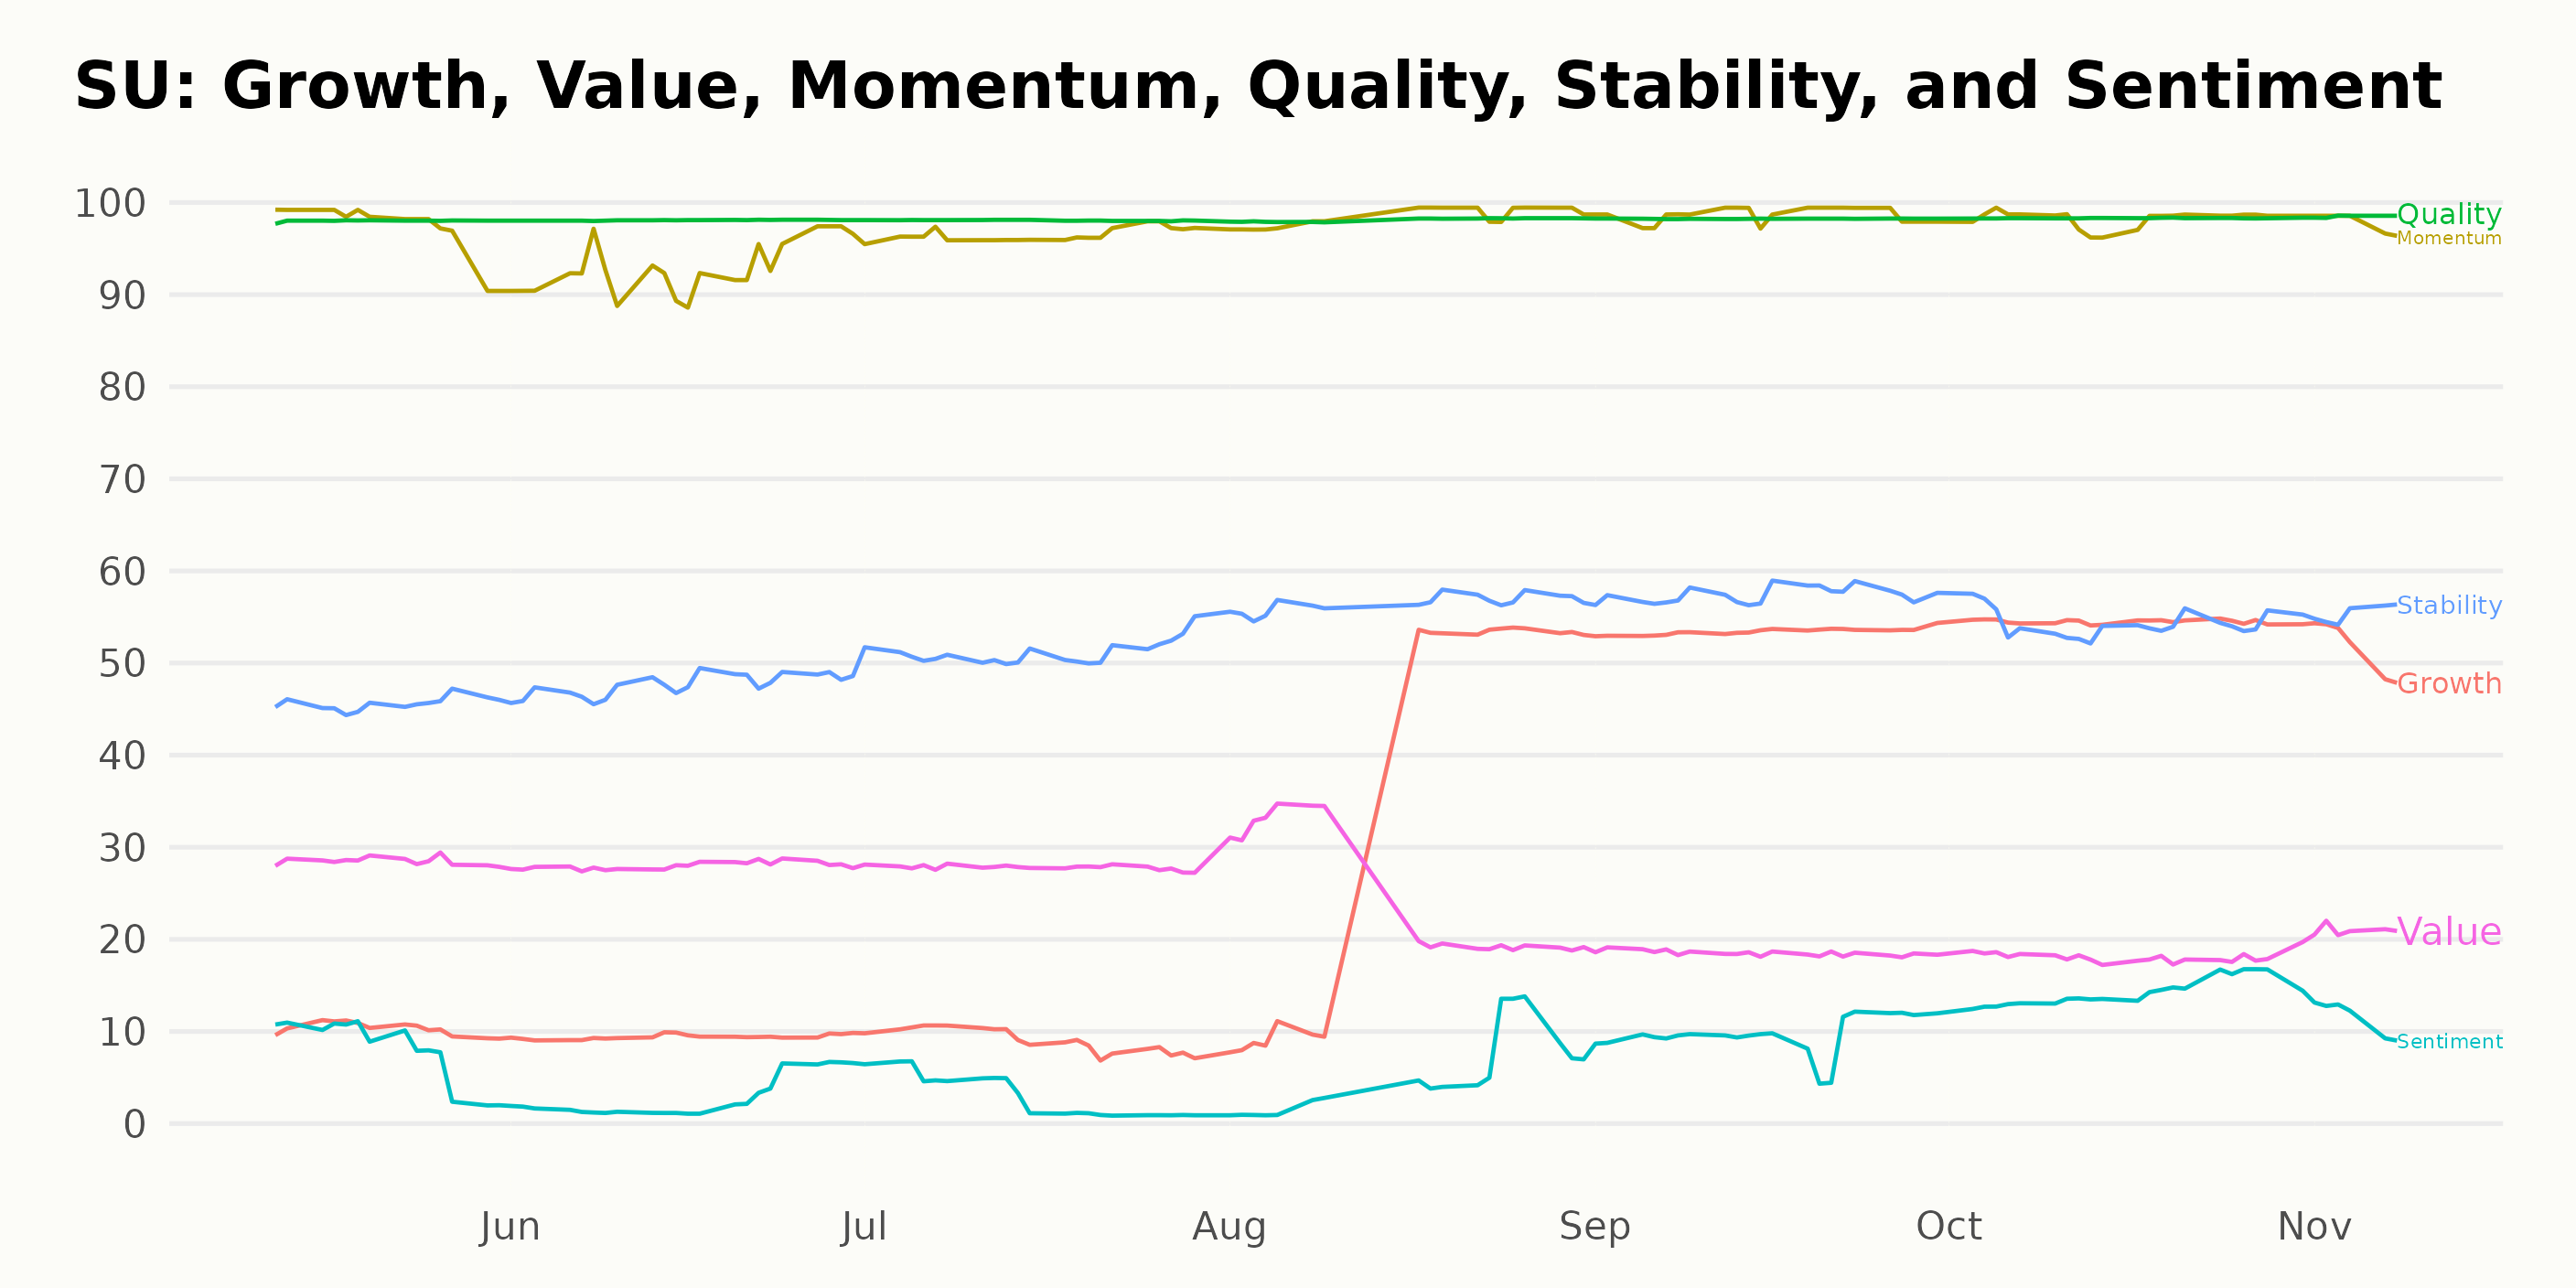
Based on the provided data, the three most noteworthy dimensions for SU according to the POWR Ratings are Momentum, Quality, and Growth. These dimensions consistently exhibit the highest ratings over time.
Momentum: The Momentum dimension appears to be highly rated consistently, staying notably stable throughout the year. Ratings ranged as high as 97 in May 2023 and reached a peak of 99 in September 2023. This persistent high evaluation suggests a steady and robust momentum for Suncor Energy Inc.
Quality: Similarly, the Quality dimension has consistently maintained a sky-high rating of 98 throughout the reviewed period. This constant value indicates that SU’s quality factor has been steadfastly high over this time, implying strong quality controls and procedures within the organization.
Growth: The Growth dimension showed a striking trend. In May 2023, it started with a low score of just 10. However, it steadily improved over time, reaching 36 by August 2023. This performance then surged, hitting ratings of 53 and 54 in September and October 2023, respectively. Afterward, a slight decrease to 52 was observed in November 2023. The substantial increase in the Growth rating signifies a notable positive development in this aspect over the observed period.
In summary, Momentum and Quality maintained consistently high ratings, demonstrating areas of strength for SU. On the other hand, the Growth dimension showcases significant improvement over time, indicating potential continued enhancement in the company’s performance.
How does Suncor Energy Inc. (SU) Stack Up Against its Peers?
Other stocks in the Energy – Oil & Gas sector that may be worth considering are TotalEnergies SE (TTE - Get Rating), Cheniere Energy, Inc. (LNG - Get Rating), and Weatherford International plc (WFRD - Get Rating) – they have better POWR Ratings. Click here to see more Energy – Oil & Gas stocks.
What To Do Next?
Discover 10 widely held stocks that our proprietary model shows have tremendous downside potential. Please make sure none of these “death trap” stocks are lurking in your portfolio:
Want More Great Investing Ideas?
SU shares were trading at $31.25 per share on Wednesday afternoon, down $0.81 (-2.53%). Year-to-date, SU has gained 2.09%, versus a 15.20% rise in the benchmark S&P 500 index during the same period.
About the Author: Anushka Dutta

Anushka is an analyst whose interest in understanding the impact of broader economic changes on financial markets motivated her to pursue a career in investment research. More...
More Resources for the Stocks in this Article
| Ticker | POWR Rating | Industry Rank | Rank in Industry |
| SU | Get Rating | Get Rating | Get Rating |
| TTE | Get Rating | Get Rating | Get Rating |
| LNG | Get Rating | Get Rating | Get Rating |
| WFRD | Get Rating | Get Rating | Get Rating |


