Correction is less frequent, with there having been just 25 of them since 1950 according to Yardeni Research. On average corrections take about three months to bottom and see stocks fall 12% at their peak. It then takes about four months for the market to return to new all-time highs.
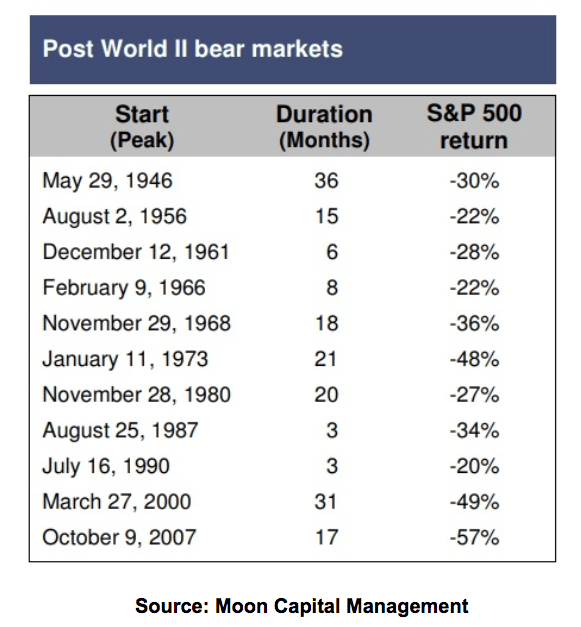
Bear markets are the rarest, there have been just 11 of them since WWII. On average they occur every 6.5 years and see stocks decline 33%. The median time it takes for stocks to recover to new highs is 15 months, though it can take as long as 69 months (1973).
Ok, but how do we know if this is a bear market or just a regular correction? Should we be “greedy when others are fearful” when stocks hit -10% (as they recently did) or hold on for even steeper declines? To answer that it’s important to know the biggest fundamental difference between corrections (and pullbacks) and bear markets.
- Pullback/correction are risk-based
- Bear markets are fundamentals based
There are always risks to investing (and life in general). Risks are merely things that could go wrong to derail positive fundamentals that drive stocks up over time. These include a growing economy and rising corporate earnings. Bull markets (and economic expansions) don’t die of old age, something (sharp negative shock) has to kill them.
A pullback/correction can occur at any time, for any reason. They are triggered by some combination of factors, usually short-term surprises that suddenly spook investors into “risk off mode”. For example, in February it was a sharp spike in 10-year yields caused by unexpectedly strong wage growth from the February Jobs report that caused investors to realize that valuations had become too high.
Specifically after a freakishly low volatility year in 2017 (stocks rose 20% without ever falling even 3% from all-time highs), and a continued melt up in January the S&P 500’s trailing 12 month PE (from continuing operations) hit 23.3. That’s compared to an average of 17 since 1960. The interest rate spike induced correction then took on a life of its own (fear of further selling became a self-fulfilling prophecy) and ultimately stocks bottomed after a 10.2% decline. It then took about five months for stocks to recover to fresh all-time highs (slightly longer than average).
This most recent correction has now seen the S&P 500’s trailing PE fall to 18.5 (down 20% since January), and on a forward basis to just 14.5. This actually indicates that based on the expected earnings growth of the next 12 months stocks are very attractively priced.
About the Author:

9 "Must Own" Growth Stocks For 2019
Get Free Updates
Join thousands of investors who get the latest news, insights and top rated picks from StockNews.com!
Top Stories on StockNews.com
Best & Worst Performing Stock Industries for April 25, 2024
Led by ticker KGJI, "Fashion & Luxury" was our best performing stock industry of the day, with a 1,298.35% gain.
Best & Worst Performing Mid Cap Stocks for April 25, 2024
ISMAY leads the way today as the best performing mid cap stock, closing up 21.21%.
Best & Worst Performing Small Cap Stocks for April 25, 2024
KGJI leads the way today as the best performing small cap stock, closing up 100,000.00%.
Best & Worst Performing Mega Cap Stocks for April 25, 2024
TSLA leads the way today as the best performing mega cap stock, closing up 12.06%.