American Financial Group, Inc. (AFG): Price and Financial Metrics
AFG Price/Volume Stats
Current price | $113.30 | 52-week high | $150.98 |
Prev. close | $113.38 | 52-week low | $108.58 |
Day low | $113.17 | Volume | 192,200 |
Day high | $114.05 | Avg. volume | 364,527 |
50-day MA | $115.34 | Dividend yield | 2.2% |
200-day MA | $123.21 | Market Cap | 9.62B |
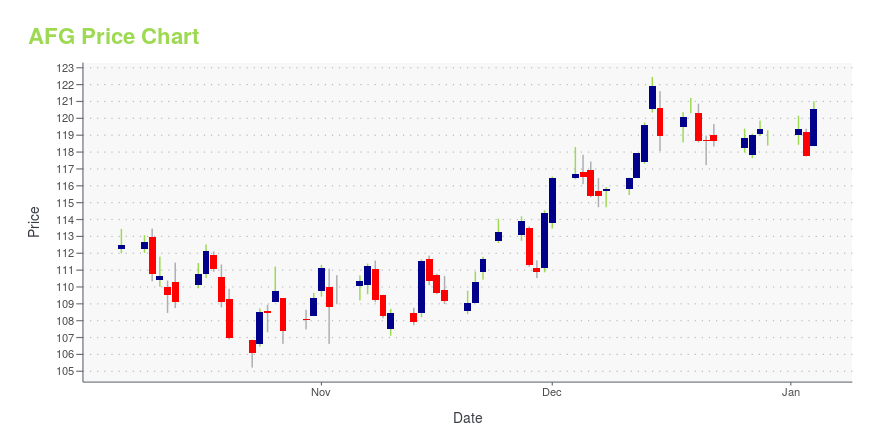
AFG Stock Price Chart Interactive Chart >
AFG POWR Grades
- Momentum is the dimension where AFG ranks best; there it ranks ahead of 94.58% of US stocks.
- AFG's strongest trending metric is Growth; it's been moving up over the last 179 days.
- AFG's current lowest rank is in the Sentiment metric (where it is better than 21.87% of US stocks).
AFG Stock Summary
- AFG has a market capitalization of $9,631,175,638 -- more than approximately 83.76% of US stocks.
- AMERICAN FINANCIAL GROUP INC's stock had its IPO on January 1, 1986, making it an older stock than 93.16% of US equities in our set.
- AFG's equity multiplier -- a measure of assets relative to shareholders'equity -- is greater than that of 84.35% of US stocks.
- Stocks that are quantitatively similar to AFG, based on their financial statements, market capitalization, and price volatility, are UNM, WRK, WHR, TUSK, and CBRL.
- Visit AFG's SEC page to see the company's official filings. To visit the company's web site, go to www.afginc.com.
AFG Valuation Summary
- AFG's price/sales ratio is 1.3; this is 43.48% lower than that of the median Financial Services stock.
- Over the past 243 months, AFG's price/earnings ratio has gone down 6.8.
Below are key valuation metrics over time for AFG.
Stock | Date | P/S | P/B | P/E | EV/EBIT |
---|---|---|---|---|---|
AFG | 2023-09-15 | 1.3 | 2.4 | 11.3 | 8.8 |
AFG | 2023-09-14 | 1.3 | 2.4 | 11.3 | 8.8 |
AFG | 2023-09-13 | 1.3 | 2.4 | 11.1 | 8.6 |
AFG | 2023-09-12 | 1.3 | 2.4 | 11.1 | 8.6 |
AFG | 2023-09-11 | 1.2 | 2.3 | 10.8 | 8.4 |
AFG | 2023-09-08 | 1.2 | 2.3 | 10.9 | 8.5 |
AFG Growth Metrics
- The 2 year price growth rate now stands at 126.94%.
- Its year over year price growth rate is now at 12.04%.
- The 4 year revenue growth rate now stands at 13.47%.

The table below shows AFG's growth in key financial areas (numbers in millions of US dollars).
Date | Revenue | Operating Cash Flow | Net Income to Common Stock |
---|---|---|---|
2022-12-31 | 7,040 | 1,153 | 898 |
2022-09-30 | 6,869 | 1,332 | 977 |
2022-06-30 | 6,639 | 1,258 | 1,031 |
2022-03-31 | 6,631 | 1,590 | 1,866 |
2021-12-31 | 6,552 | 1,714 | 1,995 |
2021-09-30 | 7,417 | 1,912 | 2,332 |
AFG's Quality Factors
The “Quality” component of the POWR Ratings focuses on 31 different factors of a companies fundamentals and operational strength. Here are some key insights as we drill into the specifics of these quality attributes.- AFG has a Quality Grade of C, ranking ahead of 57.76% of graded US stocks.
- AFG's asset turnover comes in at 0.124 -- ranking 105th of 133 Insurance stocks.
- L, ATH, and SIGI are the stocks whose asset turnover ratios are most correlated with AFG.
The table below shows AFG's key quality metrics over time.
Period | Asset Turnover | Gross Margin | ROIC |
---|---|---|---|
2021-06-30 | 0.124 | 0.323 | 0.043 |
2021-03-31 | 0.112 | 0.296 | 0.025 |
2020-12-31 | 0.111 | 0.230 | 0.013 |
2020-09-30 | 0.105 | 0.163 | 0.005 |
2020-06-30 | 0.108 | 0.160 | 0.006 |
2020-03-31 | 0.109 | 0.175 | 0.006 |
AFG Price Target
For more insight on analysts targets of AFG, see our AFG price target page. And for a list of of all stocks sorted by upside potential based on analyst target price, see our Top Price Target page.
Average Price Target | $145.67 | Average Broker Recommendation | 1.6 (Moderate Buy) |
American Financial Group, Inc. (AFG) Company Bio
American Financial Group, Inc. provides property and casualty insurance products in the United States. It operates through four segments: Property and Casualty Insurance, Annuity, Run-Off Long-Term Care and Life, and Other. The company was founded in 1872 and is based in Cincinnati, Ohio.
Latest AFG News From Around the Web
Below are the latest news stories about AMERICAN FINANCIAL GROUP INC that investors may wish to consider to help them evaluate AFG as an investment opportunity.
W.R. Berkley (WRB) Board Approves Special Cash DividendBetter pricing, expansion of international business, reserving discipline, a solid balance sheet and prudent capital management policy should help W.R. Berkley (WRB) maintain the streak of paying special dividends. |
CNA or AFG: Which Property & Casualty Insurer Has an Edge?Let's see how CNA Financial (CNA) and American Financial (AFG) fare in terms of some of the key metrics. |
ProAssurance (PRA) Down 4.2% Since Last Earnings Report: Can It Rebound?ProAssurance (PRA) reported earnings 30 days ago. What's next for the stock? We take a look at earnings estimates for some clues. |
American Financial (AFG) Up 2.8% Since Last Earnings Report: Can It Continue?American Financial (AFG) reported earnings 30 days ago. What's next for the stock? We take a look at earnings estimates for some clues. |
Reasons Why Investors Should Retain American Financial (AFG)American Financial (AFG) stands to gain from rate increases, higher retentions in renewal business, a rise in average renewal pricing, stronger underwriting profit and improved guidance. |
AFG Price Returns
1-mo | -1.20% |
3-mo | -1.83% |
6-mo | -3.63% |
1-year | -2.17% |
3-year | 136.62% |
5-year | 46.47% |
YTD | -13.73% |
2022 | 10.91% |
2021 | 74.48% |
2020 | -16.18% |
2019 | 27.10% |
2018 | -13.04% |
AFG Dividends
Ex-Dividend Date | Type | Payout Amount | Change | ||||||
---|---|---|---|---|---|---|---|---|---|
Loading, please wait... |
Continue Researching AFG
Here are a few links from around the web to help you further your research on American Financial Group Inc's stock as an investment opportunity:American Financial Group Inc (AFG) Stock Price | Nasdaq
American Financial Group Inc (AFG) Stock Quote, History and News - Yahoo Finance
American Financial Group Inc (AFG) Stock Price and Basic Information | MarketWatch
Loading social stream, please wait...