B&G Foods, Inc. B&G Foods, Inc. (BGS): Price and Financial Metrics
GET POWR RATINGS... FREE!
BGS POWR Grades
- BGS scores best on the Growth dimension, with a Growth rank ahead of 88.01% of US stocks.
- The strongest trend for BGS is in Momentum, which has been heading up over the past 179 days.
- BGS ranks lowest in Sentiment; there it ranks in the 0th percentile.
BGS Stock Summary
- The ratio of debt to operating expenses for B&G Foods Inc is higher than it is for about 90.34% of US stocks.
- With a price/sales ratio of 0.93, B&G Foods Inc has a higher such ratio than merely 21.9% of stocks in our set.
- The volatility of B&G Foods Inc's share price is greater than that of only 11.67% US stocks with at least 200 days of trading history.
- Stocks that are quantitatively similar to BGS, based on their financial statements, market capitalization, and price volatility, are ESEA, CCO, PTVE, SRT, and PMTS.
- Visit BGS's SEC page to see the company's official filings. To visit the company's web site, go to www.bgfoods.com.
BGS Valuation Summary
- BGS's price/earnings ratio is 17.9; this is 20.97% lower than that of the median Consumer Defensive stock.
- BGS's EV/EBIT ratio has moved up 1.6 over the prior 174 months.
- BGS's price/sales ratio has moved up 0.1 over the prior 174 months.
Below are key valuation metrics over time for BGS.
Stock | Date | P/S | P/B | P/E | EV/EBIT |
---|---|---|---|---|---|
BGS | 2021-09-03 | 1 | 2.4 | 17.9 | 16.8 |
BGS | 2021-09-02 | 1 | 2.3 | 17.9 | 16.8 |
BGS | 2021-09-01 | 1 | 2.3 | 17.7 | 16.7 |
BGS | 2021-08-31 | 1 | 2.3 | 17.8 | 16.8 |
BGS | 2021-08-30 | 1 | 2.3 | 17.3 | 16.6 |
BGS | 2021-08-27 | 1 | 2.3 | 17.2 | 16.5 |
BGS Growth Metrics
- Its 4 year price growth rate is now at -51.14%.
- Its 4 year net income to common stockholders growth rate is now at 6.01%.
- Its 5 year net income to common stockholders growth rate is now at 6.01%.

The table below shows BGS's growth in key financial areas (numbers in millions of US dollars).
Date | Revenue | Operating Cash Flow | Net Income to Common Stock |
---|---|---|---|
2021-12-31 | 2,056.264 | 93.878 | 67.363 |
2021-09-30 | 1,994.715 | 61.96 | 84.348 |
2021-06-30 | 1,975.509 | 101.076 | 110.414 |
2021-03-31 | 2,023.673 | 249.919 | 130.774 |
2020-12-31 | 1,967.909 | 281.477 | 131.988 |
2020-09-30 | 1,927.84 | 277.478 | 130.075 |
BGS's Quality Factors
The “Quality” component of the POWR Ratings focuses on 31 different factors of a companies fundamentals and operational strength. Here are some key insights as we drill into the specifics of these quality attributes.- BGS has a Quality Grade of D, ranking ahead of 14.05% of graded US stocks.
- BGS's asset turnover comes in at 0.543 -- ranking 38th of 58 Food Products stocks.
- TR, JJSF, and LW are the stocks whose asset turnover ratios are most correlated with BGS.
The table below shows BGS's key quality metrics over time.
Period | Asset Turnover | Gross Margin | ROIC |
---|---|---|---|
2021-07-03 | 0.543 | 0.239 | 0.083 |
2021-04-03 | 0.577 | 0.244 | 0.097 |
2021-01-02 | 0.578 | 0.245 | 0.100 |
2020-10-03 | 0.590 | 0.244 | 0.105 |
2020-06-27 | 0.550 | 0.241 | 0.093 |
2020-03-28 | 0.511 | 0.236 | 0.079 |
BGS Price Target
For more insight on analysts targets of BGS, see our BGS price target page. And for a list of of all stocks sorted by upside potential based on analyst target price, see our Top Price Target page.
Average Price Target | $28.25 | Average Broker Recommendation | 2.06 (Hold) |
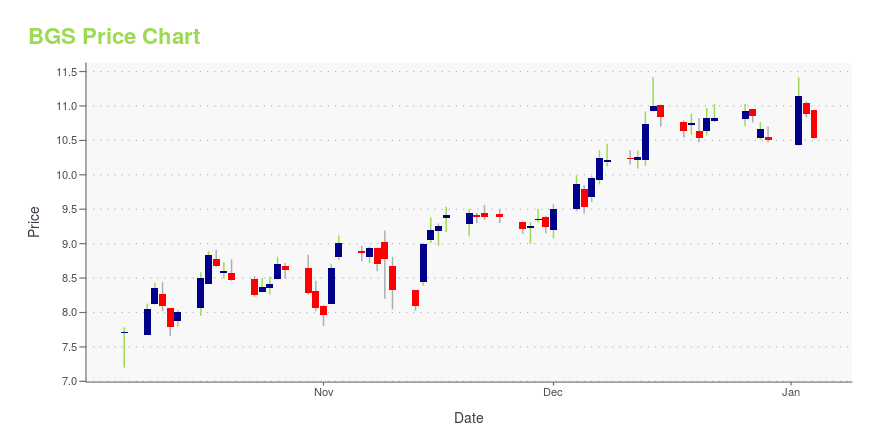
BGS Stock Price Chart Interactive Chart >
BGS Price/Volume Stats
Current price | $22.68 | 52-week high | $36.52 |
Prev. close | $22.50 | 52-week low | $21.05 |
Day low | $22.48 | Volume | 827,500 |
Day high | $22.93 | Avg. volume | 1,117,349 |
50-day MA | $26.14 | Dividend yield | 8.44% |
200-day MA | $29.39 | Market Cap | 1.56B |
B&G Foods, Inc. B&G Foods, Inc. (BGS) Company Bio
B&G Foods manufactures, sells, and distributes shelf-stable food and household products in the United States, Canada, and Puerto Rico. The company was founded in 1996 and is based in Parsippany, New Jersey.
Latest BGS News From Around the Web
Below are the latest news stories about B&G Foods Inc that investors may wish to consider to help them evaluate BGS as an investment opportunity.
BoCa Flavor ‘redefines all-purpose’ seasonings, co-founder saysBoCa Flavor Co-Founders Jelece Morris and Suzanne Delica join Yahoo Finance Live to talk about the inception of their spice business, honoring their Haitian and Jamaican roots with their brand, and working alongside charity organizations. |
B&G Foods Announces Tax Treatment of Common Stock Dividends Paid in 2021PARSIPPANY, N.J., February 15, 2022--B&G Foods, Inc. (NYSE: BGS) today explained the tax treatment for dividends paid in 2021 on the Company’s common stock. Holders are urged to check their 2021 tax statements received from brokerage firms in order to ensure that the cash distribution information reported on such statements conforms to the information reported herein. |
B&G Foods Announces Date of Fourth Quarter and Fiscal Year 2021 Earnings Conference CallPARSIPPANY, N.J., February 15, 2022--B&G Foods, Inc. (NYSE: BGS) announced today that it intends to issue a press release with fourth quarter and fiscal year 2021 financial results after the market close on Tuesday, March 1, 2022. B&G Foods has scheduled a conference call at 4:30 p.m. ET that same day to discuss the results. Hosting the call will be Casey Keller, President and Chief Executive Officer and Bruce Wacha, Executive Vice President of Finance and Chief Financial Officer. |
B&G Foods, Inc.'s (NYSE:BGS) Intrinsic Value Is Potentially 85% Above Its Share PriceHow far off is B&G Foods, Inc. ( NYSE:BGS ) from its intrinsic value? Using the most recent financial data, we'll take... |
3 Top Hot Stocks to Watch In FebruaryB&G Foods (NYSE: BGS), Booking Holdings (NASDAQ: BKNG), and Dick's Sporting Goods (NYSE: DKS) are three consumer-facing stocks trading higher this year. A lot of people have taken to playing sports outside as a way to stay active in the pandemic, and Dick's Sporting Goods is the industry leader. |
BGS Price Returns
1-mo | -18.65% |
3-mo | -24.79% |
6-mo | -23.18% |
1-year | -19.24% |
3-year | 28.82% |
5-year | -19.33% |
YTD | -24.91% |
2021 | 17.69% |
2020 | 67.73% |
2019 | -31.93% |
2018 | -12.20% |
2017 | -15.46% |
BGS Dividends
Ex-Dividend Date | Type | Payout Amount | Change | ||||||
---|---|---|---|---|---|---|---|---|---|
Loading, please wait... |
Continue Researching BGS
Want to do more research on B&G Foods Inc's stock and its price? Try the links below:B&G Foods Inc (BGS) Stock Price | Nasdaq
B&G Foods Inc (BGS) Stock Quote, History and News - Yahoo Finance
B&G Foods Inc (BGS) Stock Price and Basic Information | MarketWatch
Loading social stream, please wait...