
Cohen & Steers Inc (CNS): Price and Financial Metrics
CNS Price/Volume Stats
| Current price | $86.91 | 52-week high | $87.34 |
| Prev. close | $85.89 | 52-week low | $50.05 |
| Day low | $85.39 | Volume | 275,401 |
| Day high | $87.34 | Avg. volume | 238,360 |
| 50-day MA | $73.59 | Dividend yield | 2.84% |
| 200-day MA | $68.70 | Market Cap | 4.39B |
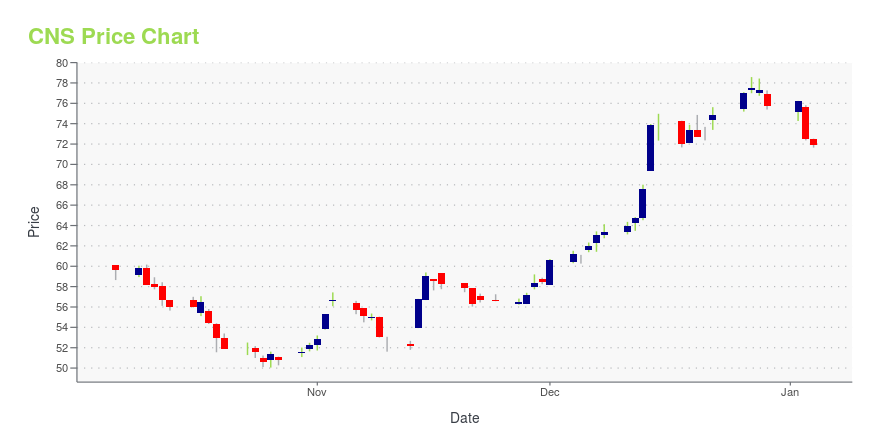
CNS Stock Price Chart Interactive Chart >
Cohen & Steers Inc (CNS) Company Bio
Cohen & Steers specializes in liquid real assets, including real estate securities, listed infrastructure, commodities and natural resource equities, as well as preferred securities and other income solutions. The company was founded in 1986 and is based in New York, New York.
Latest CNS News From Around the Web
Below are the latest news stories about COHEN & STEERS INC that investors may wish to consider to help them evaluate CNS as an investment opportunity.
Cohen & Steers Closed-End Opportunity Fund, Inc. (FOF) Notification of Sources of Distribution Under Section 19(a)This press release provides shareholders of Cohen & Steers Closed-End Opportunity Fund, Inc. (NYSE: FOF) (the "Fund") with information regarding the sources of the distribution to be paid on December 29, 2023 and cumulative distributions paid fiscal year-to-date. |
Cohen & Steers Total Return Realty Fund, Inc. (RFI) Notification of Sources of Distribution Under Section 19(a)This press release provides shareholders of Cohen & Steers Total Return Realty Fund, Inc. (NYSE: RFI) (the "Fund") with information regarding the sources of the distribution to be paid on December 29, 2023 and cumulative distributions paid fiscal year-to-date. |
Cohen & Steers Infrastructure Fund, Inc. (UTF) Notification of Sources of Distribution Under Section 19(a)This press release provides shareholders of Cohen & Steers Infrastructure Fund, Inc. (NYSE: UTF) (the "Fund") with information regarding the sources of the distribution to be paid on December 29, 2023 and cumulative distributions paid fiscal year-to-date. |
Cohen & Steers REIT and Preferred and Income Fund, Inc. (RNP) Notification of Sources of Distribution Under Section 19(a)This press release provides shareholders of Cohen & Steers REIT and Preferred and Income Fund, Inc. (NYSE: RNP) (the "Fund") with information regarding the sources of the distribution to be paid on December 29, 2023 and cumulative distributions paid fiscal year-to-date. |
Cohen & Steers Quality Income Realty Fund, Inc. (RQI) Notification of Sources of Distribution Under Section 19(a)This press release provides shareholders of Cohen & Steers Quality Income Realty Fund, Inc. (NYSE: RQI) (the "Fund") with information regarding the sources of the distribution to be paid on December 29, 2023 and cumulative distributions paid fiscal year-to-date. |
CNS Price Returns
| 1-mo | 23.75% |
| 3-mo | 24.50% |
| 6-mo | 25.08% |
| 1-year | 36.96% |
| 3-year | 18.49% |
| 5-year | 105.70% |
| YTD | 16.62% |
| 2023 | 21.84% |
| 2022 | -27.38% |
| 2021 | 29.00% |
| 2020 | 23.45% |
| 2019 | 93.97% |
CNS Dividends
| Ex-Dividend Date | Type | Payout Amount | Change | ||||||
|---|---|---|---|---|---|---|---|---|---|
| Loading, please wait... | |||||||||
Continue Researching CNS
Here are a few links from around the web to help you further your research on Cohen & Steers Inc's stock as an investment opportunity:Cohen & Steers Inc (CNS) Stock Price | Nasdaq
Cohen & Steers Inc (CNS) Stock Quote, History and News - Yahoo Finance
Cohen & Steers Inc (CNS) Stock Price and Basic Information | MarketWatch
Loading social stream, please wait...