Copa Holdings, S.A. Copa Holdings, S.A. (CPA): Price and Financial Metrics
CPA Price/Volume Stats
Current price | $103.74 | 52-week high | $121.20 |
Prev. close | $102.92 | 52-week low | $78.12 |
Day low | $103.17 | Volume | 295,748 |
Day high | $105.00 | Avg. volume | 290,660 |
50-day MA | $99.42 | Dividend yield | 6.35% |
200-day MA | $98.98 | Market Cap | 4.09B |
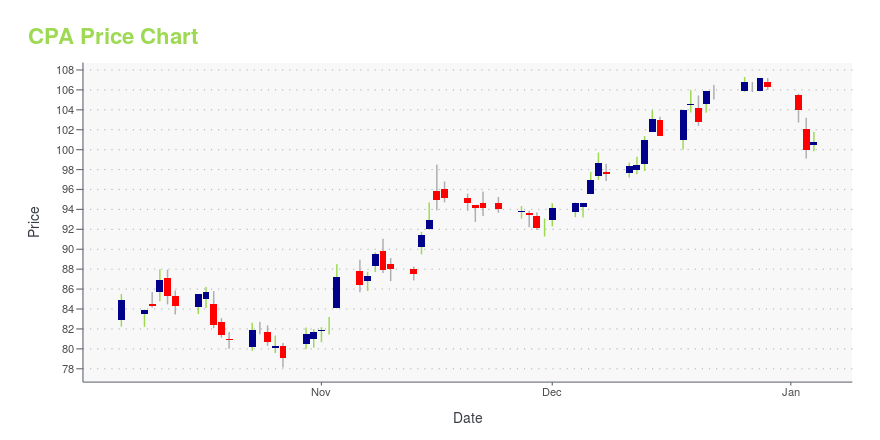
CPA Stock Price Chart Interactive Chart >
CPA POWR Grades
- CPA scores best on the Sentiment dimension, with a Sentiment rank ahead of 98.51% of US stocks.
- The strongest trend for CPA is in Momentum, which has been heading down over the past 26 weeks.
- CPA's current lowest rank is in the Stability metric (where it is better than 31.21% of US stocks).
CPA Stock Summary
- Of note is the ratio of COPA HOLDINGS SA's sales and general administrative expense to its total operating expenses; only 14.85% of US stocks have a lower such ratio.
- With a year-over-year growth in debt of 30.72%, COPA HOLDINGS SA's debt growth rate surpasses 82.08% of about US stocks.
- In terms of twelve month growth in earnings before interest and taxes, COPA HOLDINGS SA is reporting a growth rate of 200.27%; that's higher than 94.04% of US stocks.
- Stocks with similar financial metrics, market capitalization, and price volatility to COPA HOLDINGS SA are CRC, X, SXC, LBRT, and WOW.
- Visit CPA's SEC page to see the company's official filings. To visit the company's web site, go to copa.gcs-web.com.
CPA Valuation Summary
- In comparison to the median Industrials stock, CPA's price/sales ratio is 16.67% higher, now standing at 1.4.
- Over the past 213 months, CPA's price/sales ratio has gone down 0.2.
Below are key valuation metrics over time for CPA.
Stock | Date | P/S | P/B | P/E | EV/EBIT |
---|---|---|---|---|---|
CPA | 2023-12-29 | 1.4 | 2.8 | 12.0 | 12.1 |
CPA | 2023-12-28 | 1.4 | 2.8 | 12.1 | 12.2 |
CPA | 2023-12-27 | 1.4 | 2.8 | 12.1 | 12.1 |
CPA | 2023-12-26 | 1.4 | 2.8 | 12.1 | 12.1 |
CPA | 2023-12-22 | 1.4 | 2.8 | 12.0 | 12.1 |
CPA | 2023-12-21 | 1.4 | 2.8 | 12.0 | 12.0 |
CPA Growth Metrics
- Its 3 year net cashflow from operations growth rate is now at 7.07%.
- Its 5 year net income to common stockholders growth rate is now at -264.22%.
- The year over year cash and equivalents growth rate now stands at 77.28%.
The table below shows CPA's growth in key financial areas (numbers in millions of US dollars).
Date | Revenue | Operating Cash Flow | Net Income to Common Stock |
---|---|---|---|
2021-12-31 | 1,509.931 | 538.845 | 43.844 |
2020-12-31 | 801.003 | 58.503 | -607.062 |
2019-12-31 | 2,707.408 | 856.014 | 247.002 |
2018-12-31 | 2,677.627 | 489.067 | 88.095 |
2017-12-31 | 2,527.556 | 799.486 | 369.658 |
2017-12-31 | 2,527.556 | 799.486 | 370.023 |
CPA's Quality Factors
The “Quality” component of the POWR Ratings focuses on 31 different factors of a companies fundamentals and operational strength. Here are some key insights as we drill into the specifics of these quality attributes.- CPA has a Quality Grade of B, ranking ahead of 75.55% of graded US stocks.
- CPA's asset turnover comes in at 0.195 -- ranking 99th of 137 Transportation stocks.
- 500 - Internal server error
The table below shows CPA's key quality metrics over time.
Period | Asset Turnover | Gross Margin | ROIC |
---|---|---|---|
2020-12-31 | 0.195 | 0.584 | -0.129 |
2019-12-31 | 0.641 | 0.591 | 0.082 |
2018-12-31 | 0.642 | 0.509 | 0.039 |
2017-12-31 | 0.624 | 0.557 | 0.117 |
2017-12-31 | 0.624 | 0.560 | 0.117 |
2016-12-31 | 0.588 | 0.570 | 0.109 |
CPA Price Target
For more insight on analysts targets of CPA, see our CPA price target page. And for a list of of all stocks sorted by upside potential based on analyst target price, see our Top Price Target page.
Average Price Target | $94.00 | Average Broker Recommendation | 1.67 (Moderate Buy) |
Copa Holdings, S.A. Copa Holdings, S.A. (CPA) Company Bio
Copa Holdings is a leading Latin American provider of passenger and cargo services. The Company, through its operating subsidiaries, provides service to 74 destinations in 30 countries in North, Central and South America and the Caribbean. The company was founded in 1947 and is based in Panama City, Panama.
Latest CPA News From Around the Web
Below are the latest news stories about COPA HOLDINGS SA that investors may wish to consider to help them evaluate CPA as an investment opportunity.
Is Copa Holdings, S.A.'s (NYSE:CPA) Latest Stock Performance A Reflection Of Its Financial Health?Copa Holdings' (NYSE:CPA) stock is up by a considerable 19% over the past three months. Since the market usually pay... |
Airlines Post Impressive November Traffic Numbers: An AnalysisCopa Holdings (CPA), AZUL and Ryanair Holdings (RYAAY) report impressive traffic numbers for November 2023. |
Why Is Copa Holdings (CPA) Up 8.5% Since Last Earnings Report?Copa Holdings (CPA) reported earnings 30 days ago. What's next for the stock? We take a look at earnings estimates for some clues. |
Airline Stock Roundup: LUV Gives Bearish Q4 View, CPA Posts November TrafficSouthwest Airlines (LUV) expects Q4 economic fuel costs per gallon of $3-$3.1. Copa Holdings (CPA) announces a double-digit increase in November traffic. |
Copa Holdings (CPA) November Traffic Rises From 2022 LevelsCopa Holdings' (CPA) load factor for November 2023 improved to 87.4% from 87.1% in the year-ago period, driven by a buoyant traffic scenario. |
CPA Price Returns
1-mo | 5.23% |
3-mo | -0.82% |
6-mo | 19.35% |
1-year | 20.48% |
3-year | 41.40% |
5-year | 39.42% |
YTD | -0.82% |
2023 | 32.38% |
2022 | 0.62% |
2021 | 7.03% |
2020 | -27.90% |
2019 | 41.09% |
CPA Dividends
Ex-Dividend Date | Type | Payout Amount | Change | ||||||
---|---|---|---|---|---|---|---|---|---|
Loading, please wait... |
Continue Researching CPA
Want to do more research on Copa Holdings SA's stock and its price? Try the links below:Copa Holdings SA (CPA) Stock Price | Nasdaq
Copa Holdings SA (CPA) Stock Quote, History and News - Yahoo Finance
Copa Holdings SA (CPA) Stock Price and Basic Information | MarketWatch
Loading social stream, please wait...