Duke Energy Corp. (DUK): Price and Financial Metrics
GET POWR RATINGS... FREE!
DUK POWR Grades
- DUK scores best on the Stability dimension, with a Stability rank ahead of 76.61% of US stocks.
- DUK's strongest trending metric is Momentum; it's been moving up over the last 179 days.
- DUK's current lowest rank is in the Value metric (where it is better than 30.17% of US stocks).
DUK Stock Summary
- DUK has a market capitalization of $85,375,695,434 -- more than approximately 96.88% of US stocks.
- Of note is the ratio of Duke Energy CORP's sales and general administrative expense to its total operating expenses; merely 0.5% of US stocks have a lower such ratio.
- In terms of volatility of its share price, DUK is more volatile than only 1.23% of stocks we're observing.
- Stocks that are quantitatively similar to DUK, based on their financial statements, market capitalization, and price volatility, are D, SO, TRP, SCCO, and AEP.
- Visit DUK's SEC page to see the company's official filings. To visit the company's web site, go to www.duke-energy.com.
DUK Valuation Summary
- In comparison to the median Utilities stock, DUK's price/sales ratio is 57.14% higher, now standing at 3.3.
- Over the past 243 months, DUK's price/sales ratio has gone up 2.8.
- DUK's price/earnings ratio has moved up 11.9 over the prior 243 months.
Below are key valuation metrics over time for DUK.
Stock | Date | P/S | P/B | P/E | EV/EBIT |
---|---|---|---|---|---|
DUK | 2021-09-01 | 3.3 | 1.7 | 28.2 | 28.4 |
DUK | 2021-08-31 | 3.3 | 1.7 | 27.8 | 28.2 |
DUK | 2021-08-30 | 3.3 | 1.7 | 27.9 | 28.2 |
DUK | 2021-08-27 | 3.3 | 1.7 | 27.8 | 28.2 |
DUK | 2021-08-26 | 3.3 | 1.7 | 27.9 | 28.2 |
DUK | 2021-08-25 | 3.3 | 1.7 | 28.0 | 28.3 |
DUK Growth Metrics
- The 3 year cash and equivalents growth rate now stands at -51.54%.
- Its 3 year price growth rate is now at 8.29%.
- Its 2 year cash and equivalents growth rate is now at 244.42%.

The table below shows DUK's growth in key financial areas (numbers in millions of US dollars).
Date | Revenue | Operating Cash Flow | Net Income to Common Stock |
---|---|---|---|
2021-12-31 | 25,097 | 8,290 | 3,802 |
2021-09-30 | 24,636 | 9,317 | 2,993 |
2021-06-30 | 24,406 | 9,372 | 2,892 |
2021-03-31 | 24,069 | 9,390 | 1,324 |
2020-12-31 | 23,868 | 8,856 | 1,270 |
2020-09-30 | 24,194 | 9,338 | 2,034 |
DUK's Quality Factors
The “Quality” component of the POWR Ratings focuses on 31 different factors of a companies fundamentals and operational strength. Here are some key insights as we drill into the specifics of these quality attributes.- DUK has a Quality Grade of C, ranking ahead of 41.69% of graded US stocks.
- DUK's asset turnover comes in at 0.15 -- ranking 84th of 105 Utilities stocks.
- CMS, CNP, and NI are the stocks whose asset turnover ratios are most correlated with DUK.
The table below shows DUK's key quality metrics over time.
Period | Asset Turnover | Gross Margin | ROIC |
---|---|---|---|
2021-09-30 | 0.150 | 0.429 | 0.028 |
2021-06-30 | 0.150 | 0.429 | 0.027 |
2021-03-31 | 0.149 | 0.427 | 0.017 |
2020-12-31 | 0.148 | 0.429 | 0.017 |
2020-09-30 | 0.151 | 0.426 | 0.023 |
2020-06-30 | 0.154 | 0.424 | 0.024 |
DUK Price Target
For more insight on analysts targets of DUK, see our DUK price target page. And for a list of of all stocks sorted by upside potential based on analyst target price, see our Top Price Target page.
Average Price Target | $108.09 | Average Broker Recommendation | 1.82 (Hold) |
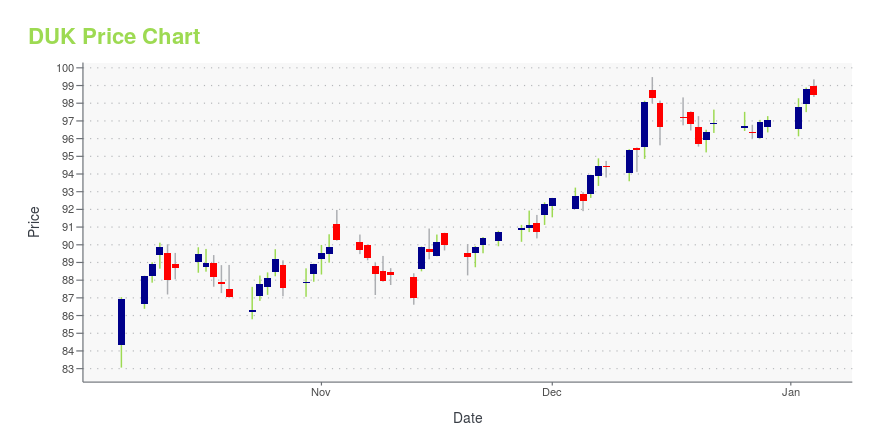
DUK Stock Price Chart Interactive Chart >
DUK Price/Volume Stats
Current price | $114.40 | 52-week high | $116.33 |
Prev. close | $113.23 | 52-week low | $95.48 |
Day low | $112.58 | Volume | 2,628,900 |
Day high | $114.50 | Avg. volume | 2,994,373 |
50-day MA | $111.45 | Dividend yield | 3.44% |
200-day MA | $104.60 | Market Cap | 88.08B |
Duke Energy Corp. (DUK) Company Bio
Based in Charlotte, North Carolina, Duke Energy owns 58,200 megawatts of base-load and peak generation in the United States, which it distributes to its 7.2 million customers. The company has approximately 29,000 employees. Duke Energy's service territory covers 104,000 square miles (270,000 km2) with 250,200 miles (402,700 km) of distribution lines. Almost all of Duke Energy's Midwest generation comes from coal, natural gas, or oil, while half of its Carolinas generation comes from its nuclear power plants. During 2006, Duke Energy generated 148,798,332 megawatt-hours of electrical energy. (Source:Wikipedia)
Latest DUK News From Around the Web
Below are the latest news stories about Duke Energy CORP that investors may wish to consider to help them evaluate DUK as an investment opportunity.
Lynn J. Good, Chair, President & CEO of Duke Energy Corporation Met With Business Roundtable to Discuss Climate ChangeCEO Lynn Good met with Business Roundtable to discuss our leadership in addressing climate change by building renewables, continuing to operate nuclear, and retiring coal assets. We are committed t... |
Duke Energy board appoints Derrick Burks as board memberDuke Energy's board of directors today announced the appointment of Derrick Burks – a former managing partner at global professional services company EY (Ernst & Young) – as a new board member, effective March 1. |
Duke Energy Florida celebrates significant milestone by completing Park & Plug pilot programContinuing its efforts to provide cleaner energy options and improve access to electric vehicle (EV) chargers, Duke Energy today announced the completion of its Park & Plug pilot program and the installation of 627 EV charging stations in public spaces and on thoroughfares in Florida. |
Charlotte Knights upgrade stadium lighting at Truist FieldCharlotte's minor-league baseball team has installed energy-efficiency lights as part of a Duke Energy-backed program. |
Duke Energy Corporation (Holdin Consensus Indicates Potential 9.1% UpsideDuke Energy Corporation (Holdin with ticker code (DUK) have now 17 analysts covering the stock. The analyst consensus points to a rating of ''Buy''. The target price ranges between 119 and 95 and has a mean target at 107.68. Given that the stocks previous close was at 98.73 this now indicates there is a potential upside of 9.1%. The 50 day moving average now sits at 103 while the 200 day moving average is 102.29. The market capitalisation for the company is $76,754m. Visit the company website at: https://www.duke-energy.com [stock_market_widget type="chart" template="basic" color="green" assets=DUK" range="6mo" interval="1d" axes="true" cursor="true" api="yf"] The potential market cap would be $83,712m based on the market concensus. Duke Energy Corporation, together with its subsidiarie... |
DUK Price Returns
1-mo | 1.44% |
3-mo | 15.18% |
6-mo | 16.33% |
1-year | 18.56% |
3-year | 50.62% |
5-year | 65.77% |
YTD | 11.14% |
2021 | 19.11% |
2020 | 4.77% |
2019 | 10.29% |
2018 | 7.42% |
2017 | 12.96% |
DUK Dividends
Ex-Dividend Date | Type | Payout Amount | Change | ||||||
---|---|---|---|---|---|---|---|---|---|
Loading, please wait... |
Continue Researching DUK
Here are a few links from around the web to help you further your research on Duke Energy CORP's stock as an investment opportunity:Duke Energy CORP (DUK) Stock Price | Nasdaq
Duke Energy CORP (DUK) Stock Quote, History and News - Yahoo Finance
Duke Energy CORP (DUK) Stock Price and Basic Information | MarketWatch
Loading social stream, please wait...