
Insteel Industries, Inc. (IIIN): Price and Financial Metrics
IIIN Price/Volume Stats
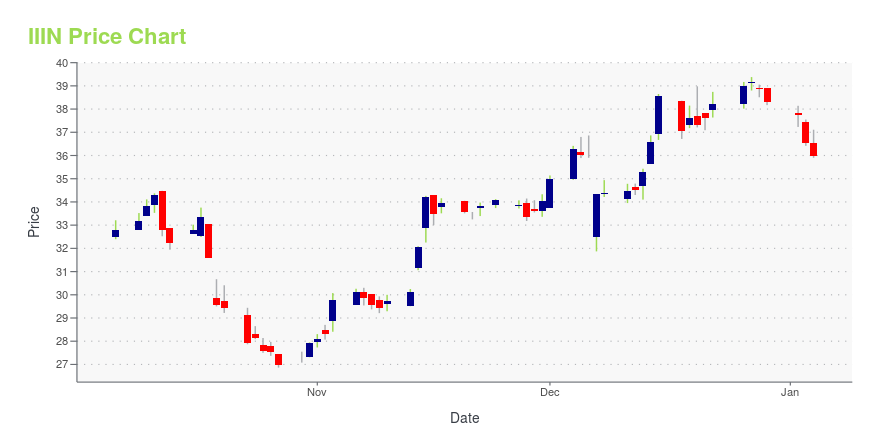
| Current price | $32.39 | 52-week high | $39.38 |
| Prev. close | $31.73 | 52-week low | $26.86 |
| Day low | $31.70 | Volume | 128,633 |
| Day high | $32.68 | Avg. volume | 88,626 |
| 50-day MA | $35.39 | Dividend yield | 0.34% |
| 200-day MA | $33.78 | Market Cap | 629.92M |
IIIN Stock Price Chart Interactive Chart >
Insteel Industries, Inc. (IIIN) Company Bio
Insteel Industries manufactures and markets steel wire reinforcing products for concrete construction applications. The company was founded in 1958 and is based in Mount Airy, North Carolina.
Latest IIIN News From Around the Web
Below are the latest news stories about INSTEEL INDUSTRIES INC that investors may wish to consider to help them evaluate IIIN as an investment opportunity.
Insteel Industries Announces First Quarter 2024 Conference CallMOUNT AIRY, N.C., December 18, 2023--Insteel Industries Inc. (NYSE: IIIN) today announced that its first quarter 2024 earnings conference call will be webcast live over the internet on Thursday, January 18, 2024, at 10:00 a.m. ET following the release of the Company’s first quarter financial results at 6:30 a.m. ET on that same day. The conference call can be accessed on the Company’s website at https://investor.insteel.com and will be archived for replay. |
Sidoti Events, LLC's Virtual December Small-Cap ConferenceNEW YORK, NY / ACCESSWIRE / December 5, 2023 / Sidoti Events, LLC, an affiliate of Sidoti & Company, LLC, has released the presentation schedule and weblinks for its two-day December Small-Cap Conference taking place Wednesday and Thursday, December ... |
Insteel Industries Declares Regular Quarterly and Special Cash DividendsMOUNT AIRY, N.C., November 14, 2023--Insteel Industries Inc. (NYSE: IIIN) today announced that its board of directors declared a regular quarterly cash dividend of $0.03 per share and a special cash dividend of $2.50 per share of common stock payable on December 22, 2023, to shareholders of record as of December 8, 2023. |
Insteel Industries Reports Fourth Quarter and Fiscal 2023 ResultsMOUNT AIRY, N.C., October 19, 2023--Insteel Industries Inc. (NYSE: IIIN) ("Insteel" or the "Company), the largest manufacturer of steel wire reinforcing products for concrete construction applications in the United States, today announced financial results for its fourth quarter and fiscal year ended September 30, 2023. |
Insteel Industries Announces Fourth Quarter 2023 Conference CallMOUNT AIRY, N.C., September 19, 2023--Insteel Industries Inc. (NYSE: IIIN) today announced that its fourth quarter 2023 earnings conference call will be webcast live over the internet on Thursday, October 19, 2023 at 10:00 a.m. ET following the release of the Company’s fourth quarter financial results at 6:30 a.m. ET on that same day. The conference call can be accessed on the Company’s website at https://investor.insteel.com and will be archived for replay. |
IIIN Price Returns
| 1-mo | -14.36% |
| 3-mo | -5.46% |
| 6-mo | 29.16% |
| 1-year | 25.67% |
| 3-year | 5.03% |
| 5-year | 102.51% |
| YTD | -15.34% |
| 2023 | 50.01% |
| 2022 | -25.64% |
| 2021 | 88.28% |
| 2020 | 10.88% |
| 2019 | -10.98% |
IIIN Dividends
| Ex-Dividend Date | Type | Payout Amount | Change | ||||||
|---|---|---|---|---|---|---|---|---|---|
| Loading, please wait... | |||||||||
Continue Researching IIIN
Want to do more research on Insteel Industries Inc's stock and its price? Try the links below:Insteel Industries Inc (IIIN) Stock Price | Nasdaq
Insteel Industries Inc (IIIN) Stock Quote, History and News - Yahoo Finance
Insteel Industries Inc (IIIN) Stock Price and Basic Information | MarketWatch
Loading social stream, please wait...