
Ingersoll Rand Inc. (IR): Price and Financial Metrics
IR Price/Volume Stats
| Current price | $98.70 | 52-week high | $101.30 |
| Prev. close | $96.94 | 52-week low | $59.20 |
| Day low | $97.84 | Volume | 1,803,638 |
| Day high | $99.61 | Avg. volume | 2,615,036 |
| 50-day MA | $93.53 | Dividend yield | 0.08% |
| 200-day MA | $83.77 | Market Cap | 39.82B |
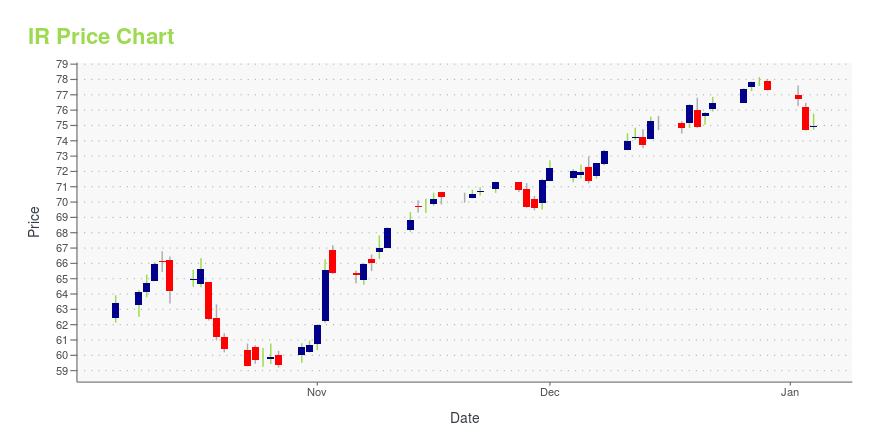
IR Stock Price Chart Interactive Chart >
Ingersoll Rand Inc. (IR) Company Bio
Ingersoll Rand Inc., is a multinational company that provides flow creation and industrial products. The company was formed in February 2020 through the merger of the Industrial segment of Ingersoll-Rand Plc (now known as Trane Technologies) and Gardner Denver (Gardner Denver Holdings Inc). Its products are sold under more than 40 brands across all major global markets. (Source:Wikipedia)
Latest IR News From Around the Web
Below are the latest news stories about INGERSOLL RAND INC that investors may wish to consider to help them evaluate IR as an investment opportunity.
Trane Technologies (TT) Rose on Tax IncentivesClearBridge Investments, an investment management company, released its “ClearBridge Sustainability Leaders Strategy” third quarter 2023 investor letter. A copy of the same can be downloaded here. The strategy underperformed its benchmark, the Russell 3000 Index, in the quarter. The strategy gained two out of 10 sectors in which it invested during the quarter, on an absolute […] |
Ingersoll Rand (IR) Gains From Business Strength, Risks PersistIngersoll Rand (IR) benefits from strength across its businesses, solid product offerings and acquired assets. However, the softness of its life sciences business is concerning. |
Reasons to Retain Trane Technologies (TT) for the Time BeingTrane Technologies (TT) is dedicated to improving product quality, operational efficiency, and innovation for sustained earnings and cash flow growth. |
Jim Cramer Stock Portfolio: 12 Recent AdditionsIn this article, we discuss the 12 recent additions to the Jim Cramer stock portfolio. If you want to read about some more Cramer stocks, go directly to Jim Cramer Stock Portfolio: 5 Recent Additions. Jim Cramer, the host of Mad Money on CNBC, is one of the most well-known finance personalities on television. He […] |
TT vs. APP: Which Stock Is the Better Value Option?TT vs. APP: Which Stock Is the Better Value Option? |
IR Price Returns
| 1-mo | 9.91% |
| 3-mo | 5.58% |
| 6-mo | 24.52% |
| 1-year | 54.26% |
| 3-year | 105.49% |
| 5-year | 210.26% |
| YTD | 27.67% |
| 2023 | 48.21% |
| 2022 | -15.41% |
| 2021 | 35.85% |
| 2020 | 24.21% |
| 2019 | 92.80% |
IR Dividends
| Ex-Dividend Date | Type | Payout Amount | Change | ||||||
|---|---|---|---|---|---|---|---|---|---|
| Loading, please wait... | |||||||||
Continue Researching IR
Want to do more research on Ingersoll-Rand plc's stock and its price? Try the links below:Ingersoll-Rand plc (IR) Stock Price | Nasdaq
Ingersoll-Rand plc (IR) Stock Quote, History and News - Yahoo Finance
Ingersoll-Rand plc (IR) Stock Price and Basic Information | MarketWatch
Loading social stream, please wait...