Kinder Morgan, Inc. (KMI): Price and Financial Metrics


Kinder Morgan, Inc. (KMI): $16.18

-0.21 (-1.28%)

POWR Rating

Component Grades

Growth

S

Value

I

Momentum

G

Stability

N

Sentiment

U

Quality

P

KMI POWR Grades

  • KMI scores best on the Momentum dimension, with a Momentum rank ahead of 97.32% of US stocks.
  • KMI's strongest trending metric is Momentum; it's been moving up over the last 179 days.
  • KMI ranks lowest in Sentiment; there it ranks in the 35th percentile.

KMI Stock Summary

  • KINDER MORGAN INC's market capitalization of $37,361,813,583 is ahead of 93.98% of US-listed equities.
  • The ratio of debt to operating expenses for KINDER MORGAN INC is higher than it is for about 93.15% of US stocks.
  • In terms of volatility of its share price, KMI is more volatile than just 1.5% of stocks we're observing.
  • Stocks with similar financial metrics, market capitalization, and price volatility to KINDER MORGAN INC are MPLX, WMB, SPG, NNN, and GOGL.
  • KMI's SEC filings can be seen here. And to visit KINDER MORGAN INC's official web site, go to www.kindermorgan.com.

KMI Valuation Summary

  • KMI's price/sales ratio is 1.9; this is 65.22% higher than that of the median Energy stock.
  • KMI's price/sales ratio has moved down 1.2 over the prior 147 months.

Below are key valuation metrics over time for KMI.

Stock Date P/S P/B P/E EV/EBIT
KMI 2023-03-20 1.9 1.2 14.6 14.3
KMI 2023-03-17 1.9 1.2 14.4 14.2
KMI 2023-03-16 1.9 1.2 14.6 14.3
KMI 2023-03-15 1.9 1.2 14.6 14.3
KMI 2023-03-14 2.0 1.2 14.9 14.5
KMI 2023-03-13 2.0 1.2 14.9 14.4

KMI Growth Metrics

    The 3 year price growth rate now stands at -4.63%.
  • The year over year net cashflow from operations growth rate now stands at -11.05%.
  • Its 5 year cash and equivalents growth rate is now at -9.09%.
KMI's revenue has moved up $5.837e+09 over the prior 33 months.

The table below shows KMI's growth in key financial areas (numbers in millions of US dollars).

Date Revenue Operating Cash Flow Net Income to Common Stock
2022-09-30 19,046 4,831 2,515
2022-06-30 17,693 5,045 2,434
2022-03-31 15,692 4,919 1,042
2021-12-31 16,610 5,708 1,784
2021-09-30 15,300 5,708 1,754
2021-06-30 14,395 5,629 1,714

KMI's Quality Factors

The “Quality” component of the POWR Ratings focuses on 31 different factors of a companies fundamentals and operational strength. Here are some key insights as we drill into the specifics of these quality attributes.
  • KMI has a Quality Grade of C, ranking ahead of 63.23% of graded US stocks.
  • KMI's asset turnover comes in at 0.216 -- ranking 51st of 105 Utilities stocks.
  • WMB, OGE, and YORW are the stocks whose asset turnover ratios are most correlated with KMI.

The table below shows KMI's key quality metrics over time.

Period Asset Turnover Gross Margin ROIC
2021-09-30 0.216 0.476 0.048
2021-06-30 0.202 0.505 0.047
2021-03-31 0.193 0.518 0.053
2020-12-31 0.162 0.539 0.028
2020-09-30 0.164 0.541 0.032
2020-06-30 0.165 0.541 0.034

KMI Price Target

For more insight on analysts targets of KMI, see our KMI price target page. And for a list of of all stocks sorted by upside potential based on analyst target price, see our Top Price Target page.

Average Price Target $18.52 Average Broker Recommendation 1.98 (Hold)

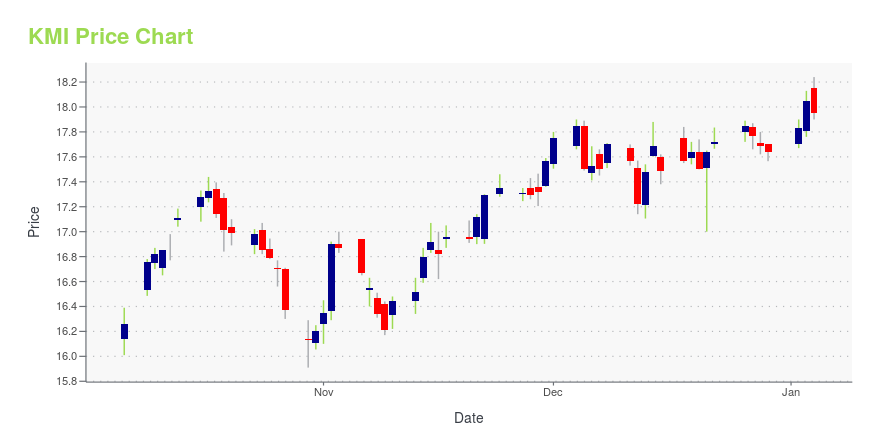
KMI Stock Price Chart Interactive Chart >

Price chart for KMI

KMI Price/Volume Stats

Current price $16.18 52-week high $20.20
Prev. close $16.39 52-week low $15.77
Day low $16.18 Volume 10,507
Day high $16.18 Avg. volume 13,142,000
50-day MA $17.74 Dividend yield 6.6%
200-day MA $17.82 Market Cap 36.37B

Kinder Morgan, Inc. (KMI) Company Bio


Kinder Morgan operates as an energy infrastructure and energy company in North America. The company operates through Natural Gas Pipelines, CO2, Terminals, Products Pipelines, Kinder Morgan Canada, and Other segments. The company was founded in 2011 and is based in Houston, Texas.


KMI Latest News Stream


Event/Time News Detail
Loading, please wait...

KMI Latest Social Stream


Loading social stream, please wait...

View Full KMI Social Stream

Latest KMI News From Around the Web

Below are the latest news stories about KINDER MORGAN INC that investors may wish to consider to help them evaluate KMI as an investment opportunity.

11 Extreme Dividend Stocks With Upside Potential

In this article, we discuss 11 extreme dividend stocks with upside potential. You can skip our detailed analysis of dividend stocks and their historical performance, and go directly to read 5 Extreme Dividend Stocks With Upside Potential. In the current inflationary environment, dividend stocks help reduce a portfolio’s volatility and provide a hedge against inflation. […]

Yahoo | March 22, 2023

Kinder Morgan (KMI) Outpaces Stock Market Gains: What You Should Know

Kinder Morgan (KMI) closed at $16.53 in the latest trading session, marking a +1.54% move from the prior day.

Yahoo | March 20, 2023

Playa Hotels & Resorts and Capri Holdings have been highlighted as Zacks Bull and Bear of the Day

Playa Hotels & Resorts and Capri Holdings are part of the Zacks Bull and Bear of the Day article.

Yahoo | March 17, 2023

Is Kinder Morgan Stock a Buy?

This high-yield midstream giant has some notable positive attributes, but there are material negatives to consider as well.

Yahoo | March 17, 2023

3 Midstream Energy Stocks to Gain Despite Prevailing Uncertainty

Amid heightened volatility, it would be wise for investors to keep an eye on midstream stocks like Enterprise Products Partners (EPD), Kinder Morgan, Inc. (KMI) and MPLX (MPLX).

Yahoo | March 16, 2023

Read More 'KMI' Stories Here

KMI Price Returns

1-mo -6.58%
3-mo -9.46%
6-mo 0.92%
1-year -6.02%
3-year 53.26%
5-year 44.71%
YTD -9.16%
2022 21.24%
2021 23.75%
2020 -30.78%
2019 44.43%
2018 -11.19%

KMI Dividends

Ex-Dividend Date Type Payout Amount Change
Loading, please wait...
View Full KMI Dividend History

Get Free Updates

Join thousands of investors who get the latest news, insights and top rated picks from StockNews.com!


Page generated in 0.8332 seconds.