Leggett & Platt Inc. (LEG): Price and Financial Metrics
GET POWR RATINGS... FREE!
LEG POWR Grades
- Stability is the dimension where LEG ranks best; there it ranks ahead of 71.46% of US stocks.
- The strongest trend for LEG is in Growth, which has been heading down over the past 177 days.
- LEG ranks lowest in Sentiment; there it ranks in the 12th percentile.
LEG Stock Summary
- The capital turnover (annual revenue relative to shareholder's equity) for LEG is 3.38 -- better than 85.15% of US stocks.
- LEG's went public 35.25 years ago, making it older than 91.57% of listed US stocks we're tracking.
- The volatility of LEGGETT & PLATT INC's share price is greater than that of just 17.21% US stocks with at least 200 days of trading history.
- If you're looking for stocks that are quantitatively similar to LEGGETT & PLATT INC, a group of peers worth examining would be MD, PLOW, DOOR, SP, and PKG.
- Visit LEG's SEC page to see the company's official filings. To visit the company's web site, go to www.leggett.com.
LEG Valuation Summary
- LEG's price/sales ratio is 0.9; this is 52.63% lower than that of the median Consumer Cyclical stock.
- Over the past 243 months, LEG's price/sales ratio has gone down 0.1.
Below are key valuation metrics over time for LEG.
Stock | Date | P/S | P/B | P/E | EV/EBIT |
---|---|---|---|---|---|
LEG | 2023-01-17 | 0.9 | 3.0 | 12.8 | 12.3 |
LEG | 2023-01-13 | 0.9 | 3.0 | 12.9 | 12.4 |
LEG | 2023-01-12 | 0.9 | 3.0 | 13.0 | 12.4 |
LEG | 2023-01-11 | 0.9 | 3.0 | 12.8 | 12.3 |
LEG | 2023-01-10 | 0.9 | 2.9 | 12.6 | 12.1 |
LEG | 2023-01-09 | 0.9 | 2.9 | 12.4 | 12.0 |
LEG Growth Metrics
- The 4 year net income to common stockholders growth rate now stands at -16.76%.
- Its 3 year net income to common stockholders growth rate is now at 40.15%.
- Its year over year cash and equivalents growth rate is now at -1.95%.

The table below shows LEG's growth in key financial areas (numbers in millions of US dollars).
Date | Revenue | Operating Cash Flow | Net Income to Common Stock |
---|---|---|---|
2022-09-30 | 5,283.8 | 385.2 | 362.5 |
2022-06-30 | 5,308.6 | 369.8 | 388.3 |
2022-03-31 | 5,244 | 320.9 | 405.3 |
2021-12-31 | 5,072.6 | 271.3 | 402.4 |
2021-09-30 | 4,921.7 | 299.2 | 400.1 |
2021-06-30 | 4,810.1 | 510.4 | 407.7 |
LEG's Quality Factors
The “Quality” component of the POWR Ratings focuses on 31 different factors of a companies fundamentals and operational strength. Here are some key insights as we drill into the specifics of these quality attributes.- LEG has a Quality Grade of C, ranking ahead of 29.39% of graded US stocks.
- LEG's asset turnover comes in at 0.988 -- ranking 25th of 50 Consumer Goods stocks.
- CL, ETD, and LZB are the stocks whose asset turnover ratios are most correlated with LEG.
The table below shows LEG's key quality metrics over time.
Period | Asset Turnover | Gross Margin | ROIC |
---|---|---|---|
2021-06-30 | 0.988 | 0.217 | 0.167 |
2021-03-31 | 0.928 | 0.210 | 0.126 |
2020-12-31 | 0.902 | 0.209 | 0.109 |
2020-09-30 | 0.891 | 0.214 | 0.103 |
2020-06-30 | 0.889 | 0.215 | 0.099 |
2020-03-31 | 0.945 | 0.224 | 0.126 |
LEG Price Target
For more insight on analysts targets of LEG, see our LEG price target page. And for a list of of all stocks sorted by upside potential based on analyst target price, see our Top Price Target page.
Average Price Target | $57.50 | Average Broker Recommendation | 1.75 (Moderate Buy) |
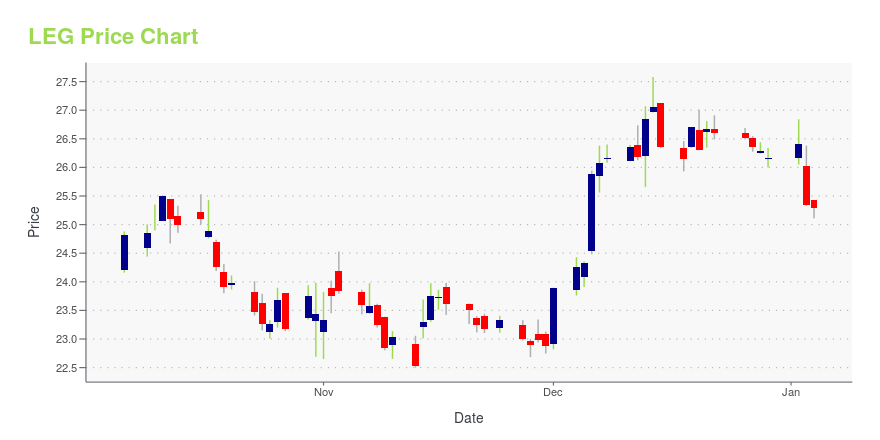
LEG Stock Price Chart Interactive Chart >
LEG Price/Volume Stats
Current price | $35.72 | 52-week high | $41.94 |
Prev. close | $35.32 | 52-week low | $30.28 |
Day low | $35.00 | Volume | 557,800 |
Day high | $35.90 | Avg. volume | 792,756 |
50-day MA | $34.14 | Dividend yield | 4.93% |
200-day MA | $35.97 | Market Cap | 4.74B |
Leggett & Platt Inc. (LEG) Company Bio
Leggett & Platt (L&P), based in Carthage, Missouri, is an American diversified manufacturer that designs and produces various engineered components and products that can be found in homes and automobiles. The firm was founded in 1883, and consists of 15 business units, 20,000 employee-partners, and 135 manufacturing facilities located in 18 countries. (Source:Wikipedia)
Latest LEG News From Around the Web
Below are the latest news stories about LEGGETT & PLATT INC that investors may wish to consider to help them evaluate LEG as an investment opportunity.
Leggett & Platt Announces 4Q 2022 Earnings CallCarthage, MO, Jan. 24, 2023 (GLOBE NEWSWIRE) -- Leggett & Platt (NYSE:LEG), a diversified manufacturer of engineered products serving several major markets, will release fourth quarter earnings results on Monday, Feb 6, 2023 after the market closes, and hold its quarterly conference call to discuss fourth quarter results, annual guidance, market conditions and related matters on Tuesday, Feb 7, 2023, at 8:30 a.m. Eastern Time (7:30 a.m. Central Time). This call will be webcast and can be accesse |
High Dividend 50: Leggett & Platt - Sure DividendLeggett & Platt is a Dividend King with 50 years of annual dividend increases. It currently has a high yield above its average. |
Leggett & Platt, Incorporated – Consensus Indicates Potential 2.1% UpsideLeggett & Platt, Incorporated with ticker code (LEG) have now 3 analysts covering the stock with the consensus suggesting a rating of ''Hold''. The range between the high target price and low target price is between 41 and 24 calculating the average target price we see 33.33. With the stocks previous close at 32.63 this would imply there is a potential upside of 2.1%. The 50 day MA is 33.82 and the 200 moving average now moves to 36.07. The market cap for the company is $4,453m. Find out more information at: https://www.leggett.com [stock_market_widget type="chart" template="basic" color="green" assets="LEG" range="6mo" interval="1d" axes="true" cursor="true" api="yf"] The potential market cap would be $4,549m based on the market concensus. Leggett & Platt, Incorporated designs, manufac... |
3 Worst Performing Dividend Kings In 2022A look at the three worst-performing Dividend Kings in 2022 which are Stanley Black & Decker, Target, and 3M Company. |
Leggett & Platt, Incorporated (NYSE:LEG) is favoured by institutional owners who hold 72% of the companyA look at the shareholders of Leggett & Platt, Incorporated ( NYSE:LEG ) can tell us which group is most powerful. We... |
LEG Price Returns
1-mo | 10.83% |
3-mo | 7.24% |
6-mo | -7.74% |
1-year | -2.89% |
3-year | -17.88% |
5-year | -7.31% |
YTD | 10.83% |
2022 | -17.78% |
2021 | -3.76% |
2020 | -9.05% |
2019 | 47.13% |
2018 | -22.25% |
LEG Dividends
Ex-Dividend Date | Type | Payout Amount | Change | ||||||
---|---|---|---|---|---|---|---|---|---|
Loading, please wait... |
Continue Researching LEG
Here are a few links from around the web to help you further your research on Leggett & Platt Inc's stock as an investment opportunity:Leggett & Platt Inc (LEG) Stock Price | Nasdaq
Leggett & Platt Inc (LEG) Stock Quote, History and News - Yahoo Finance
Leggett & Platt Inc (LEG) Stock Price and Basic Information | MarketWatch
Loading social stream, please wait...