
Main Street Capital Corporation (MAIN): Price and Financial Metrics
MAIN Price/Volume Stats
| Current price | $50.99 | 52-week high | $52.39 |
| Prev. close | $50.60 | 52-week low | $37.70 |
| Day low | $50.77 | Volume | 233,300 |
| Day high | $51.13 | Avg. volume | 356,971 |
| 50-day MA | $49.87 | Dividend yield | 5.77% |
| 200-day MA | $45.69 | Market Cap | 4.37B |
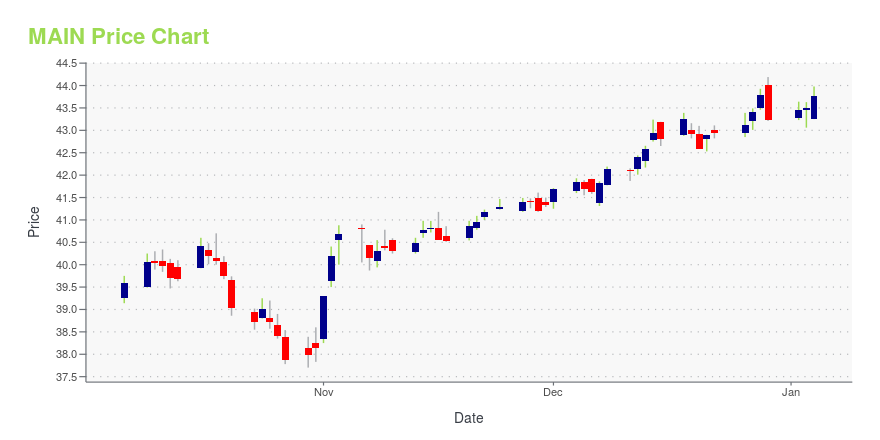
MAIN Stock Price Chart Interactive Chart >
Main Street Capital Corporation (MAIN) Company Bio
Main Street Capital is a principal investment firm that provides long-term debt and equity capital to lower middle market companies and debt capital to middle market companies. Main Street's portfolio investments are typically made to support management buyouts, recapitalizations, growth financings, refinancings and acquisitions of companies that operate in diverse industry sectors. The company was founded in 1997 and is based at Houston, Texas.
Latest MAIN News From Around the Web
Below are the latest news stories about MAIN STREET CAPITAL CORP that investors may wish to consider to help them evaluate MAIN as an investment opportunity.
Main Street Announces New Portfolio InvestmentMain Street Capital Corporation (NYSE: MAIN) ("Main Street") is pleased to announce that it recently completed a new portfolio investment totaling $43.2 million to facilitate the recapitalization of Pinnacle Plastics, Inc. and Integrity Plastics, Inc. (together, "Pinnacle" or the "Company"), a manufacturer and distributor of commercial can liners, polyethylene bags, produce bags, and other adjacent products for use predominantly in the quick-service restaurant, convenience store, and janitorial |
7 Growth Stocks That Also Pay Monthly Dividends: December 2023While it’s obvious there are great reasons to buy and hold stocks, it’s also easy to overlook a regular income gained by owning monthly dividend-paying growth stocks. |
3 Ultra High-Yield Dividend Stocks That Can Pay Your Rent Every MonthBuying ultra high-yield dividend stocks that offer safe and monthly income streams can help investors meet their monthly bills. |
3 Monthly Dividend Stocks for Steady Income in 2024Watch your investments grow by enjoying monthly returns through these three monthly dividend stocks in the new year. |
Main Street Capital Corp's Dividend AnalysisMain Street Capital Corp (NYSE:MAIN) recently announced a dividend of $0.24 per share, payable on 2024-01-12, with the ex-dividend date set for 2024-01-04. As investors look forward to this upcoming payment, the spotlight also shines on the company's dividend history, yield, and growth rates. Using the data from GuruFocus, let's look into Main Street Capital Corp's dividend performance and assess its sustainability. |
MAIN Price Returns
| 1-mo | 2.17% |
| 3-mo | 5.92% |
| 6-mo | 16.84% |
| 1-year | 31.95% |
| 3-year | 53.87% |
| 5-year | 76.58% |
| YTD | 23.76% |
| 2023 | 28.22% |
| 2022 | -11.79% |
| 2021 | 48.31% |
| 2020 | -19.54% |
| 2019 | 36.23% |
MAIN Dividends
| Ex-Dividend Date | Type | Payout Amount | Change | ||||||
|---|---|---|---|---|---|---|---|---|---|
| Loading, please wait... | |||||||||
Continue Researching MAIN
Want to see what other sources are saying about Main Street Capital CORP's financials and stock price? Try the links below:Main Street Capital CORP (MAIN) Stock Price | Nasdaq
Main Street Capital CORP (MAIN) Stock Quote, History and News - Yahoo Finance
Main Street Capital CORP (MAIN) Stock Price and Basic Information | MarketWatch
Loading social stream, please wait...