
Marathon Petroleum Corp. (MPC): Price and Financial Metrics
MPC Price/Volume Stats
| Current price | $172.65 | 52-week high | $221.11 |
| Prev. close | $171.50 | 52-week low | $128.07 |
| Day low | $170.01 | Volume | 1,789,300 |
| Day high | $173.10 | Avg. volume | 2,679,847 |
| 50-day MA | $171.84 | Dividend yield | 2.01% |
| 200-day MA | $169.11 | Market Cap | 60.83B |
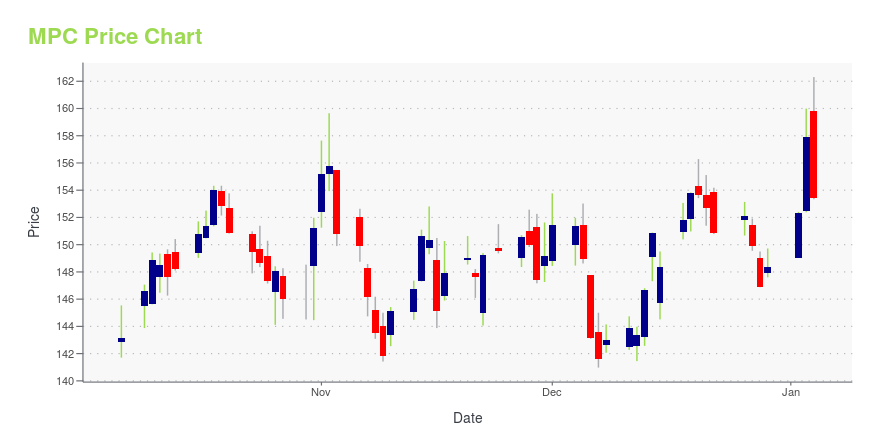
MPC Stock Price Chart Interactive Chart >
Marathon Petroleum Corp. (MPC) Company Bio
In 1887, several small oil companies combined to form The Ohio Oil Company, from which Marathon Petroleum Corp evolved. Marathon is in the oil & gas sector and the company is engaged in refining, marketing, retail, and transportation of petroleum products in the United States. The company operates thirteen oil refineries in twelve states, making it the nation’s largest oil refining system in the United States. Marathon’s refining system has the capacity to process 2.9 million barrels of crude per day. The company also operates the Marathon and Arco retail gas stations, with over 7,100 locations throughout the lower 48 states and Alaska. Michael J. Hennigan serves as President and Chief Executive Officer and the company is headquartered in Finlay, Ohio.
Latest MPC News From Around the Web
Below are the latest news stories about MARATHON PETROLEUM CORP that investors may wish to consider to help them evaluate MPC as an investment opportunity.
Marathon (MPC), Performance Shipping Ink Time Charter DealMarathon (MPC) secures a lucrative two-year time charter contract with Performance Shipping, ensuring reliable transportation, potentially advantageous rates and strategic partnership. |
Marathon (MPC) Appoints Mannen as President, Quaid as CFOMarathon (MPC) announces key leadership changes. The company appoints Mannen as its president and Quaid as CFO, signaling a new era. |
Marathon Petroleum (MPC) Stock Sinks As Market Gains: What You Should KnowMarathon Petroleum (MPC) closed at $152.66 in the latest trading session, marking a -0.63% move from the prior day. |
Marathon Petroleum names Mannen president, Quaid finance chief(Reuters) -Refiner Marathon Petroleum on Thursday named Maryann Mannen as its new president and John Quaid as its new chief financial officer, effective Jan. 1. Michael Hennigan will remain the company's chief executive officer. Mannen, Marathon's first woman president, joined the company in 2021 as chief financial officer. |
UPDATE 2-Marathon Petroleum names Mannen president, Quaid finance chiefRefiner Marathon Petroleum on Thursday named Maryann Mannen as its new president and John Quaid as its new chief financial officer, effective Jan. 1. Michael Hennigan will remain the company's chief executive officer. Mannen, Marathon's first woman president, joined the company in 2021 as chief financial officer. |
MPC Price Returns
| 1-mo | -0.15% |
| 3-mo | -12.56% |
| 6-mo | 8.85% |
| 1-year | 33.63% |
| 3-year | 237.42% |
| 5-year | 265.82% |
| YTD | 17.50% |
| 2023 | 30.46% |
| 2022 | 86.62% |
| 2021 | 61.00% |
| 2020 | -27.38% |
| 2019 | 6.05% |
MPC Dividends
| Ex-Dividend Date | Type | Payout Amount | Change | ||||||
|---|---|---|---|---|---|---|---|---|---|
| Loading, please wait... | |||||||||
Continue Researching MPC
Want to see what other sources are saying about Marathon Petroleum Corp's financials and stock price? Try the links below:Marathon Petroleum Corp (MPC) Stock Price | Nasdaq
Marathon Petroleum Corp (MPC) Stock Quote, History and News - Yahoo Finance
Marathon Petroleum Corp (MPC) Stock Price and Basic Information | MarketWatch
Loading social stream, please wait...