NextEra Energy Inc. (NEE): Price and Financial Metrics

NextEra Energy Inc. (NEE): $65.34

2.13 (-3.16%)

POWR Rating

Component Grades

Momentum

C

Stability

C

Sentiment

Quality

C

Add NEE to Watchlist
Sign Up

Industry: Utilities - Domestic

Industry

F

Ranked

#44 of 65

in industry

NEE Price/Volume Stats

Current price $65.34 52-week high $88.61
Prev. close $67.47 52-week low $65.27
Day low $65.27 Volume 9,042,500
Day high $67.19 Avg. volume 8,234,771
50-day MA $69.11 Dividend yield 2.79%
200-day MA $75.02 Market Cap 132.23B

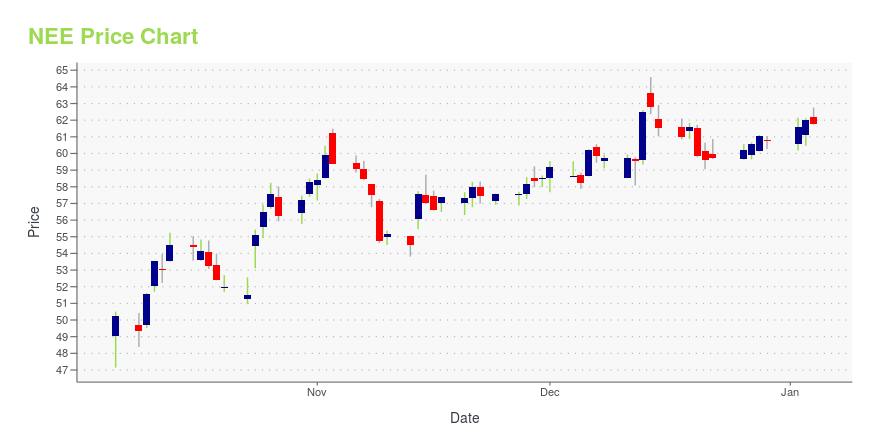
NEE Stock Price Chart Interactive Chart >

NEE POWR Grades

  • NEE scores best on the Quality dimension, with a Quality rank ahead of 60.38% of US stocks.
  • NEE's strongest trending metric is Momentum; it's been moving down over the last 177 days.
  • NEE's current lowest rank is in the Value metric (where it is better than 7.78% of US stocks).

NEE Stock Summary

  • NEE has a higher market value than 98.56% of US stocks; more precisely, its current market capitalization is $137,005,437,597.
  • Of note is the ratio of NEXTERA ENERGY INC's sales and general administrative expense to its total operating expenses; just 0.26% of US stocks have a lower such ratio.
  • In terms of twelve month growth in earnings before interest and taxes, NEXTERA ENERGY INC is reporting a growth rate of 257.56%; that's higher than 94.59% of US stocks.
  • If you're looking for stocks that are quantitatively similar to NEXTERA ENERGY INC, a group of peers worth examining would be BHP, COP, SBUX, IBN, and SO.
  • Visit NEE's SEC page to see the company's official filings. To visit the company's web site, go to www.nexteraenergy.com.

NEE Valuation Summary

  • NEE's price/sales ratio is 5.1; this is 200% higher than that of the median Utilities stock.
  • NEE's price/sales ratio has moved up 3.8 over the prior 243 months.

Below are key valuation metrics over time for NEE.

Stock Date P/S P/B P/E EV/EBIT
NEE 2023-09-22 5.1 3.1 16.9 17.5
NEE 2023-09-21 5.0 3.0 16.7 17.3
NEE 2023-09-20 5.1 3.0 16.8 17.4
NEE 2023-09-19 5.1 3.1 16.9 17.4
NEE 2023-09-18 5.1 3.1 17.1 17.5
NEE 2023-09-15 5.2 3.1 17.2 17.6

NEE Growth Metrics

    Its year over year price growth rate is now at -5.48%.
  • The year over year cash and equivalents growth rate now stands at 1.03%.
  • Its 2 year revenue growth rate is now at -17.78%.
Over the past 15 months, NEE's revenue has gone up $4,538,000,000.

The table below shows NEE's growth in key financial areas (numbers in millions of US dollars).

Date Revenue Operating Cash Flow Net Income to Common Stock
2022-12-31 20,956 8,262 4,147
2022-09-30 19,838 8,584 3,829
2022-06-30 17,489 8,851 2,580
2022-03-31 16,233 8,223 1,456
2021-12-31 17,069 7,553 3,573
2021-09-30 16,418 7,588 2,364

NEE's Quality Factors

The “Quality” component of the POWR Ratings focuses on 31 different factors of a companies fundamentals and operational strength. Here are some key insights as we drill into the specifics of these quality attributes.
  • NEE has a Quality Grade of C, ranking ahead of 60.46% of graded US stocks.
  • NEE's asset turnover comes in at 0.123 -- ranking 93rd of 105 Utilities stocks.
  • ORA, PPL, and PEG are the stocks whose asset turnover ratios are most correlated with NEE.

The table below shows NEE's key quality metrics over time.

Period Asset Turnover Gross Margin ROIC
2021-09-30 0.123 0.505 0.020
2021-06-30 0.129 0.533 0.025
2021-03-31 0.135 0.560 0.032
2020-12-31 0.145 0.595 0.032
2020-09-30 0.150 0.591 0.042
2020-06-30 0.160 0.603 0.044

NEE Price Target

For more insight on analysts targets of NEE, see our NEE price target page. And for a list of of all stocks sorted by upside potential based on analyst target price, see our Top Price Target page.

Average Price Target $91.24 Average Broker Recommendation 1.5 (Moderate Buy)

NextEra Energy Inc. (NEE) Company Bio


NextEra Energy, Inc. is an American energy company with about 46 gigawatts of generating capacity, revenues of over $17 billion in 2017, and about 14,000 employees throughout the US and Canada. It is the largest electric utility holding company by market capitalization. Its subsidiaries include Florida Power & Light (FPL), NextEra Energy ResourcesNextEra Energy PartnersGulf Power Company, and NextEra Energy Services. (Source:Wikipedia)


NEE Latest News Stream


Event/Time News Detail
Loading, please wait...

NEE Latest Social Stream


Loading social stream, please wait...

View Full NEE Social Stream

Latest NEE News From Around the Web

Below are the latest news stories about NEXTERA ENERGY INC that investors may wish to consider to help them evaluate NEE as an investment opportunity.

NextEra Energy announces appointment of Maria G. Henry to board of directors

NextEra Energy, Inc. (NYSE: NEE) announced the appointment of Maria G. Henry to its board of directors.

Yahoo | September 25, 2023

The 3 Best Wind Stocks to Buy Now: September 2023

This clean energy presents a perfect opportunity to take advantage of the explosive growth still to come.

John Blankenhorn on InvestorPlace | September 24, 2023

Down 33%, This High-Yield Dividend Stock Is a Brilliant Buy on the Dip

The past couple of years haven't been kind to Brookfield Renewable (NYSE: BEP)(NYSE: BEPC) shareholders. In this video, Motley Fool contributors Jason Hall and Tyler Crowe take a closer look at what's happened, why it's in a different situation from NextEra Energy (NYSE: NEE) subsidiary NextEra Energy Partners (NYSE: NEP), how it's similar to Clearway Energy (NYSE: CWEN)(NYSE: CWEN.

Yahoo | September 24, 2023

NextEra Energy (NEE) Stock Moves -0.65%: What You Should Know

NextEra Energy (NEE) closed the most recent trading day at $66.91, moving -0.65% from the previous trading session.

Yahoo | September 21, 2023

These 3 Stocks Have Plenty of Room to Run

Evaluating a company's growth prospects is vital. That's because profit growth typically drives a stock's returns over the long term. Agree Realty (NYSE: ADC), EnLink Midstream (NYSE: ENLC), and NextEra Energy Partners (NYSE: NEP) have tremendous growth runways.

Yahoo | September 21, 2023

Read More 'NEE' Stories Here

NEE Price Returns

1-mo -3.19%
3-mo -10.41%
6-mo -13.55%
1-year -17.46%
3-year -1.03%
5-year 76.35%
YTD -20.28%
2022 -8.54%
2021 23.39%
2020 30.06%
2019 42.69%
2018 14.30%

NEE Dividends

Ex-Dividend Date Type Payout Amount Change
Loading, please wait...
View Full NEE Dividend History

Continue Researching NEE

Want to see what other sources are saying about Nextera Energy Inc's financials and stock price? Try the links below:

Nextera Energy Inc (NEE) Stock Price | Nasdaq
Nextera Energy Inc (NEE) Stock Quote, History and News - Yahoo Finance
Nextera Energy Inc (NEE) Stock Price and Basic Information | MarketWatch

Get Free Updates

Join thousands of investors who get the latest news, insights and top rated picks from StockNews.com!