
Progress Software Corporation (PRGS): Price and Financial Metrics
PRGS Price/Volume Stats
| Current price | $57.89 | 52-week high | $62.34 |
| Prev. close | $57.44 | 52-week low | $48.00 |
| Day low | $57.47 | Volume | 306,651 |
| Day high | $58.22 | Avg. volume | 507,180 |
| 50-day MA | $52.42 | Dividend yield | 1.25% |
| 200-day MA | $53.14 | Market Cap | 2.48B |
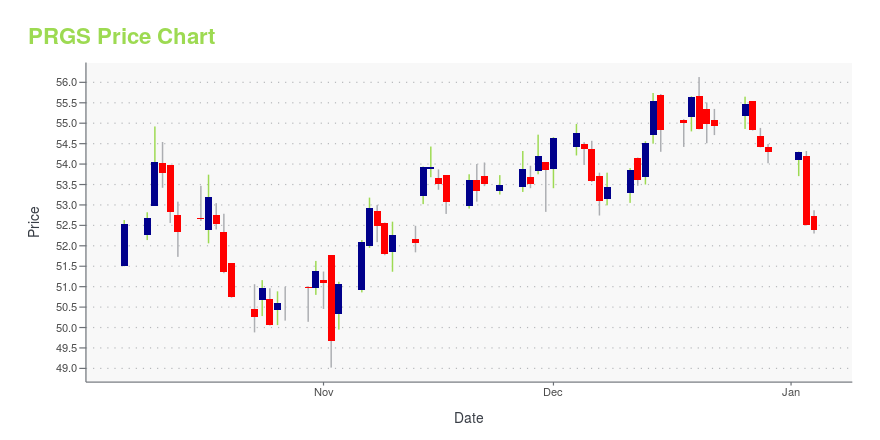
PRGS Stock Price Chart Interactive Chart >
Progress Software Corporation (PRGS) Company Bio
Dedicated to propelling business forward in a technology-driven world, Progress helps businesses drive faster cycles of innovation, fuel momentum and accelerate their path to success. As the trusted provider of the best products to develop, deploy and manage high-impact applications, Progress enables customers to develop the applications and experiences they need, deploy where and how they want and manage it all safely and securely. Hundreds of thousands of enterprises, including 1,700 software companies and 3.5 million developers, depend on Progress to achieve their goals—with confidence.
Latest PRGS News From Around the Web
Below are the latest news stories about PROGRESS SOFTWARE CORP that investors may wish to consider to help them evaluate PRGS as an investment opportunity.
Investors in Progress Software (NASDAQ:PRGS) have seen notable returns of 82% over the past five yearsWhen you buy and hold a stock for the long term, you definitely want it to provide a positive return. But more than... |
Progress Wins Gold in the 2023 SoftwareReviews Data Quadrant Awards for Metadata ManagementBased on user reviews, Progress Semaphore ranks #1 for the third consecutive year, with the highest marks for usability, breadth and quality of features, business value created and more BURLINGTON, Mass., Dec. 12, 2023 (GLOBE NEWSWIRE) -- Progress (Nasdaq: PRGS), the trusted provider of infrastructure software, today announced that Progress® Semaphore™, its metadata management and semantic AI platform, has been recognized as a gold medalist and overall leader in the 2023 Metadata Management Data |
Progress Recognized as a 2023 Gartner® Peer Insights™ Customers’ Choice for Digital Experience PlatformsLarge and midsize enterprise customers from around the world recommend the Progress Digital Experience (DX) Solution BURLINGTON, Mass., Nov. 29, 2023 (GLOBE NEWSWIRE) -- Progress (Nasdaq: PRGS), the trusted provider of application development and infrastructure software, today announced it has been recognized as a 2023 Gartner® Peer Insights™ Customers' Choice for Digital Experience Platforms (DXP)1. Based on feedback and ratings from end-user professionals, Progress is one of just four vendors |
What Is Progress Software Corporation's (NASDAQ:PRGS) Share Price Doing?While Progress Software Corporation ( NASDAQ:PRGS ) might not be the most widely known stock at the moment, it saw... |
Here's What We Like About Progress Software's (NASDAQ:PRGS) Upcoming DividendReaders hoping to buy Progress Software Corporation ( NASDAQ:PRGS ) for its dividend will need to make their move... |
PRGS Price Returns
| 1-mo | 5.37% |
| 3-mo | 15.41% |
| 6-mo | -0.21% |
| 1-year | 0.92% |
| 3-year | 32.09% |
| 5-year | 42.79% |
| YTD | 7.35% |
| 2023 | 8.94% |
| 2022 | 6.05% |
| 2021 | 8.44% |
| 2020 | 10.64% |
| 2019 | 18.95% |
PRGS Dividends
| Ex-Dividend Date | Type | Payout Amount | Change | ||||||
|---|---|---|---|---|---|---|---|---|---|
| Loading, please wait... | |||||||||
Continue Researching PRGS
Want to do more research on Progress Software Corp's stock and its price? Try the links below:Progress Software Corp (PRGS) Stock Price | Nasdaq
Progress Software Corp (PRGS) Stock Quote, History and News - Yahoo Finance
Progress Software Corp (PRGS) Stock Price and Basic Information | MarketWatch
Loading social stream, please wait...