
Silicon Motion Technology Corp. ADR (SIMO): Price and Financial Metrics
SIMO Price/Volume Stats
| Current price | $70.08 | 52-week high | $85.87 |
| Prev. close | $68.68 | 52-week low | $49.50 |
| Day low | $68.33 | Volume | 625,500 |
| Day high | $71.07 | Avg. volume | 414,332 |
| 50-day MA | $79.33 | Dividend yield | 2.64% |
| 200-day MA | $69.25 | Market Cap | 2.36B |
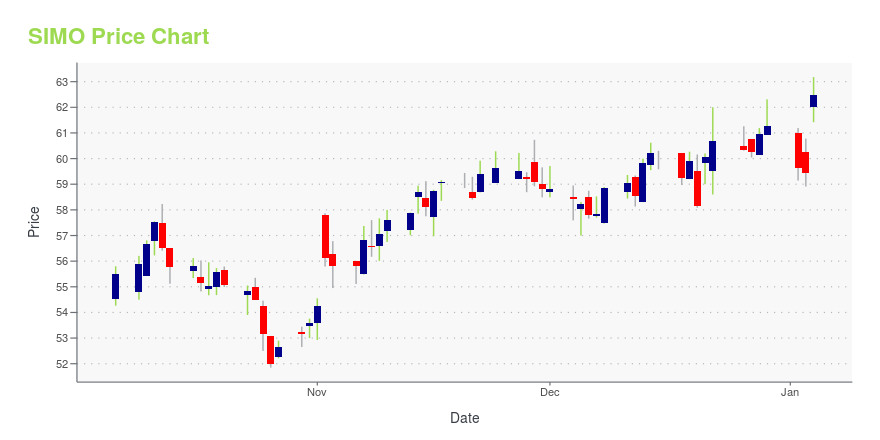
SIMO Stock Price Chart Interactive Chart >
Silicon Motion Technology Corp. ADR (SIMO) Company Bio
Silicon Motion Technology Corporation designs, develops and markets high performance, low-power semiconductor solutions to OEMs and other customers in the mobile storage and mobile communications markets. The company was founded in 1995 and is based in Zhubei City, Taiwan.
Latest SIMO News From Around the Web
Below are the latest news stories about SILICON MOTION TECHNOLOGY CORP that investors may wish to consider to help them evaluate SIMO as an investment opportunity.
Silicon Motion announces the Retirement of Mr. Yung-Chien Wang, the Appointment of Mr. Cain Lin and the Re-Election of Mr. Steve Chen to its Board of DirectorsTAIPEI, Taiwan and MILPITAS, Calif., Dec. 18, 2023 (GLOBE NEWSWIRE) -- Silicon Motion Technology Corporation (NasdaqGS: SIMO) (“Silicon Motion,” the “Company” or “we”), a global leader in designing and marketing NAND flash controllers for solid-state storage devices, today, announced the election of Mr. Cain Lin to its board of directors (the “Board”) following the retirement of Mr. Yung-Chien Wang as well as the re-election of Mr. Steve Chen to its board of directors following the annual shareh |
Silicon Motion (SIMO) Restructures Businesses to Spur GrowthThe dedicated business units will enable Silicon Motion (SIMO) to develop the most advanced controller technology and deliver industry-leading solutions to tap new market segments for long-term growth. |
Silicon Motion Announces New Organizational Structure to Support Continued Global Business GrowthEstablishes Two Dedicated Business Units and Appoints Senior Leaders to Oversee Growth and Further Market ExpansionTAIPEI, Taiwan and MILPITAS, Calif., Dec. 11, 2023 (GLOBE NEWSWIRE) -- Silicon Motion Technology Corporation (NasdaqGS: SIMO) (“Silicon Motion,” the “Company” or “we”), a global leader in designing and marketing NAND flash controllers for solid-state storage devices, today, announced a new organizational structure and leadership team appointments to support the Company’s continued g |
Tech With Benefits: 7 Stocks Offering Growth and Passive IncomeWhile innovation typically coincides exclusively with a growth-centric business model, that’s not always the case as these tech stocks to buy for growth and passive income demonstrates. |
7 F-Rated AI Stocks to Skip in NovemberAI stocks are popular in 2023 and that will likely continue into 2024, but the names on this list are AI stocks to avoid right now. |
SIMO Price Returns
| 1-mo | -12.50% |
| 3-mo | -3.85% |
| 6-mo | 14.02% |
| 1-year | 36.44% |
| 3-year | 22.52% |
| 5-year | 93.12% |
| YTD | 15.94% |
| 2023 | -4.92% |
| 2022 | -30.38% |
| 2021 | 101.82% |
| 2020 | -1.83% |
| 2019 | 51.80% |
SIMO Dividends
| Ex-Dividend Date | Type | Payout Amount | Change | ||||||
|---|---|---|---|---|---|---|---|---|---|
| Loading, please wait... | |||||||||
Continue Researching SIMO
Here are a few links from around the web to help you further your research on Silicon Motion Technology CORP's stock as an investment opportunity:Silicon Motion Technology CORP (SIMO) Stock Price | Nasdaq
Silicon Motion Technology CORP (SIMO) Stock Quote, History and News - Yahoo Finance
Silicon Motion Technology CORP (SIMO) Stock Price and Basic Information | MarketWatch
Loading social stream, please wait...