
Union Bankshares, Inc. (UNB): Price and Financial Metrics
UNB Price/Volume Stats
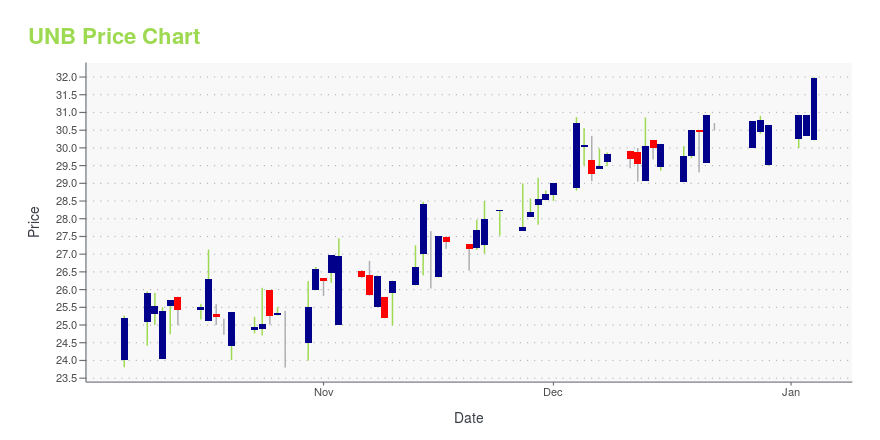
| Current price | $26.13 | 52-week high | $32.00 |
| Prev. close | $25.10 | 52-week low | $20.07 |
| Day low | $24.38 | Volume | 9,385 |
| Day high | $26.13 | Avg. volume | 4,738 |
| 50-day MA | $23.07 | Dividend yield | 5.58% |
| 200-day MA | $27.38 | Market Cap | 118.08M |
UNB Stock Price Chart Interactive Chart >
Union Bankshares, Inc. (UNB) Company Bio
Union Bankshares, Inc. provides retail, commercial, and municipal banking services in northern Vermont and northwestern New Hampshire. The company was founded in 1891 and is based in Morrisville, Vermont.
Latest UNB News From Around the Web
Below are the latest news stories about UNION BANKSHARES INC that investors may wish to consider to help them evaluate UNB as an investment opportunity.
Union Bankshares Inc (UNB) Reports Q3 2023 Earnings and Declares Quarterly Dividend Amidst ...Net income for Q3 2023 stands at $2.5 million, marking a decrease from the same period in 2022 |
Union Bankshares Announces Earnings for the three months and nine months ended September 30, 2023 and Declares Quarterly DividendMORRISVILLE, Vt., Oct. 18, 2023 (GLOBE NEWSWIRE) -- Union Bankshares, Inc. (NASDAQ - UNB) today announced results for the three and nine months ended September 30, 2023 and declared a regular quarterly cash dividend. Consolidated net income for the three months ended September 30, 2023 was $2.5 million, or $0.56 per share, compared to $3.8 million, or $0.84 cents per share, for the same period in 2022, and $8.2 million, or $1.82 per share, for the nine months ended September 30, 2023, compared t |
Insider Buying: Union Bankshares Inc President & CEO David Silverman Acquires 500 SharesOn September 13, 2023, David Silverman, President & CEO of Union Bankshares Inc (NASDAQ:UNB), purchased 500 shares of the company, signaling a strong vote of confidence in the firm's prospects. |
Union Bankshares Announces Earnings for the three months and six months ended June 30, 2023 and Declares Quarterly DividendMORRISVILLE, Vt., July 19, 2023 (GLOBE NEWSWIRE) -- Union Bankshares, Inc. (NASDAQ - UNB) today announced results for the three and six months ended June 30, 2023 and declared a regular quarterly cash dividend. Consolidated net income for the three months ended June 30, 2023 was $2.7 million, or $0.60 per share, compared to $2.9 million, or $0.65 cents per share, for the same period in 2022, and $5.7 million, or $1.26 per share, for the six months ended June 30, 2023, compared to $5.4 million, o |
Union Bankshares, Inc. (NASDAQ:UNB) Passed Our Checks, And It's About To Pay A US$0.36 DividendUnion Bankshares, Inc. ( NASDAQ:UNB ) stock is about to trade ex-dividend in 3 days. Typically, the ex-dividend date is... |
UNB Price Returns
| 1-mo | 24.34% |
| 3-mo | -5.69% |
| 6-mo | -12.08% |
| 1-year | 16.23% |
| 3-year | -5.05% |
| 5-year | -2.93% |
| YTD | -11.34% |
| 2023 | 35.30% |
| 2022 | -15.44% |
| 2021 | 21.05% |
| 2020 | -25.20% |
| 2019 | -21.52% |
UNB Dividends
| Ex-Dividend Date | Type | Payout Amount | Change | ||||||
|---|---|---|---|---|---|---|---|---|---|
| Loading, please wait... | |||||||||
Continue Researching UNB
Want to do more research on Union Bankshares Inc's stock and its price? Try the links below:Union Bankshares Inc (UNB) Stock Price | Nasdaq
Union Bankshares Inc (UNB) Stock Quote, History and News - Yahoo Finance
Union Bankshares Inc (UNB) Stock Price and Basic Information | MarketWatch
Loading social stream, please wait...