
WEC Energy Group Inc. (WEC): Price and Financial Metrics
WEC Price/Volume Stats
| Current price | $83.73 | 52-week high | $92.83 |
| Prev. close | $83.32 | 52-week low | $75.13 |
| Day low | $83.25 | Volume | 1,595,048 |
| Day high | $83.97 | Avg. volume | 2,102,910 |
| 50-day MA | $80.45 | Dividend yield | 4.09% |
| 200-day MA | $81.31 | Market Cap | 26.44B |
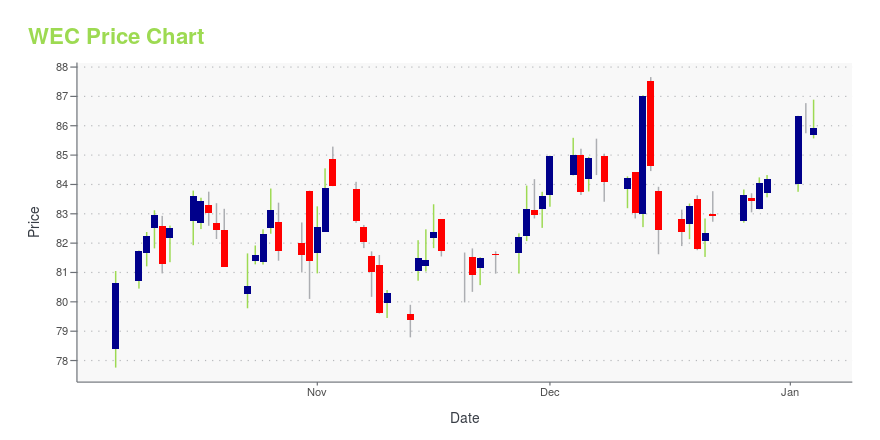
WEC Stock Price Chart Interactive Chart >
WEC Energy Group Inc. (WEC) Company Bio
WEC Energy Group is an American company based in Milwaukee, Wisconsin that provides electricity and natural gas to 4.4 million customers across four states. (Source:Wikipedia)
Latest WEC News From Around the Web
Below are the latest news stories about WEC ENERGY GROUP INC that investors may wish to consider to help them evaluate WEC as an investment opportunity.
WEC Energy Group (NYSE:WEC) Is Increasing Its Dividend To $0.835The board of WEC Energy Group, Inc. ( NYSE:WEC ) has announced that the dividend on 1st of March will be increased to... |
5 big dividends & buybacks this week: AutoZone, RayonierHere is your Pro Recap of the biggest dividend hikes, special dividends, and share-buyback announcements you may have missed this week. AutoZone (NYSE:AZO) declared that its Board of Directors approved an additional $2.0 billion for the buyback of the company's common stock, as a part of its continuing share repurchase program. Since this program began in 1998, the Board of Directors has now authorized a total of $37.7B for stock repurchases. |
WEC Energy (WEC) Rewards Shareholders With 7% Dividend HikeWEC Energy (WEC) continues to increase shareholders' value, as its board of directors approves a 7% quarterly dividend hike. |
WEC Energy Group announces plan to increase dividend by 7 percentThe board of directors of WEC Energy Group (NYSE: WEC) today announced that it is planning to raise the quarterly dividend on the company's common stock to 83.50 cents per share in the first quarter of 2024. This would represent an increase of 5.5 cents per share, or 7 percent. |
13 Most Profitable Utility Stocks NowIn this piece, we will take a look at the 13 most profitable utility stocks to buy now. If you want to skip our analysis of the utility industry and the recent developments, then you can take a look at the 5 Most Profitable Utility Stocks Now. The utility industry stands to be disrupted the […] |
WEC Price Returns
| 1-mo | 7.14% |
| 3-mo | 3.76% |
| 6-mo | 7.01% |
| 1-year | -3.86% |
| 3-year | -4.04% |
| 5-year | 12.91% |
| YTD | 1.54% |
| 2023 | -7.00% |
| 2022 | -0.45% |
| 2021 | 8.66% |
| 2020 | 2.48% |
| 2019 | 37.05% |
WEC Dividends
| Ex-Dividend Date | Type | Payout Amount | Change | ||||||
|---|---|---|---|---|---|---|---|---|---|
| Loading, please wait... | |||||||||
Continue Researching WEC
Here are a few links from around the web to help you further your research on Wec Energy Group Inc's stock as an investment opportunity:Wec Energy Group Inc (WEC) Stock Price | Nasdaq
Wec Energy Group Inc (WEC) Stock Quote, History and News - Yahoo Finance
Wec Energy Group Inc (WEC) Stock Price and Basic Information | MarketWatch
Loading social stream, please wait...