
Williams Cos. (WMB): Price and Financial Metrics
WMB Price/Volume Stats
| Current price | $42.52 | 52-week high | $45.10 |
| Prev. close | $41.82 | 52-week low | $32.49 |
| Day low | $41.84 | Volume | 5,567,552 |
| Day high | $42.68 | Avg. volume | 6,579,944 |
| 50-day MA | $41.94 | Dividend yield | 4.31% |
| 200-day MA | $37.59 | Market Cap | 51.82B |
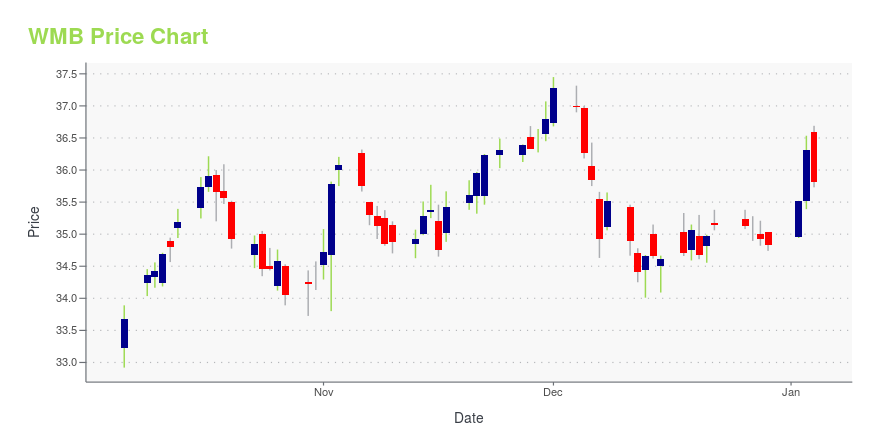
WMB Stock Price Chart Interactive Chart >
Williams Cos. (WMB) Company Bio
The Williams Companies, Inc., is an American energy company based in Tulsa, Oklahoma. Its core business is natural gas processing and transportation, with additional petroleum and electricity generation assets. A Fortune 500 company, its common stock is a component of the S&P 500. (Source:Wikipedia)
Latest WMB News From Around the Web
Below are the latest news stories about WILLIAMS COMPANIES INC that investors may wish to consider to help them evaluate WMB as an investment opportunity.
Here's Why Hold Strategy is Apt for ConocoPhillips (COP) NowFavorable oil price is aiding ConocoPhillips' (COP) bottom line. However, increasing production and operating expenses are hurting it. |
3 Energy Stocks With Solid Earnings Estimate Revisions for '24A favorable business environment in the energy space has heightened the need to bet on The Williams Companies (WMB), Western Midstream (WES) and Murphy USA (MUSA). |
Eni (E) Strengthens Position as U.K.'s Leading CCS OperatorEni (E) accelerates the U.K.'s carbon capture journey through the expansion of HyNet, while also revealing the CCUS Vision and outlining plans for a second CCUS facility, the Bacton Energy Hub. |
Williams (WMB) to Buy Gas Storage Portfolio for $1.95 BillionWilliams (WMB) is set to acquire a $1.95B natural gas assets portfolio in the Gulf Coast, establishing a strong hold over the rapidly evolving energy landscape. |
This 5.1%-Yielding Dividend Stock Makes a $2 Billion Acquisition to Add More Fuel to Its Dividend Growth EngineWilliams is using its financial flexibility to enhance its growth prospects. |
WMB Price Returns
| 1-mo | 0.54% |
| 3-mo | 9.56% |
| 6-mo | 24.98% |
| 1-year | 31.32% |
| 3-year | 97.72% |
| 5-year | 130.09% |
| YTD | 25.12% |
| 2023 | 11.85% |
| 2022 | 32.83% |
| 2021 | 38.36% |
| 2020 | -8.20% |
| 2019 | 14.18% |
WMB Dividends
| Ex-Dividend Date | Type | Payout Amount | Change | ||||||
|---|---|---|---|---|---|---|---|---|---|
| Loading, please wait... | |||||||||
Continue Researching WMB
Want to see what other sources are saying about Williams Companies Inc's financials and stock price? Try the links below:Williams Companies Inc (WMB) Stock Price | Nasdaq
Williams Companies Inc (WMB) Stock Quote, History and News - Yahoo Finance
Williams Companies Inc (WMB) Stock Price and Basic Information | MarketWatch
Loading social stream, please wait...