So, one could make the case that the late January/early February drop of 2018 was more like October 2014 and this could be like August/October 2015. The time periods are eerily similar too; the 2014-2015 period was 10 months apart and we are currently about nine months removed from the early 2018 lows.
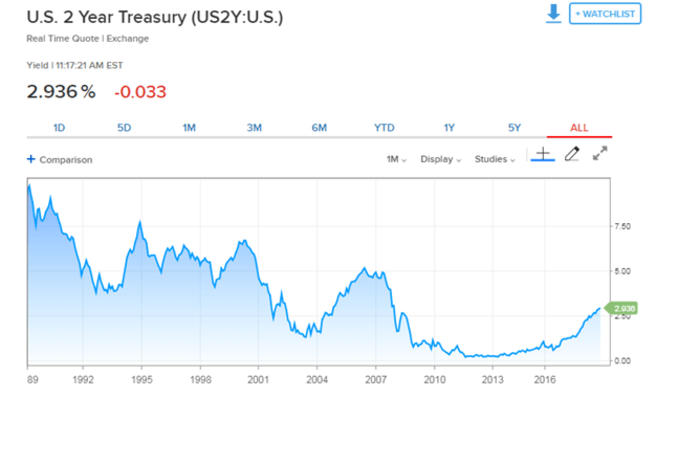
Source: stockcharts.com
While the shape of the top is very different now from 2015, it looks like the October 2014 swoon and the subsequent rebound to a higher high that ultimately failed to hold looks similar as does the weak rebound and resumption of selling into October 2015 to the early 2018 decline and rebound.
Source:Stockcharts.com
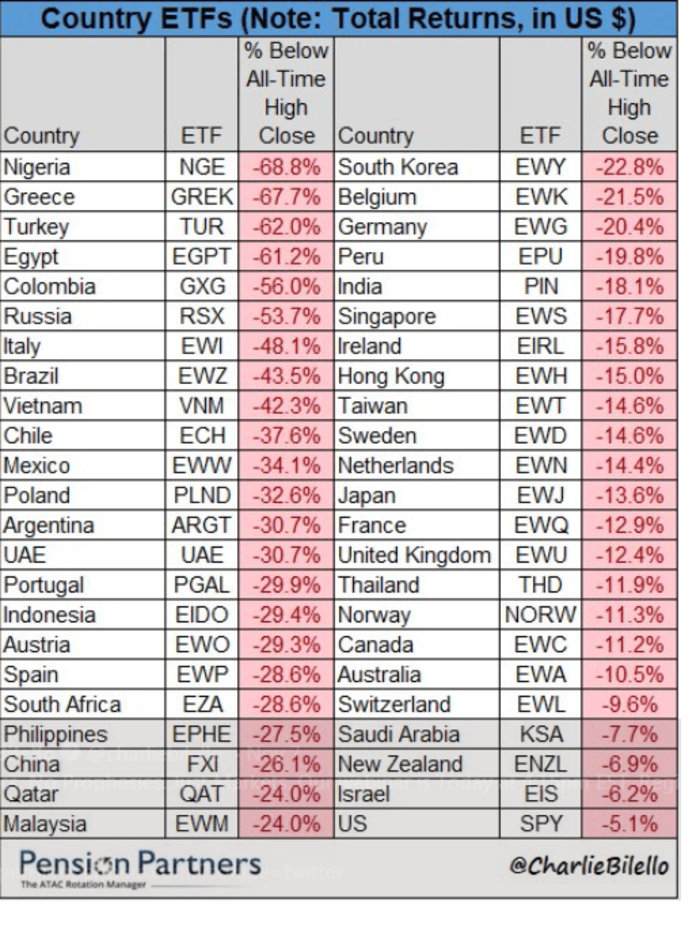
Other similarities include the decline in breadth which I characterized as a rolling bear market as numerous sectors have already declined by 25% or more.
All this is to say that if history is to repeat, or even rhyme, stocks could be in for very rough start to 2019.
About the Author: Steve Smith

Steve has more than 30 years of investment experience with an expertise in options trading. He’s written for TheStreet.com, Minyanville and currently for Option Sensei. Learn more about Steve’s background, along with links to his most recent articles. More...
9 "Must Own" Growth Stocks For 2019
Get Free Updates
Join thousands of investors who get the latest news, insights and top rated picks from StockNews.com!
Top Stories on StockNews.com

3 Tech Stocks Offering Long-Term Investment Opportunities
In today's tech-driven world, businesses are digitizing their operations and adopting cutting-edge technologies, thereby driving the tech industry's growth. Against this backdrop, fundamentally strong tech stocks Motorola Solutions (MSI), Dolby Laboratories (DLB), and TaskUs (TASK) could be ideal long-term additions to one’s portfolio. Read more...
3 Energy Stocks Poised for Rapid Growth in May
Oil and gas prices have been surging lately due to an improving demand outlook and persistent supply risks amid geopolitical tensions, creating tailwinds for the energy sector. Thus, it could be wise to invest in fundamentally sound energy stocks Cenovus Energy (CVE), Weatherford International (WFRD), and Gulf Island Fabrication (GIFI) for rapid growth in May. Read on…
Tech Stocks Paving the Way for Bullish Investment Gains in May
The technology industry is growing rapidly owing to the incorporation of cutting-edge technologies and increased spending on digitization. Given this backdrop, investors could consider buying quality tech stocks Ricoh Company (RICOY), AvePoint (AVPT), and RADCOM (RDCM). Read on...Exxon Mobil (XOM) Earnings Analysis: Ideal Time to Buy?
While the energy sector demonstrated resilience last year, falling natural gas prices could pose challenges this year. Industry leader Exxon Mobil (XOM) recently released its earnings, which paints an unclear picture. Let's analyze and find out if now could be an ideal time to buy the stock. Read on to find out...