
E-commerce and cloud computing giant Amazon.com, Inc. (AMZN - Get Rating) recently got clearance from Britain’s competition regulator to acquire Roomba vacuum cleaner maker iRobot Corporation (IRBT - Get Rating) for $1.7 billion. The Competition and Markets Authority (CMA) concluded that the deal would not lead to competition concerns in the United Kingdom.
However, EU antitrust regulators are also looking into it and will decide by July 6 whether to clear the deal. On top of it, the U.S. Federal Trade Commission is widely expected to file an antitrust lawsuit against AMZN. Moreover, Bernstein analysts published an open letter to AMZN CEO Andy Jessy and the board stating that the company has spent heavily in some areas without seeing results.
Bernstein’s Mark Shmulik said, “But what we’ve seen recently is a company simply pursuing too many ideas, with weaker ideas taking away the oxygen, capital, and most importantly focus from the truly disruptive initiatives that ‘only Amazon can do.’”
Hence, let’s look at the trends of some of its key financial metrics to understand why it could be wise to wait for a better entry point in the stock.
Amazon’s Net Income Trends: A Rollercoaster of Growth and Decline from 2020-2023
The following is a summary of AMZN’s trailing-12-month net income trends and fluctuations over the reported period:
- June 2020: $13.18 billion
- September 2020: $17.38 billion
- December 2020: $21.33 billion
- March 2021: $26.90 billion
- June 2021: $29.44 billion
- September 2021: $26.26 billion
- December 2021: $33.36 billion
- March 2022: $21.41 billion
- June 2022: $11.61 billion
- September 2022: $11.32 billion
- December 2022: -$2.72 billion
- March 2023: $4.29 billion
AMZN’s net income experienced an overall upward trend from June 2020 to December 2021. However, this trend is followed by a significant decrease in net income from December 2021 to March 2022, with two subsequent quarters in 2022 showing a decline in net income.
The most recent data point, March 2023, reflects an increase in net income to $4.29 billion, which is a recovery from the negative net income observed in December 2022. The growth rate between the first value ($13.18 billion) and the last value ($4.29 billion) is approximately -67.45%.

AMZN has experienced a consistent upward trend in its trailing-12-month revenue over the period from June 2020 to March 2023. The data highlights significant fluctuations and growth during this timeframe. Here is a summary of the key points:
- June 2020: $321.78 billion
- September 2020: $347.95 billion (7.33% growth since June 2020)
- December 2020: $386.06 billion (10.96% growth since September 2020)
- March 2021: $419.13 billion (8.56% growth since December 2020)
- June 2021: $443.30 billion (5.77% growth since March 2021)
- September 2021: $457.97 billion (3.32% growth since June 2021)
- December 2021: $469.82 billion (2.59% growth since September 2021)
- March 2022: $477.75 billion (1.69% growth since December 2021)
- June 2022: $485.90 billion (1.71% growth since March 2022)
- September 2022: $502.19 billion (3.34% growth since June 2022)
- December 2022: $513.98 billion (2.35% growth since September 2022)
- March 2023: $524.90 billion (2.12% growth since December 2022)
The overall growth rate between the first value (June 2020) and the last value (March 2023) is 62.91%. Despite some minor fluctuations, AMZN’s revenue shows a generally stable positive trend throughout the data series.

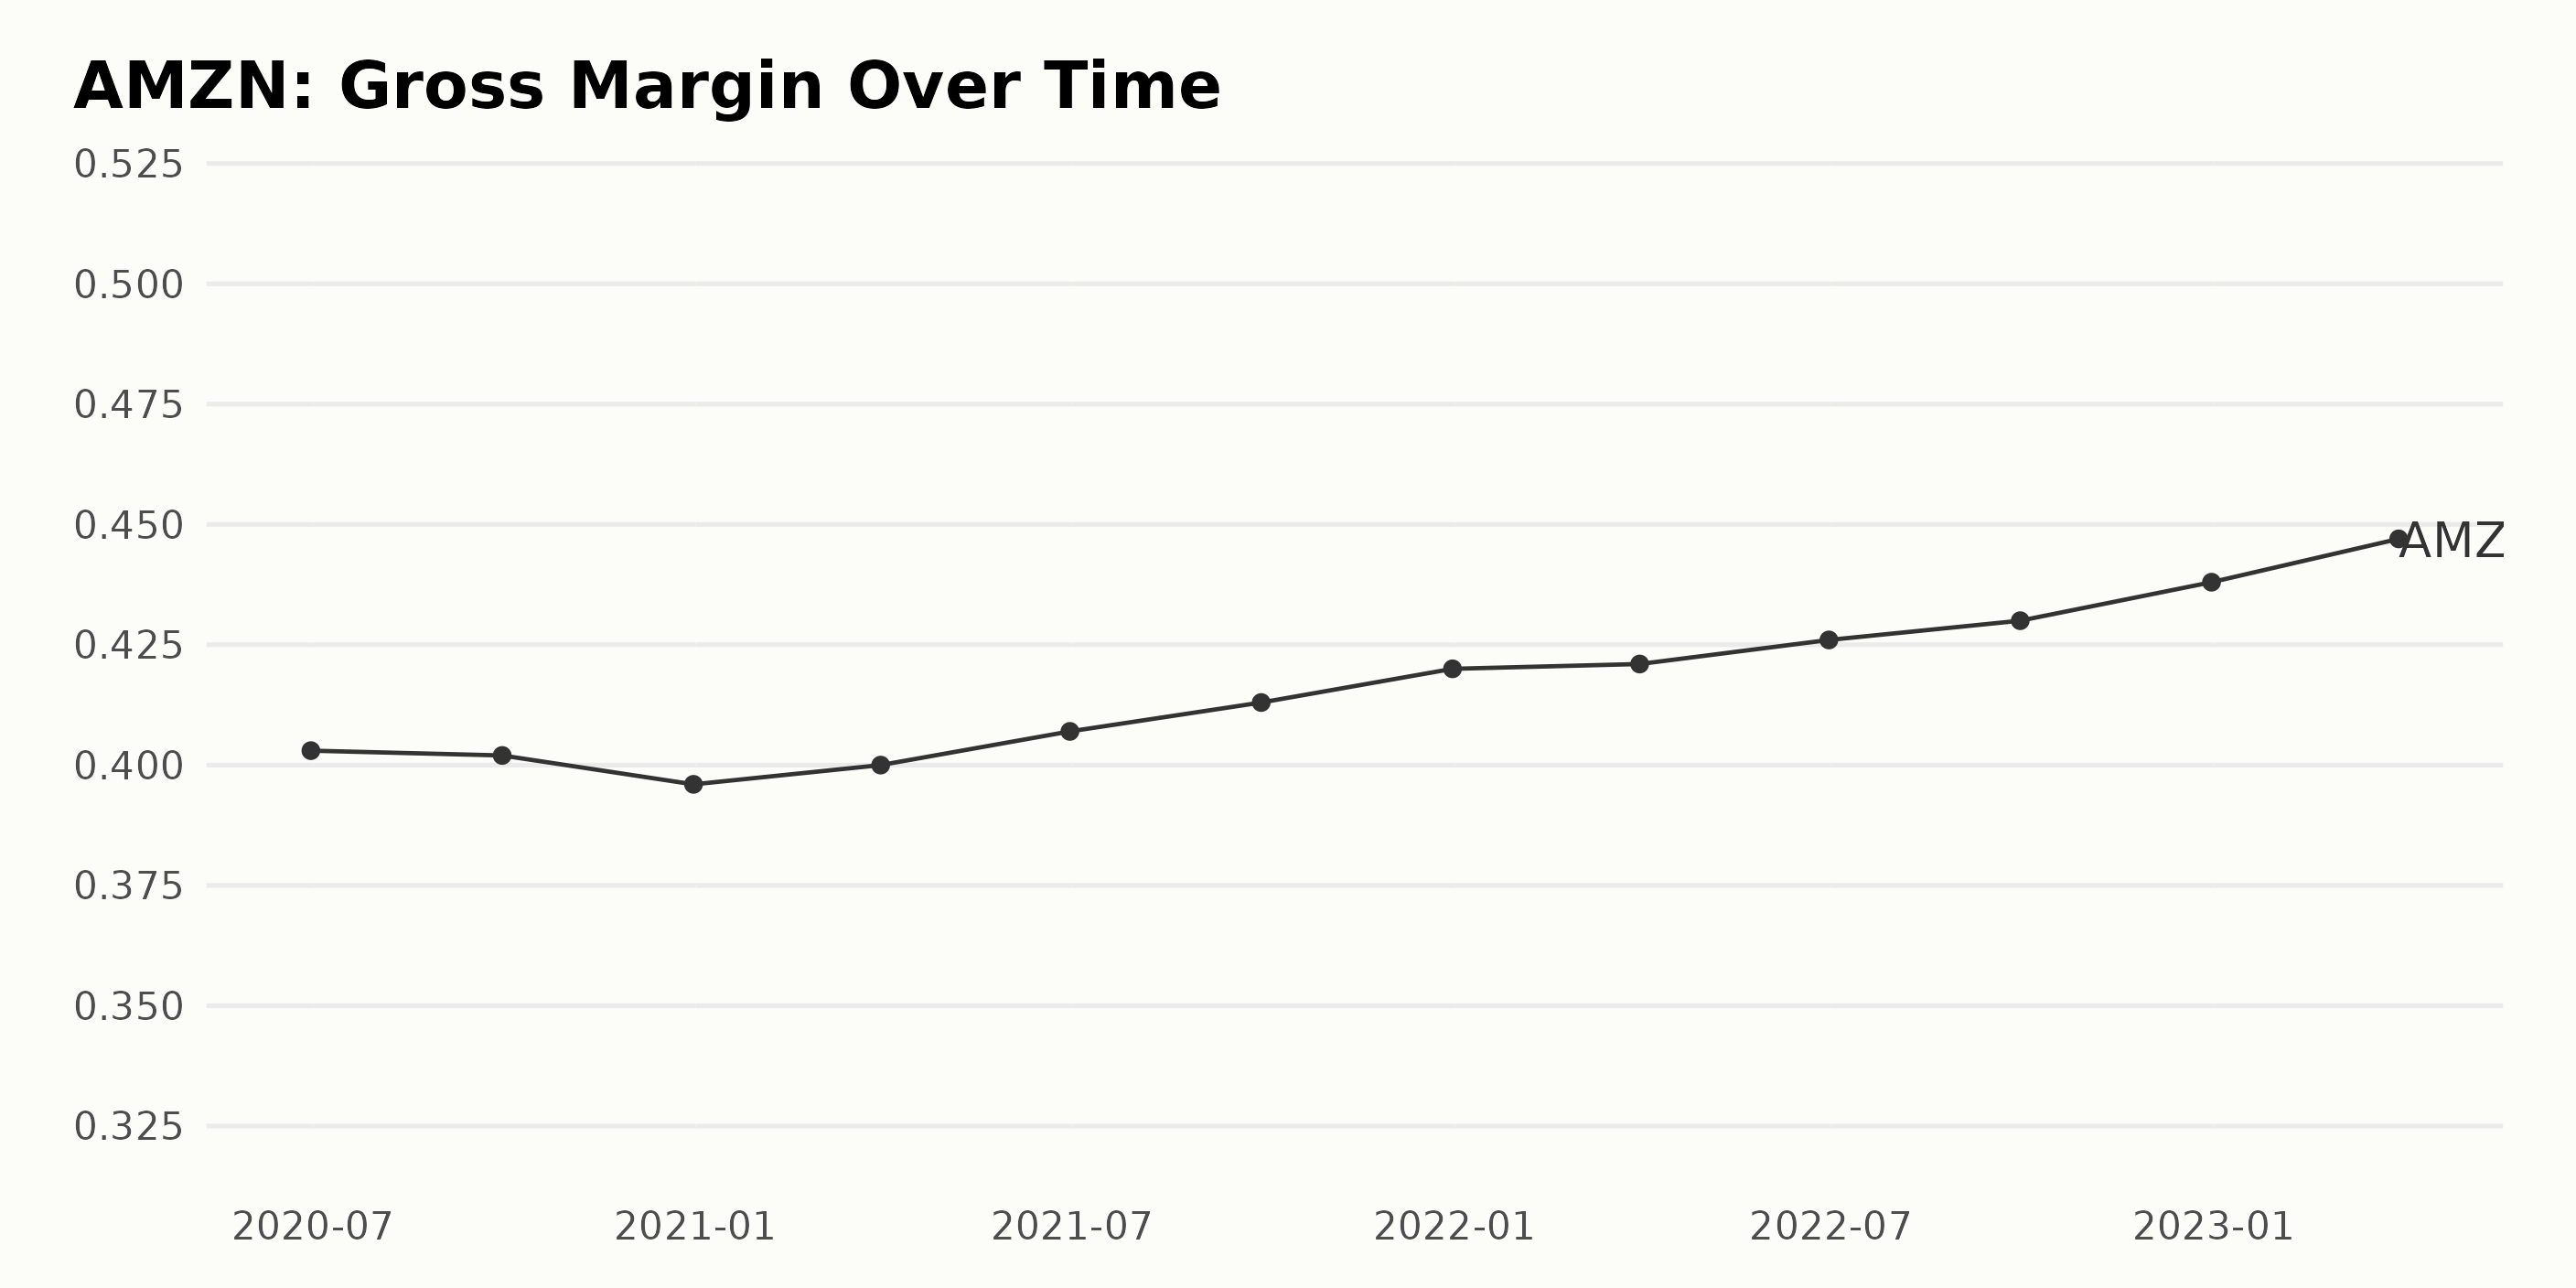
The gross margin for AMZN has shown a general upward trend, with minor fluctuations over the analyzed period. Below is a summary of the data:
- June 2020: 40.3%
- September 2020: 40.2%
- December 2020: 39.6%
- March 2021: 40.0%
- June 2021: 40.7%
- September 2021: 41.3%
- December 2021: 42.0%
- March 2022: 42.1%
- June 2022: 42.6%
- September 2022: 43.0%
- December 2022: 43.8%
- March 2023: 44.7%
Emphasizing the recent data and the last value in the series, we observe that the gross margin has increased since September 2022, reaching 44.7% in March 2023. Calculating the growth rate by measuring the last value (44.7%) from the first value (40.3%) shows an overall increase of approximately 4.4 percentage points during this period.
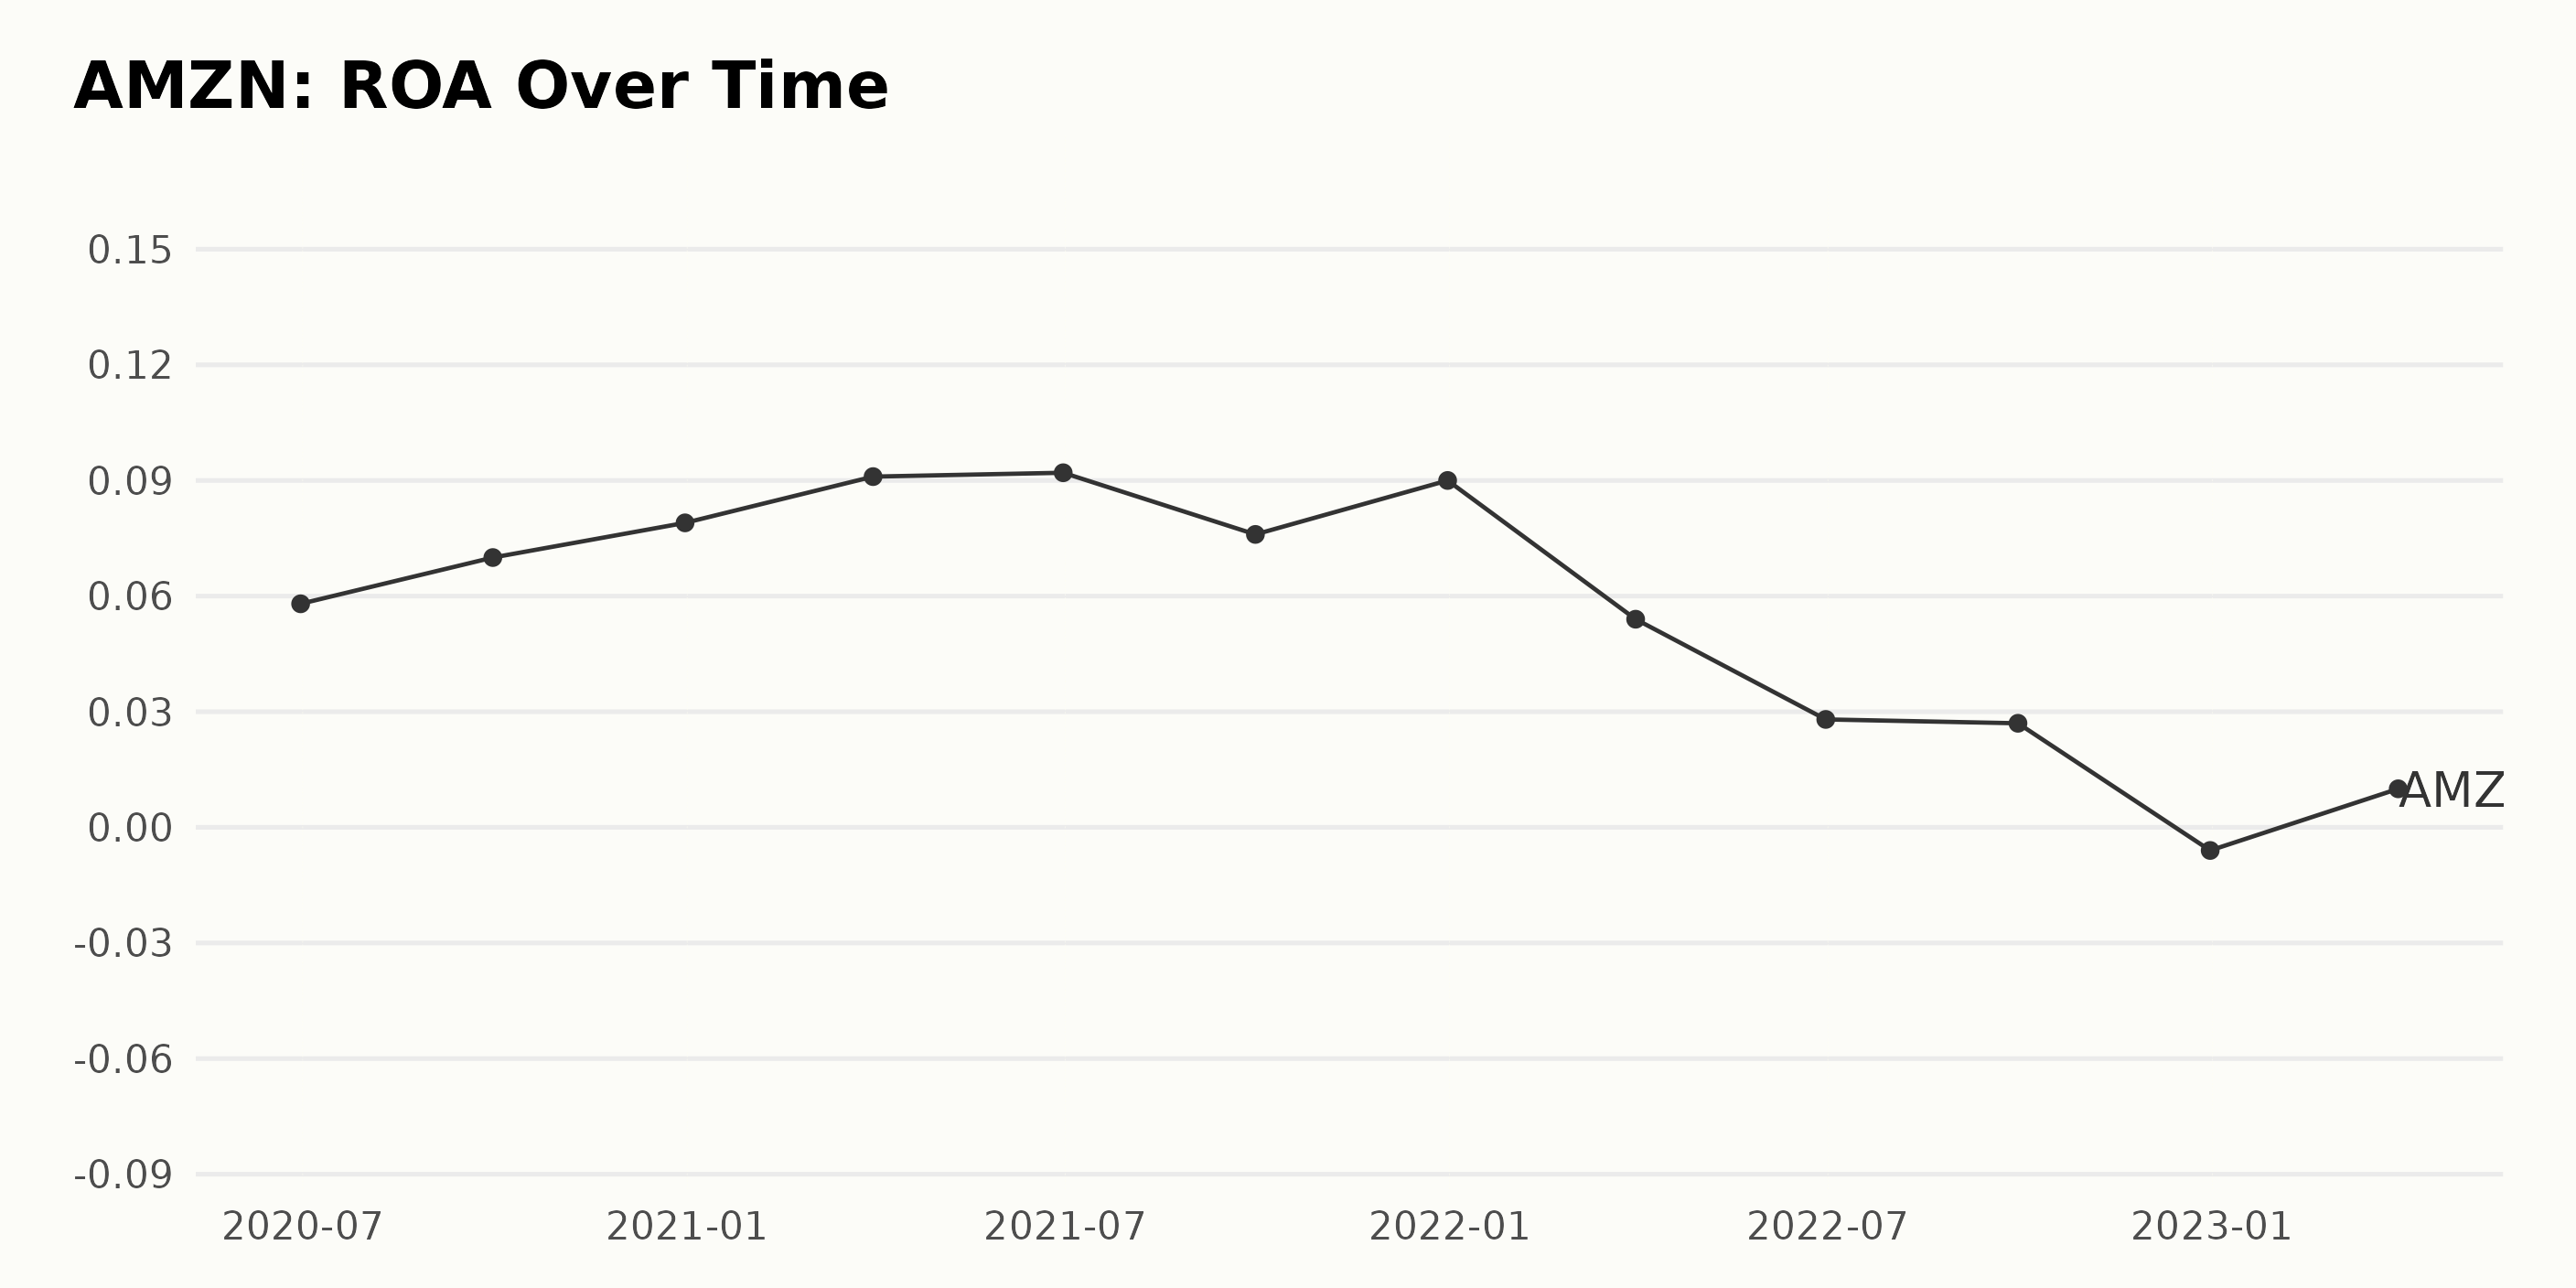
The Return On Assets (ROA) of AMZN has shown fluctuations over the given period:
- June 2020: 5.8%
- September 2020: 7.0%
- December 2020: 7.9%
- March 2021: 9.1%
- June 2021: 9.2%
- September 2021: 7.6%
- December 2021: 9.0%
- March 2022: 5.4%
- June 2022: 2.8%
- September 2022: 2.7%
- December 2022: -0.6%
- March 2023: 1.0%
Putting greater emphasis on more recent data and the last value in the series, the ROA in March 2023 is 1.0%, showing a decrease compared to the ROA in June 2020, at 5.8%. Between June 2020 and March 2023, the overall growth rate is negative, with ROA decreasing by approximately 4.8 percentage points. Throughout this period, the highest ROA was registered in June 2021 at 9.2%.
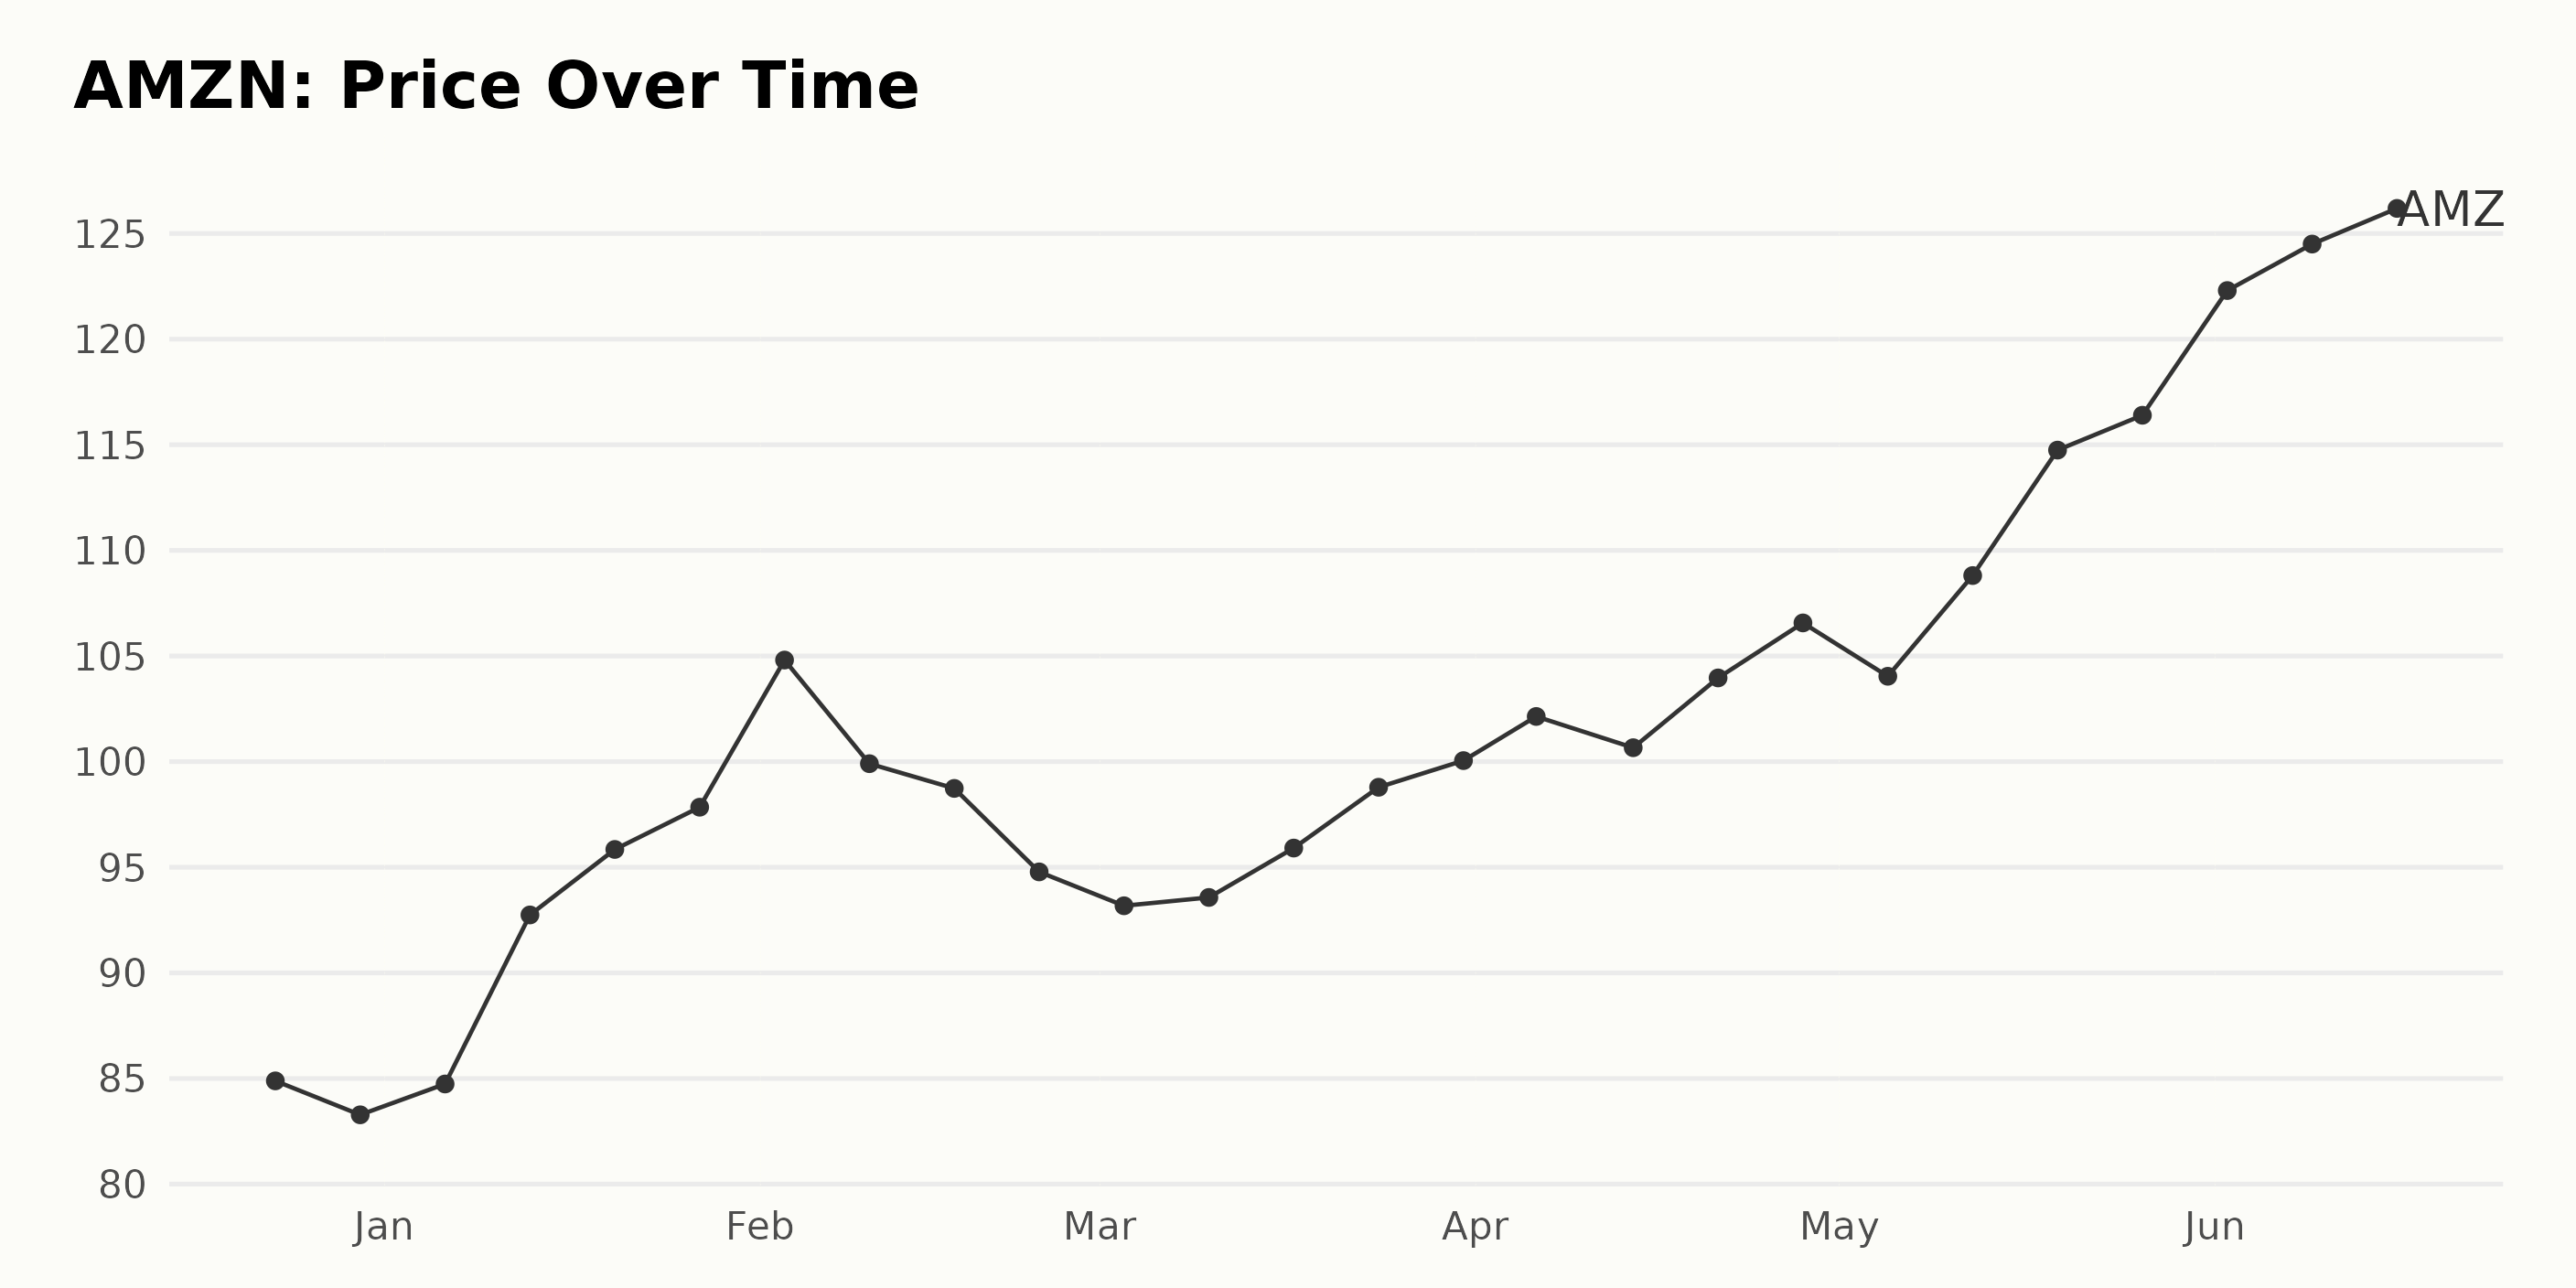
Amazon Share Prices: A Six-Month Analysis (December 2022-June 2023)
The trend and growth rate of AMZN share prices from December 23, 2022, to June 16, 2023, show an overall upward trajectory with some fluctuations.
The growth rate accelerates significantly from January 13, 2023, to February 3, 2023, followed by a relatively moderate deceleration through March 3, 2023. The share price then experiences slight fluctuations before accelerating again from April 6, 2023, onwards. Here is a chart of AMZN’s price over the past 180 days.
Amazon’s POWR Ratings: Examining Growth, Sentiment, and Quality Trends
As of June 19, 2023, the latest POWR Ratings grade for AMZN is a C, which equates to Neutral. The stock belongs to the Internet industry, which encompasses a total of 58 stocks.
Based on the rank-in-category data, AMZN has consistently maintained a middle-range rank, where lower values signify a superior rank. Here’s an overview of AMZN’s recent performance:
- December 24, 2022: POWR Grade of C and Rank in Category of #31
- January 2023: POWR Grade remains at C, with Rank in Category fluctuating between #29 and #30
- February 2023: POWR Grade at C, Rank in Category ranges from #19 to #33
- March 2023: POWR Grade continues at C, Rank in Category stays between #24 and #25
- April 2023: POWR Grade at C, Rank in Category varies between #20 and #25
- May 2023: POWR Grade holds at C, Rank in Category increases from #15 to #17
- June 2023 (up to June 19): POWR Grade at C with Rank in Category steady at #16
While the POWR Ratings grade hasn’t changed much in the given period, AMZN’s rank in its category experienced some fluctuation before settling at its current position of 17.
AMZN has experienced fluctuations in its POWR Ratings across different dimensions from December 31, 2022, to June 17, 2023. The three most noteworthy dimensions are Growth, Sentiment, and Quality.
- Growth: AMZN’s Growth score experienced a significant increase during this period, moving from a rating of 17 on December 31, 2022, to reach an impressive rating of 86 by June 17, 2023.
- Sentiment: Sentiment also showed substantial improvements. The rating started at 70 on December 31, 2022, and peaked at 99 on June 17, 2023, indicating positive market perceptions about the company.
- Quality: Throughout the period, AMZN maintained consistently high-Quality scores. Starting with a rating of 76 on December 31, 2022, it reached 79 on January 31, 2023, and remained above 75 until June 17, 2023.
These trends demonstrate positive shifts in AMZN’s Growth and Sentiment dimensions, along with a consistently strong Quality score over the specified period.

How does Amazon.com, Inc. (AMZN) Stack Up Against its Peers?
Other stocks in the Internet sector that may be worth considering are trivago N.V. (TRVG - Get Rating), Yelp Inc. (YELP - Get Rating), and Travelzoo (TZOO - Get Rating) – they have better POWR Ratings.
What To Do Next?
Discover 10 widely held stocks that our proprietary model shows have tremendous downside potential. Please make sure none of these “death trap” stocks are lurking in your portfolio:
Want More Great Investing Ideas?
AMZN shares were trading at $125.49 per share on Monday afternoon, down $1.62 (-1.27%). Year-to-date, AMZN has gained 49.39%, versus a 15.35% rise in the benchmark S&P 500 index during the same period.
About the Author: Anushka Dutta

Anushka is an analyst whose interest in understanding the impact of broader economic changes on financial markets motivated her to pursue a career in investment research. More...
More Resources for the Stocks in this Article
| Ticker | POWR Rating | Industry Rank | Rank in Industry |
| AMZN | Get Rating | Get Rating | Get Rating |
| IRBT | Get Rating | Get Rating | Get Rating |
| TRVG | Get Rating | Get Rating | Get Rating |
| YELP | Get Rating | Get Rating | Get Rating |
| TZOO | Get Rating | Get Rating | Get Rating |


