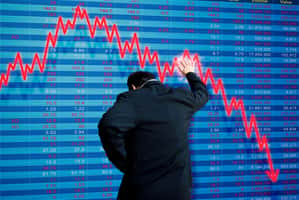
Stocks had a big reversal yesterday and swung wildly today. This comes just as we enter earnings season which not only will cause big moves in the individual names but heighten over volatility.
This means it’s a good time to review just what we mean when we speak of volatility, and how the related Greek of Vega. Impacts option pricing.
Options traders sometimes use these terms interchangeably, and while they are related, they are two distinct concepts.
Volatility
Volatility is one of the five inputs used in the basic Black-Scholes options pricing model. A higher volatility means higher option prices. That’s because higher volatility means greater expected price swings.
So, it follows that stocks like “Netflix (NFLX)” and “Facebook (FB)” have higher volatility readings, and therefore higher-priced options than more mature and stable companies like “Apple (AAPL)” and “JP Morgan (JPM)”
Take a look at this table:
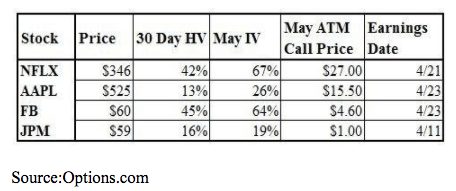
Despite Apple having a higher underlying stock price than Netflix, its at-the-money May call is actually much lower in price than Netflix. And note that both JP Morgan and Facebook are trading at around $60, but the latter’s call is nearly five times the price. This is almost entirely due to the differences in implied volatility. This is because Facebook is far more likely to make a huge move after earnings than JP Morgan. Last quarter provided a perfect example of this. Facebook rose 14% in one day after reporting earnings. JP Morgan moved just 0.1%.
Vega
Vega isolates how a change in implied volatility will impact an option’s price by estimating how much its value changes when implied volatility moves 1%.
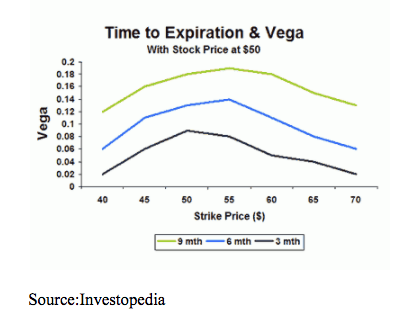
Vega is highest for at-the-money strikes and increases as you go out in time. Also notice that peak vega moves slightly out of the money as you go out in time. This is because the probability of a given price move occurring increases as the time frame is extended. For example, if you’re speculating on a $10 price move, you have more of a chance of being right if you have a six-month time frame rather than a one-month time frame. A directional calendar spread, in which one buys a later-dated out-of-the-money option and sells a near term out-of-the-money option is one strategy that tries to benefit from this concept.
When it comes to known events such as earnings reports, implied volatility will typically rise ahead of news and decline afterward. Understanding the difference between historical (or realized) volatility and implied volatility is crucial in determining whether an option is relatively “cheap” or “expensive” and whether you want to be long or short vega. In this case, one might want to short vega through the sale of a straddle or iron condor, which would benefit from a decline in implied volatility even if the stock moves sharply following the news event.
Understanding what the options market is expecting, or “pricing in” as measured by implied volatility, will help you determine just how large a price move will be needed for a profit when you have long options. And vega will tell you how much a change in implied volatility following the report will impact the price of the options. Often, a decline in IV (also known as vega risk) will offset the impact of price gains in the underlying stock. This is how you can be correct on a stock’s direction and still lose money on an options position.
Volatility helps define an option’s cost, and vega helps determine a position’s profit or loss. Therefore, it is critical to understand both concepts. It’s a good idea to use a basic options calculator like this one from the Chicago Board of Options Exchange (CBOE) to play around with changes in implied volatility over different time frames and see what the impact on the option’s price will be.
To learn more about Steve Smith’s successful approach to trading, and to access his Options360 program, click here.
Want More Great Investing Ideas?
9 “BUY THE DIP” Growth Stocks for 2020
Top 5 WINNING Stock Chart Patterns
7 “Safe-Haven” Dividend Stocks for Turbulent Times
CBOE shares were trading at $90.03 per share on Tuesday afternoon, down $1.46 (-1.60%). Year-to-date, CBOE has declined -24.49%, versus a -0.62% rise in the benchmark S&P 500 index during the same period.
About the Author: Option Sensei

Steve has more than 30 years of investment experience with an expertise in options trading. He’s written for TheStreet.com, Minyanville and currently for Option Sensei. Learn more about Steve’s background, along with links to his most recent articles. More...
More Resources for the Stocks in this Article
| Ticker | POWR Rating | Industry Rank | Rank in Industry |
| CBOE | Get Rating | Get Rating | Get Rating |