
Despite a lesser-than-expected cloud revenue, tech behemoth Alphabet Inc. (GOOGL - Get Rating) posted double-digit growth in its top and bottom line for the third quarter, topping estimates. Moreover, notwithstanding the slowdown, the cloud unit posted a $266 million operating profit, compared to an operating loss of $440 million in the prior-year quarter.
Recognizing the potential of Artificial Intelligence (AI), the company is harnessing collaborations to benefit from the AI wave. For instance, last month, GOOGL expanded its partnership with VMware, Inc. (VMW - Get Rating) to deliver Google Cloud’s AlloyDB Omni database on VMware Cloud Foundation. This is expected to help its customers accelerate their AI journey.
Given this backdrop, let’s look at the trends of GOOGL’s key financial metrics to understand why the stock could be a solid buy now.
Analyzing Alphabet Inc.’s Various Metrics: A Detailed Assessment of Financial Performance and Predicted Growth (2020 – 2023)
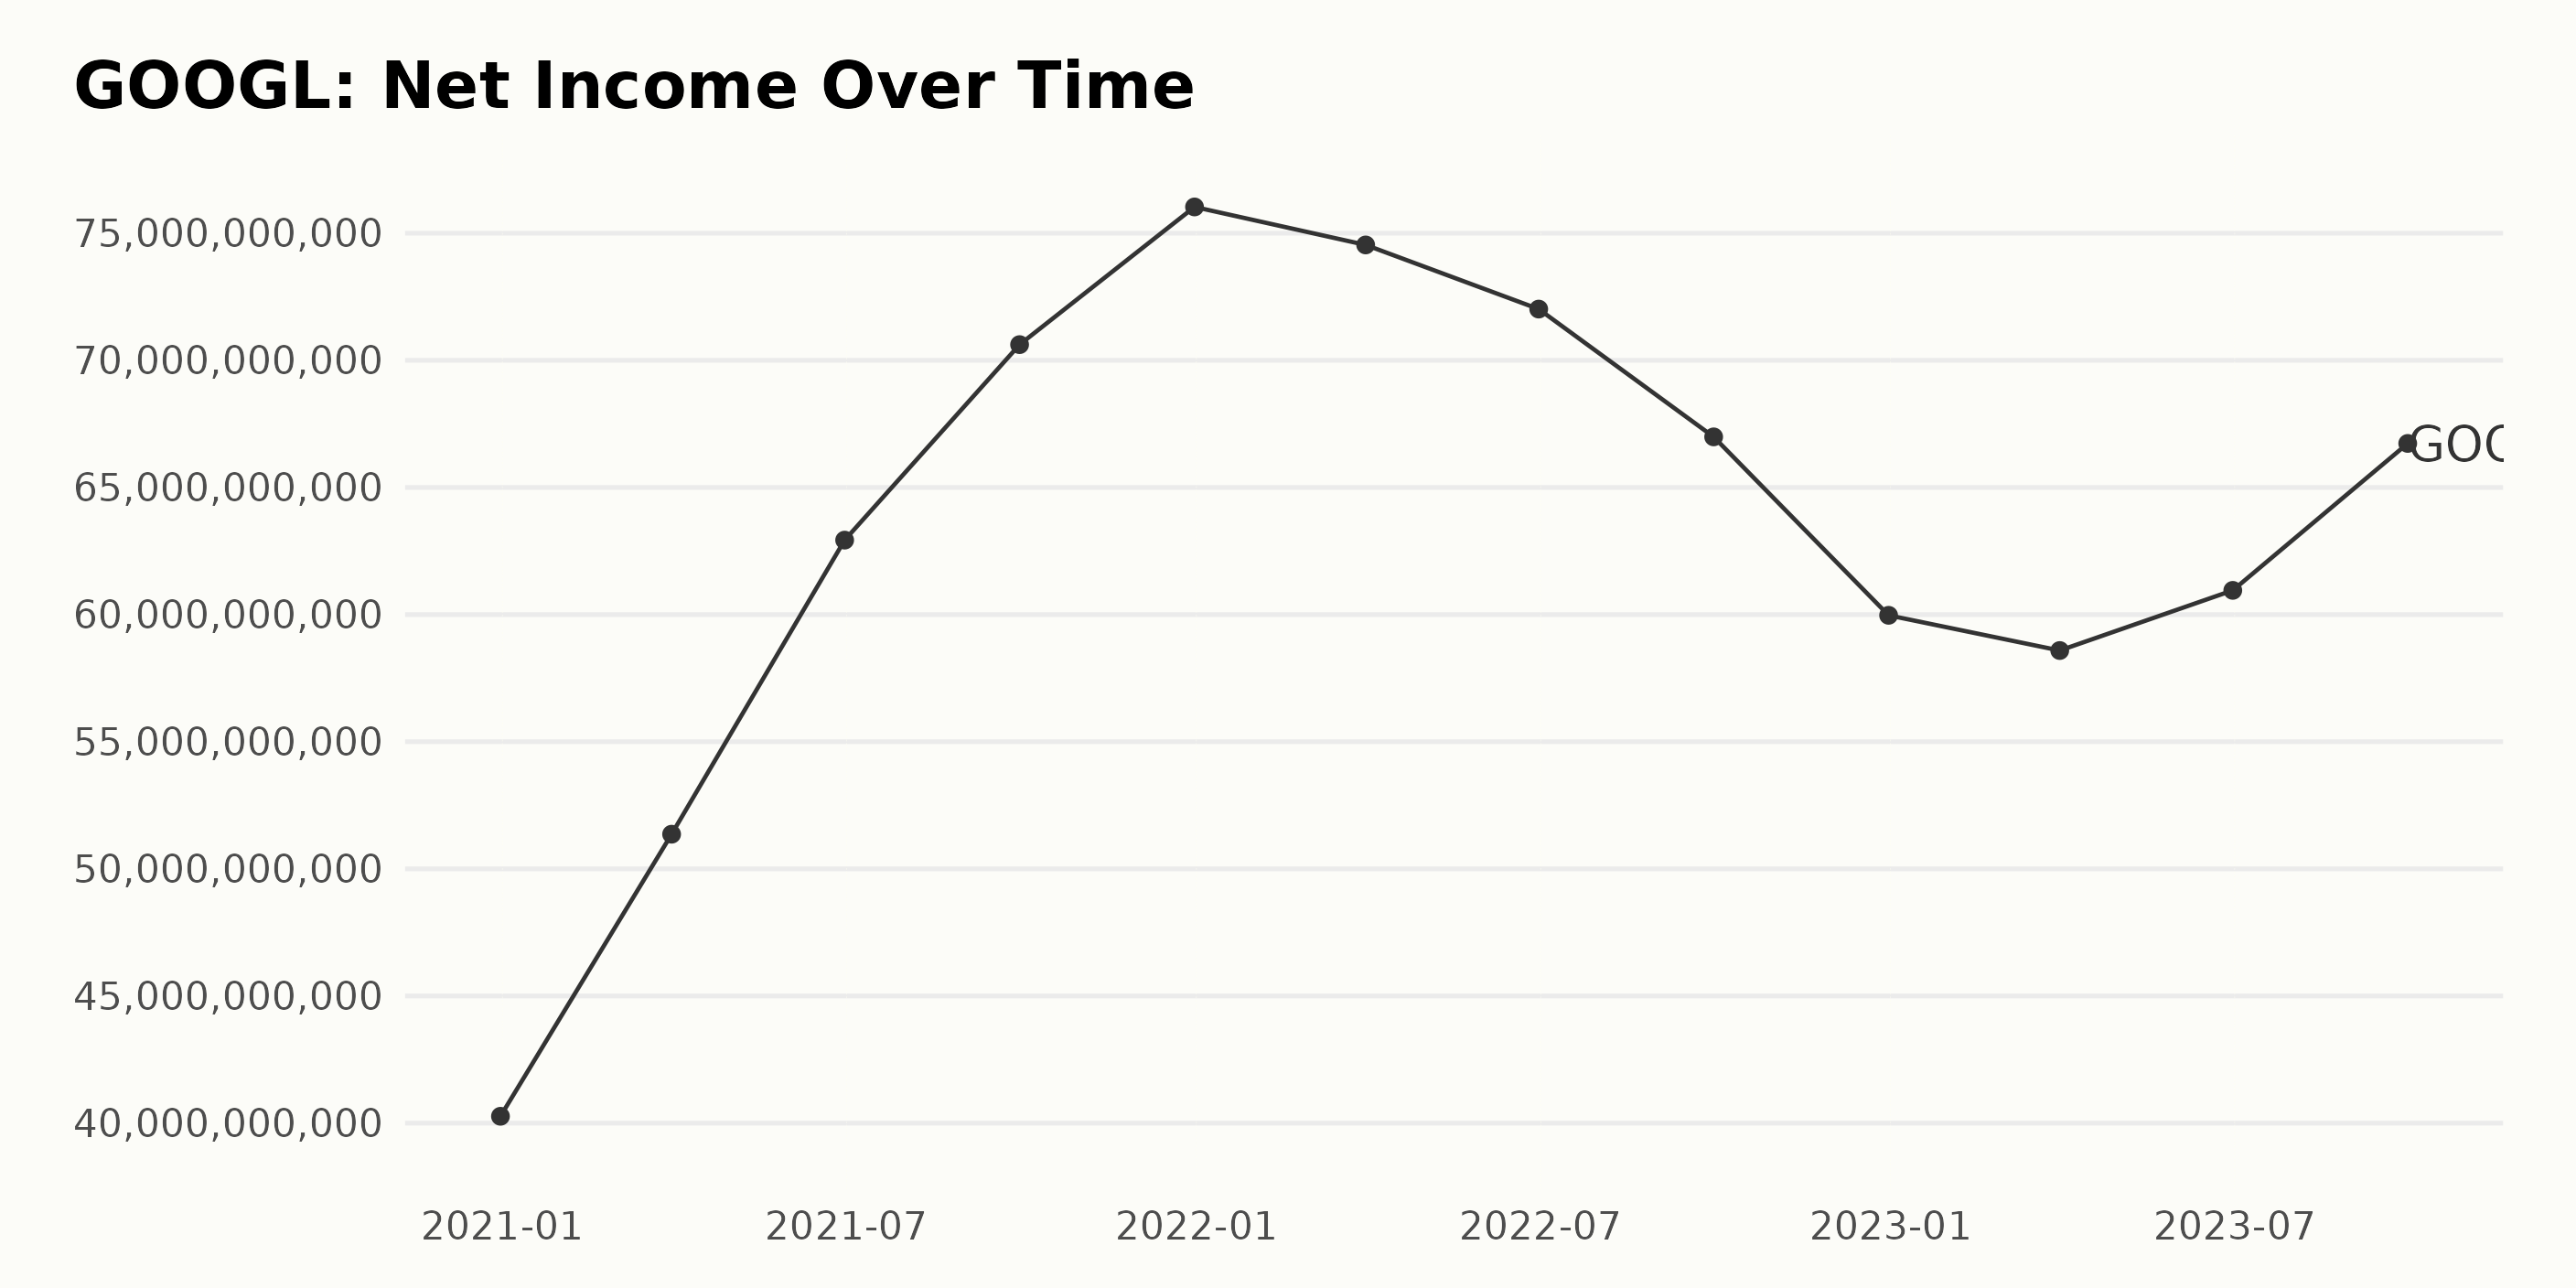
The trailing-12-month net income of GOOGL showed a fluctuating but ultimately upward trend from December 2020 to September 2023, albeit with some noticeable downturns.
- In December 2020, GOOGL’s net income was $40.27 billion.
- From this date until September 2021, there was a consistent rise, reaching a high of $70.62 billion, indicating strong growth in the company’s net income over the period.
- However, by December 2021, this had increased further to a peak of $76.03 billion.
- Post this peak, there is a significant dip in the first quarter of 2022, where the net income drops to $74.54 billion, followed by a further decrease to $72.02 billion by June 2022.
- This trend continued to fall further and hit a low of $59.97 billion by December 2022.
- Although there is a brief respite in March 2023 when the net income rises slightly to $58.59 billion, this figure again declines to $60.95 billion in June 2023.
- Finally, an upswing brings the net income to $66.73 billion in September 2023.
Based on these figures, from December 2020 to September 2023, the company exhibited an overall growth rate of approximately 65.65% in its net income despite the mentioned fluctuations. This includes a growth phase (~75.85%) followed by a contraction phase of ~21.14% and a recovery of ~11.29%.
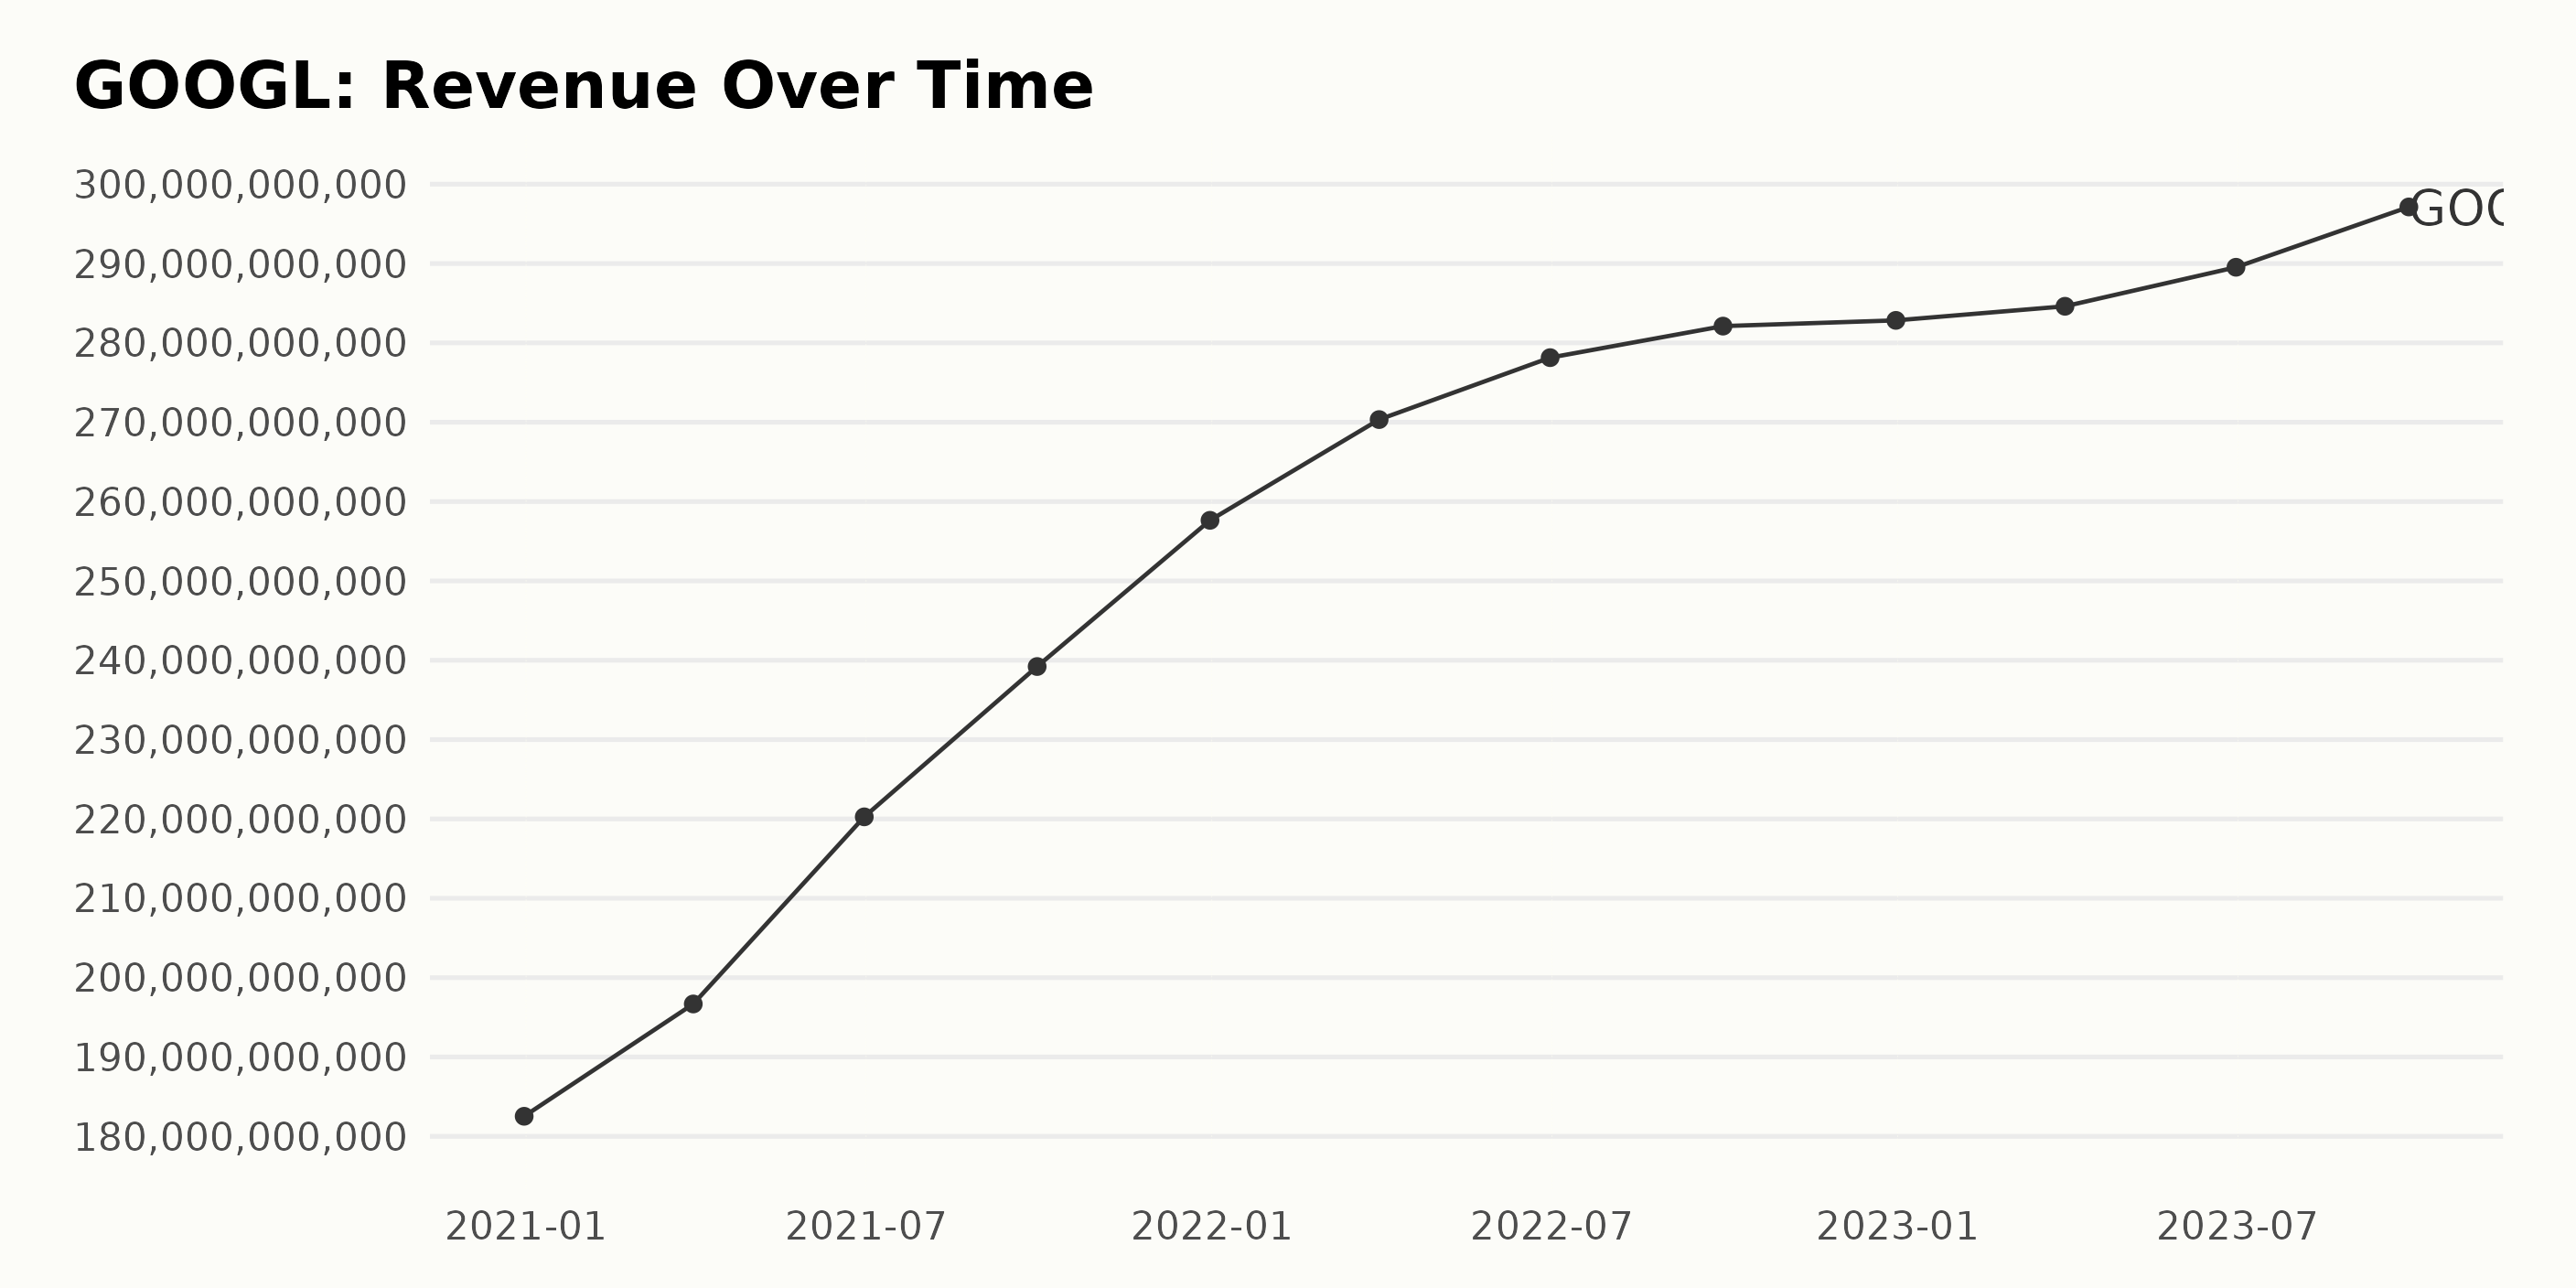
GOOGL has shown a consistent upward trend in its trailing-12-month revenue over the period from December 2020 through September 2023.
- Revenue increased from $182.53 billion at the end of December 2020 to $297.13 billion by the end of September 2023.
- The growth rate over this period, measured as the change in value from the first recording to the last, was approximately 63%.
- This upward trajectory appeared most significant in 2021 when revenue dramatically rose from $182.53 billion in December 2020 to $257.64 billion in December 2021.
Some fluctuations were evident within this overall growth pattern. The period between the end of March 2022 ($270.33 billion) and the end of June 2022 ($278.14 billion) showed slightly slower growth compared to other periods.
Furthermore, there was a slight stagnation towards the end of the year 2022, specifically from the end of September 2022 ($282.11 billion) to the end of December 2022 ($282.84 billion). Looking further into the year 2023, the growth in revenue appears to regain momentum.
There was a rise from January 2023 through September 2023, from $284.61 billion at the end of March 2023 to $297.13 billion at the end of September 2023. In summary, GOOGL experienced a consistent increase in its revenue from December 2020 to September 2023, with minor variations in the rate of growth.
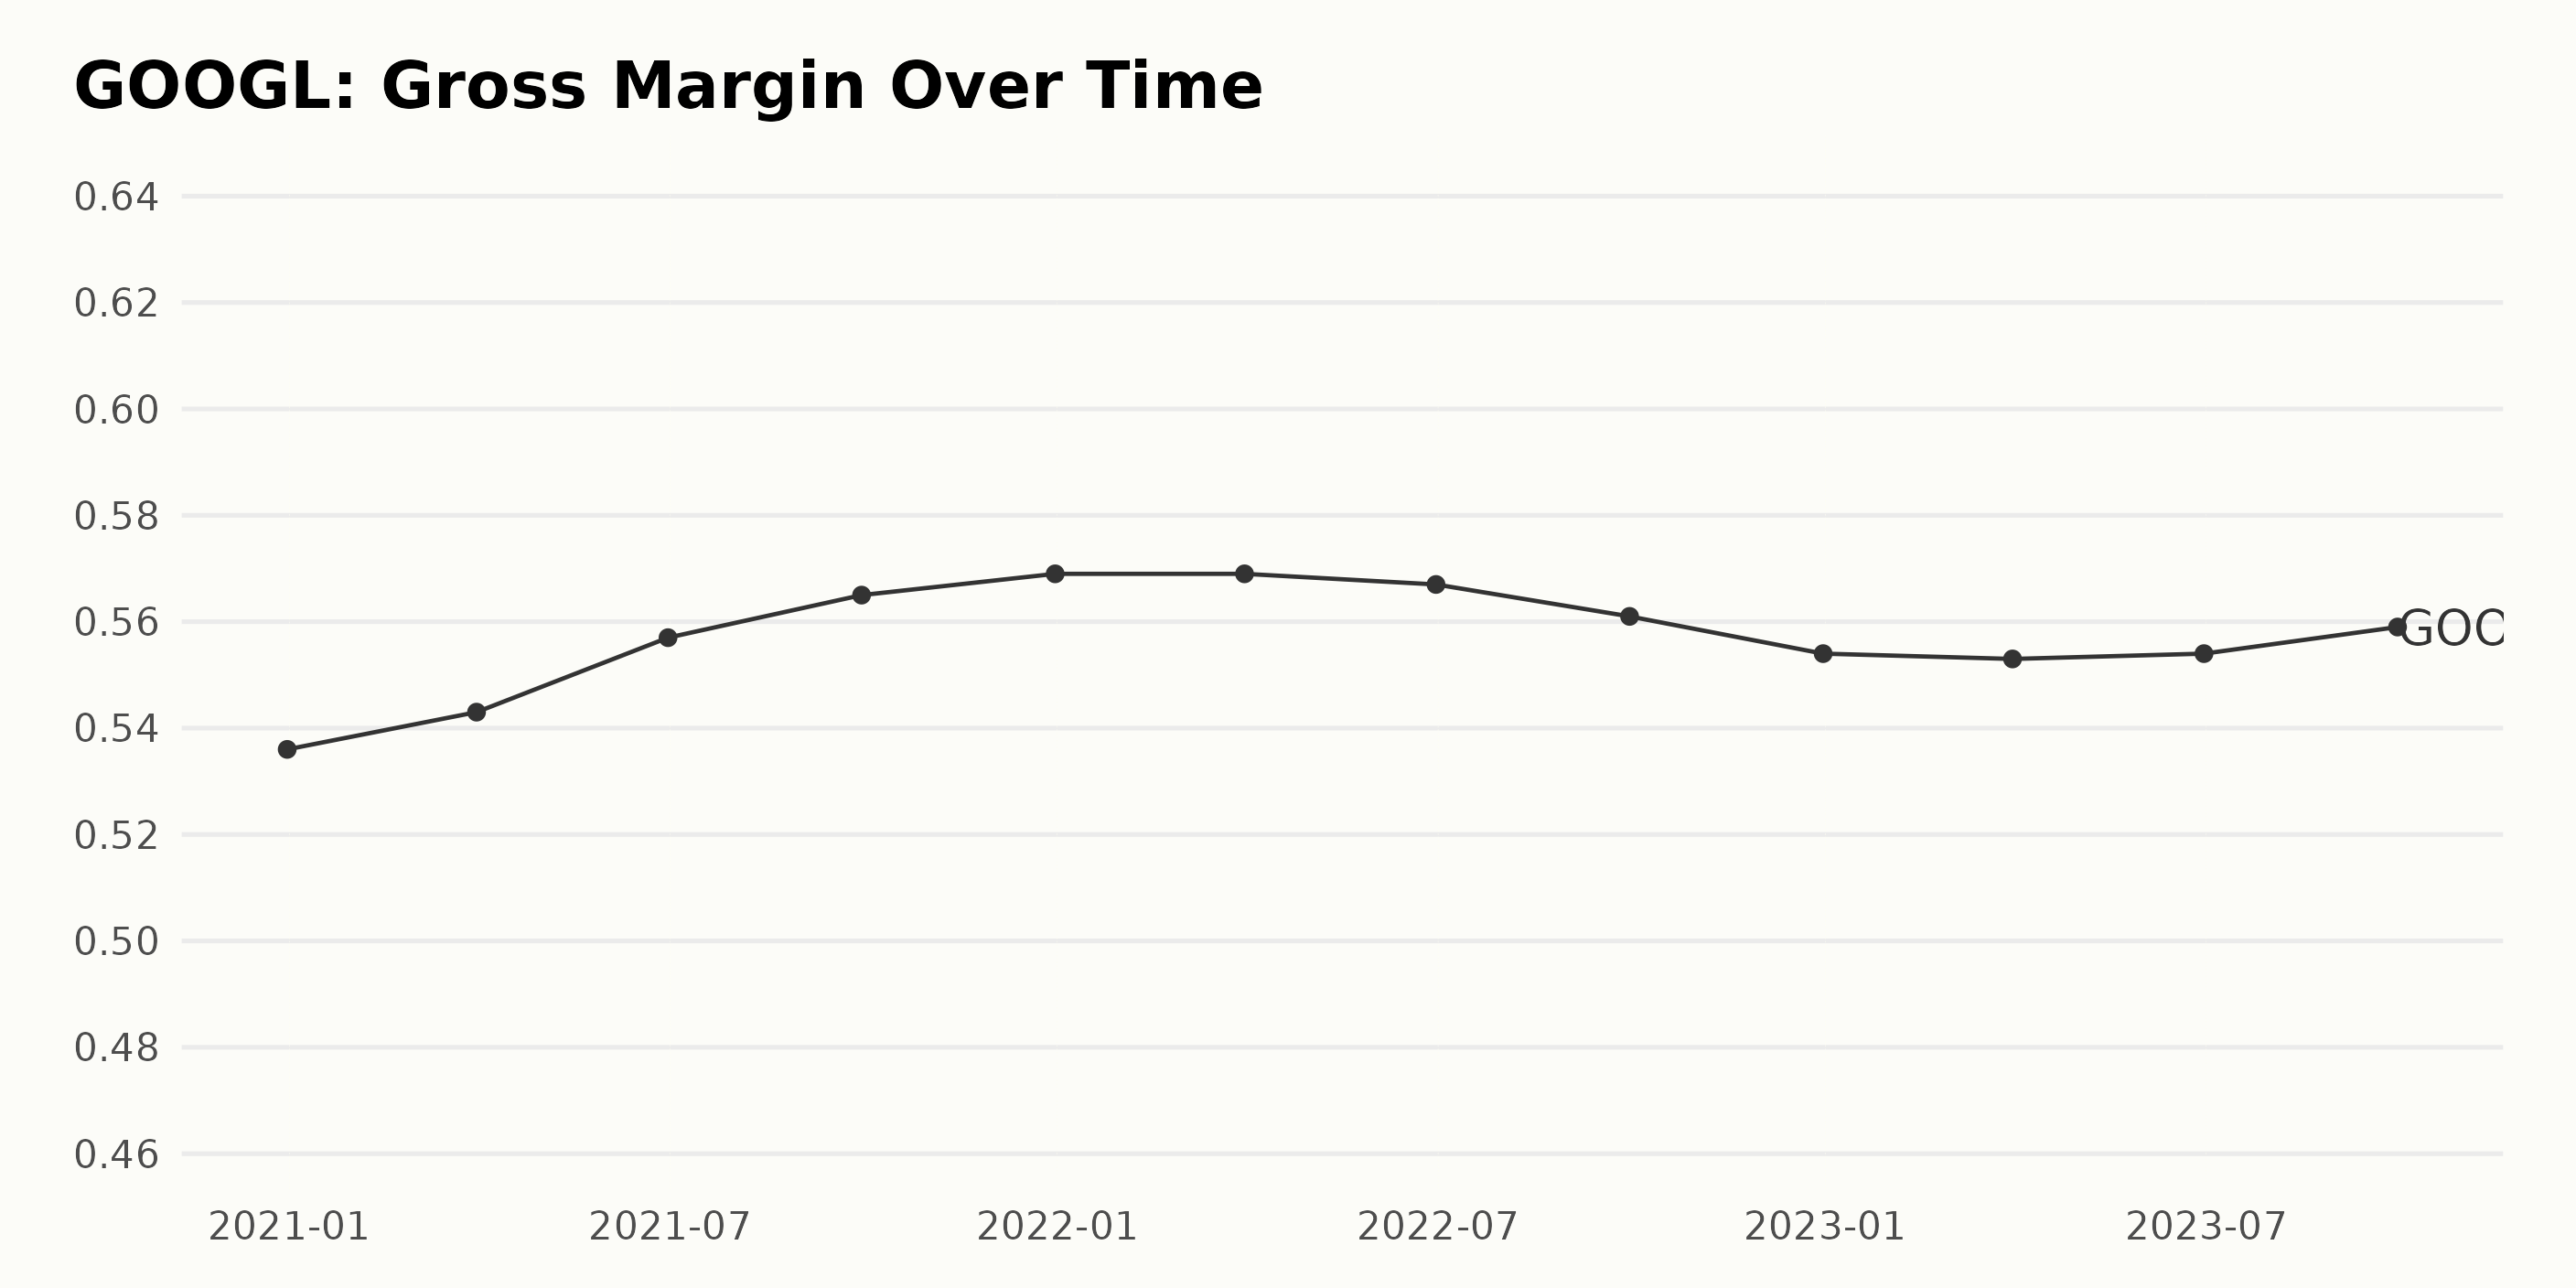
The gross margin of GOOGL has shown a mixture of growth and fluctuations over the period from late 2020 through to the end of the third quarter in 2023.
- Starting at 53.6% as of December 31, 2020, the gross margin saw a steady incline over the next year.
- By the end of 2021, it had risen to 56.9%, illustrating an increase of approximately 3.3% over that year.
- In the first quarter of 2022, the gross margin remained stable at 56.9% but began a downward trend in the subsequent quarters, falling to 55.4% by the end of that year.
- However, despite this, the gross margin for GOOGL remained above 55% throughout this period, indicating some level of stability despite the fluctuations.
- In 2023, a slight recovery can be observed with the gross margin increasing to 55.9% by the end of September, up from 55.3% at the end of March.
In terms of the overall growth rate between December 31, 2020, and September 30, 2023, there is a 2.3% increase. This shows that despite experiencing periods of both growth and decline during these years, the general trend for GOOGL’s gross margin has been positive.
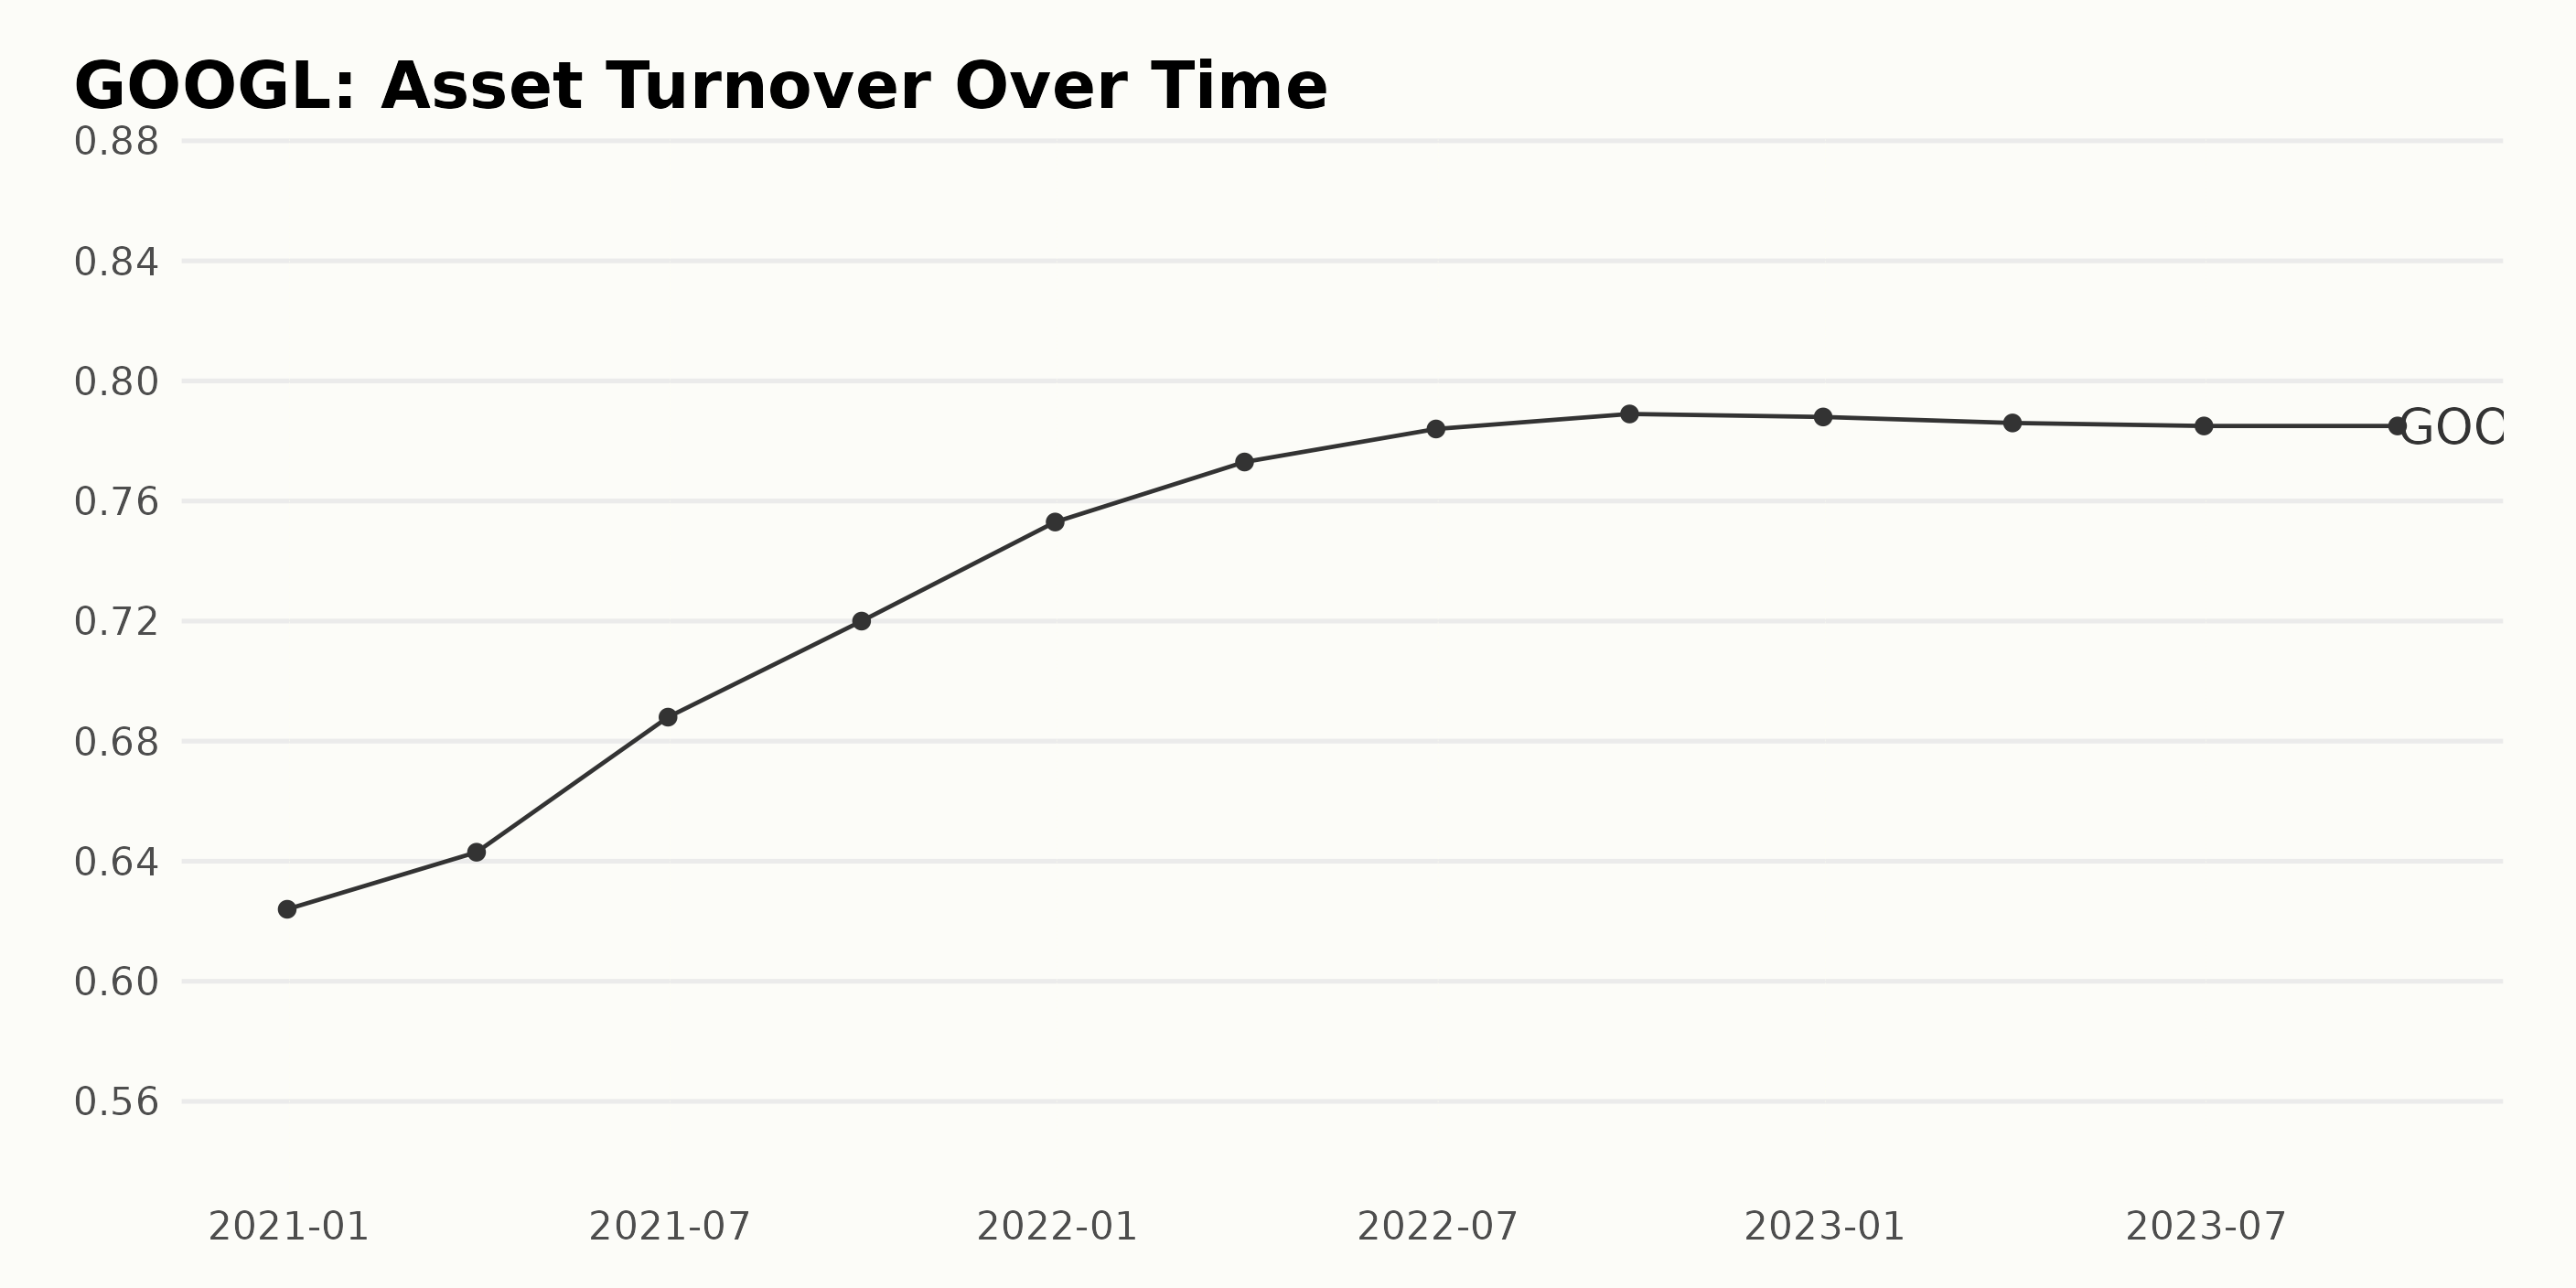
In analyzing the provided series of data, GOOGL’s asset turnover demonstrates a clear increasing trend, yet it is not without its distinct fluctuations. Here are some significant points:
- The series begins on December 31, 2020, with an asset turnover of 0.62.
- It experienced a steady growth throughout 2021 and reached a value of 0.75 as of December 31, 2021.
- This momentum continues into 2022, peaking in September 2022 with an asset turnover of 0.789.
- However, following this peak, the data reflect a slight downturn. By December 2022, the asset turnover decreased marginally to 0.788 and continued to gradually fall until reaching 0.785 by September 30, 2023.
The overall growth for GOOGL’s asset turnover from December 31, 2020, to September 30, 2023, was roughly 26%. Despite the prevalent upward trend, the data’s latter part indeed expresses a slight contraction, warranting careful observation of GOOGL’s future performances.
Reviewing Alphabet Inc.’s Roller Coaster Share Price Ride from June to December 2023
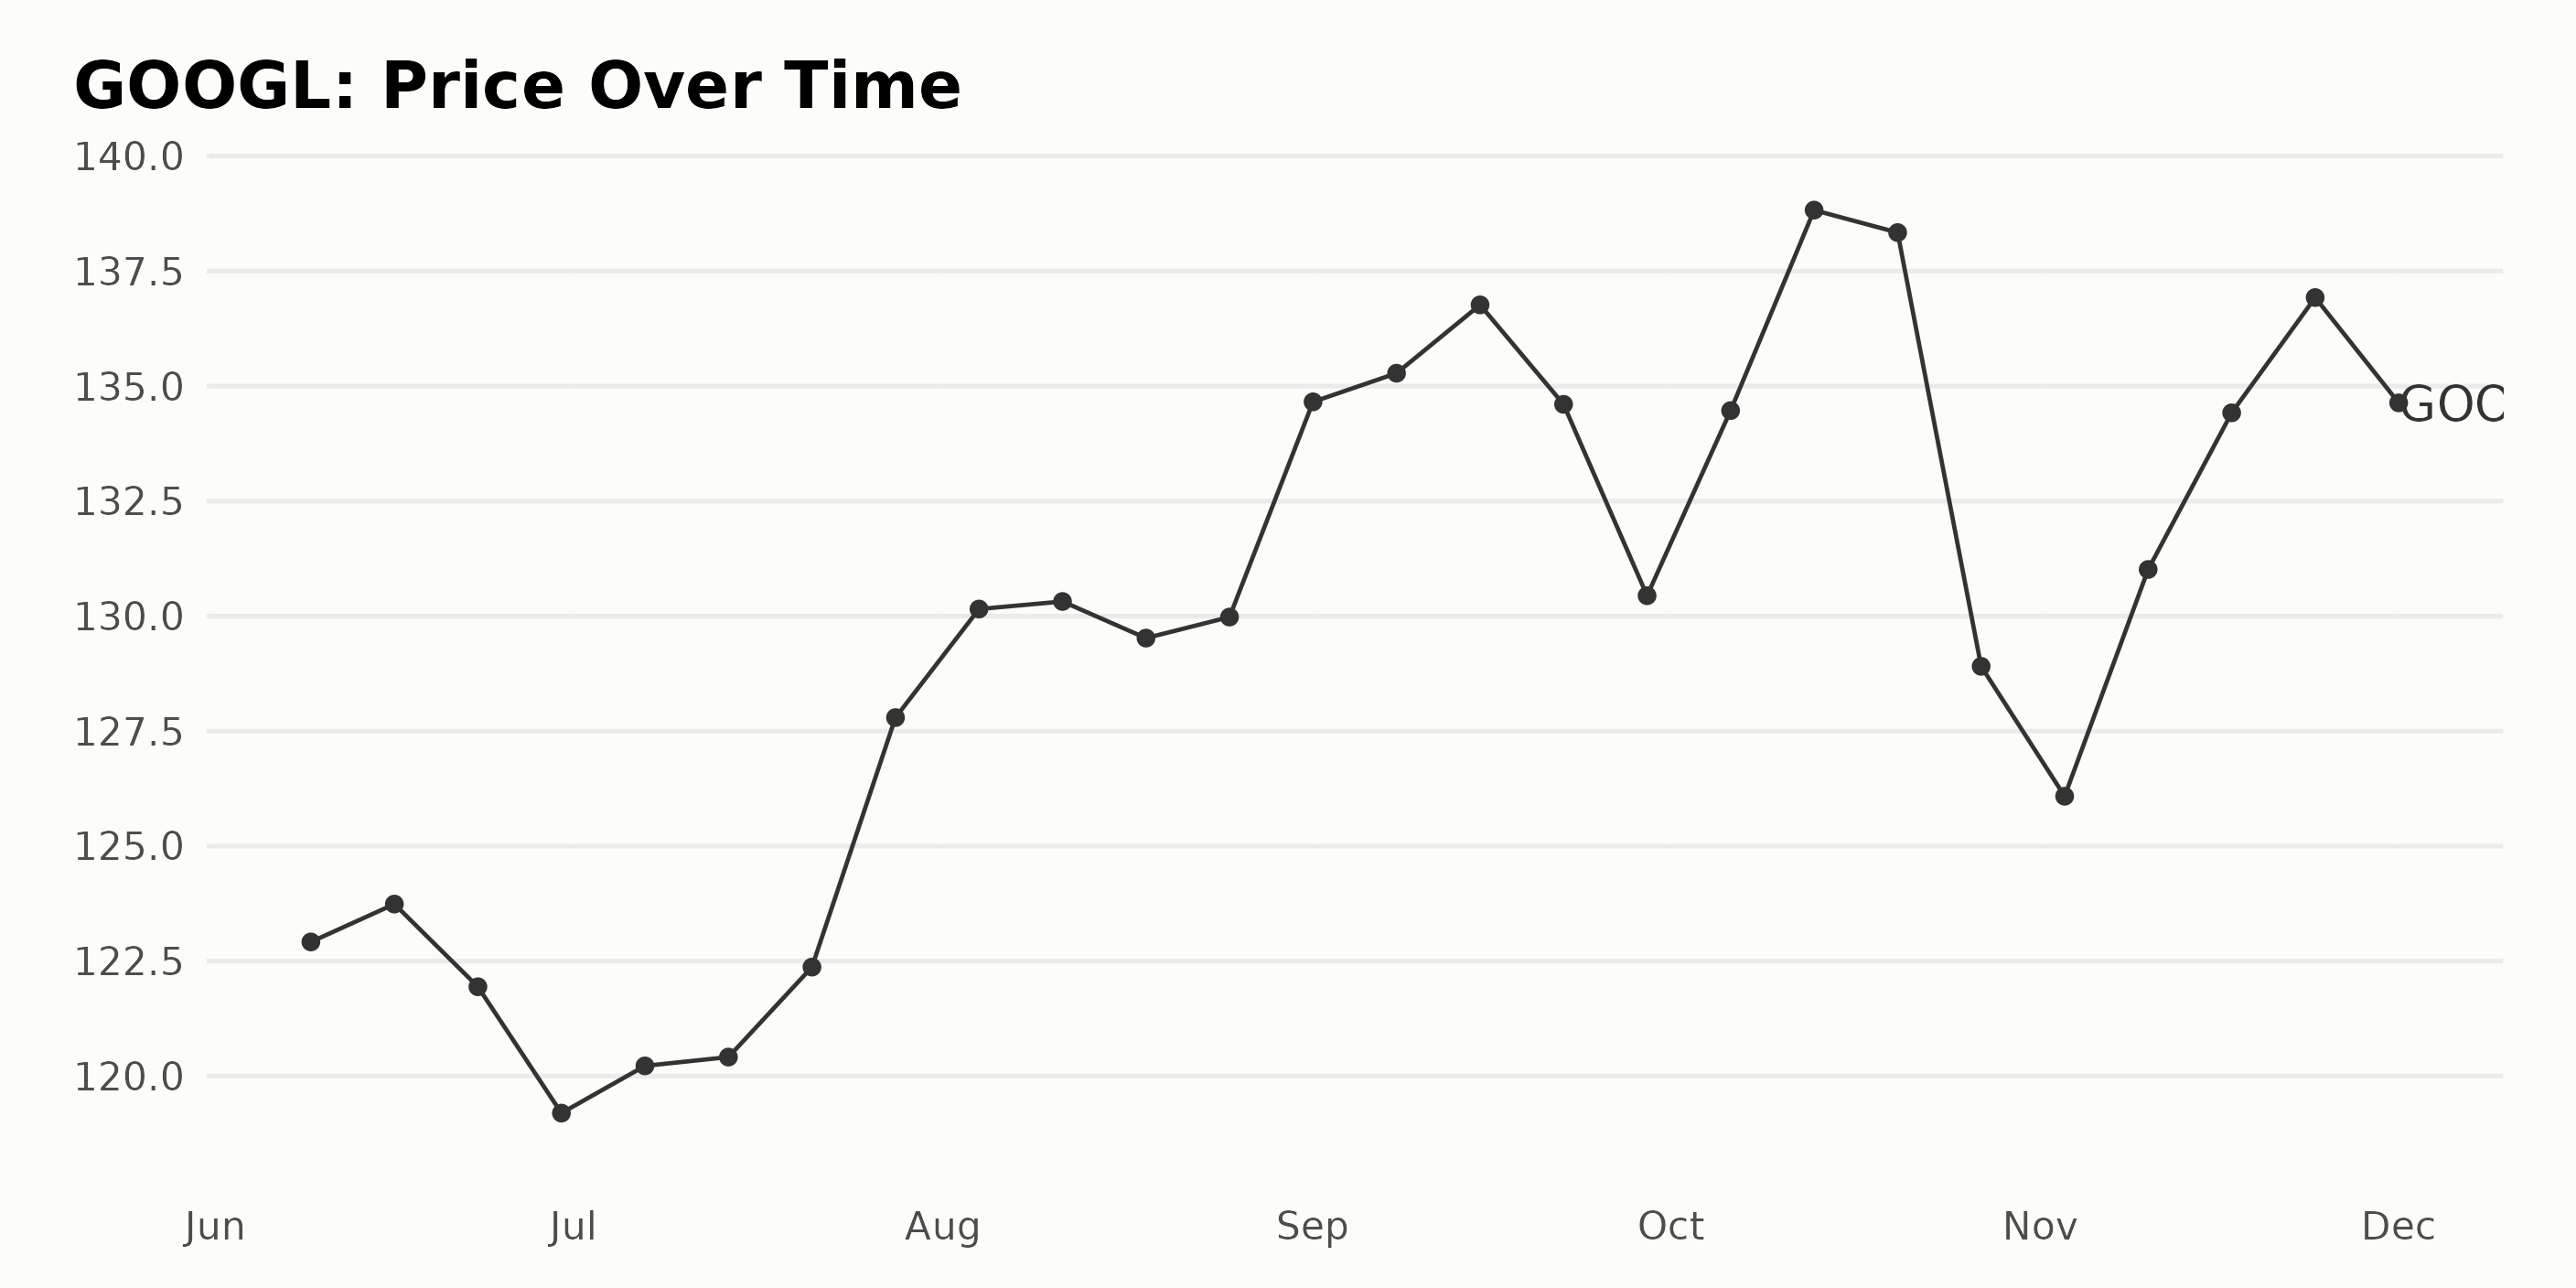
An analysis of GOOGL share price from June 2023 to December 2023 reveals the following:
- Starting at a price of $122.92 on June 9, 2023, GOOGL’s shares experienced a slight dip to $119.20 by the end of June.
- The prices then rebounded slightly in July and saw a steady increase through early August, reaching $130.32 by August 11, 2023.
- A short period of stability is noticed until late August, with prices hovering around the $130 mark.
- Subsequently, the share prices rose significantly and peaked at $136.77 on September 15, 2023.
- However, this was followed by a noticeable decline, which brought the prices down to $130.44 by the end of September.
- GOOGL showed some resilience during October by elevating its price to $138.83 by mid-October. However, this was followed by a sharp fall, rounding out the month at $128.91 as of October 27, 2023.
- November displayed a recovery trend, with shares steadily climbing back up to $136.93 by November 24 before closing the last trading session at $131.86.
The observed growth rate over the course of these months was oscillating, with periods of sharp rise followed by sudden falls. This determines an overall volatile trend. Yet, the company ended the year with a higher share price than it started with in June, signifying overall positive growth.
The significant rises and falls throughout this period indicate both accelerating and decelerating trends at different points in time. Here is a chart of GOOGL’s price over the past 180 days.
Analyzing Alphabet Inc.’s POWR Ratings: Quality, Sentiment, and Momentum 2023 Performance
Based on the most recent data available, GOOGL’s POWR Ratings Grade is B (Buy). This value puts it in superior standing. As for its rank within the Internet category of stocks, it was placed third out of 57 stocks. Here are some important details from the data:
- In June 2023, the POWR Grade was B (Buy), and for most of the month, GOOGL held the 11th position in its category.
- By July 2023, its rank had improved to the 8th position by mid-month and reached 6th by the end of the month.
- In August 2023, GOOGL slipped slightly to 7th place before quickly recovering to 5th place in the middle of September 2023.
- It hovered around the 5th and 6th positions till late October 2023, when it rose to 4th place in its category.
- For the week ending November 10, 2023, GOOGL climbed further and entered the top 3, with its POWR Grade improving to A (Strong Buy).
- As of December 4, GOOGL has a B (Buy) grade, maintaining its 3rd place ranking.
These results indicate a consistent improvement in GOOGL’s position within its category over the monitored period.
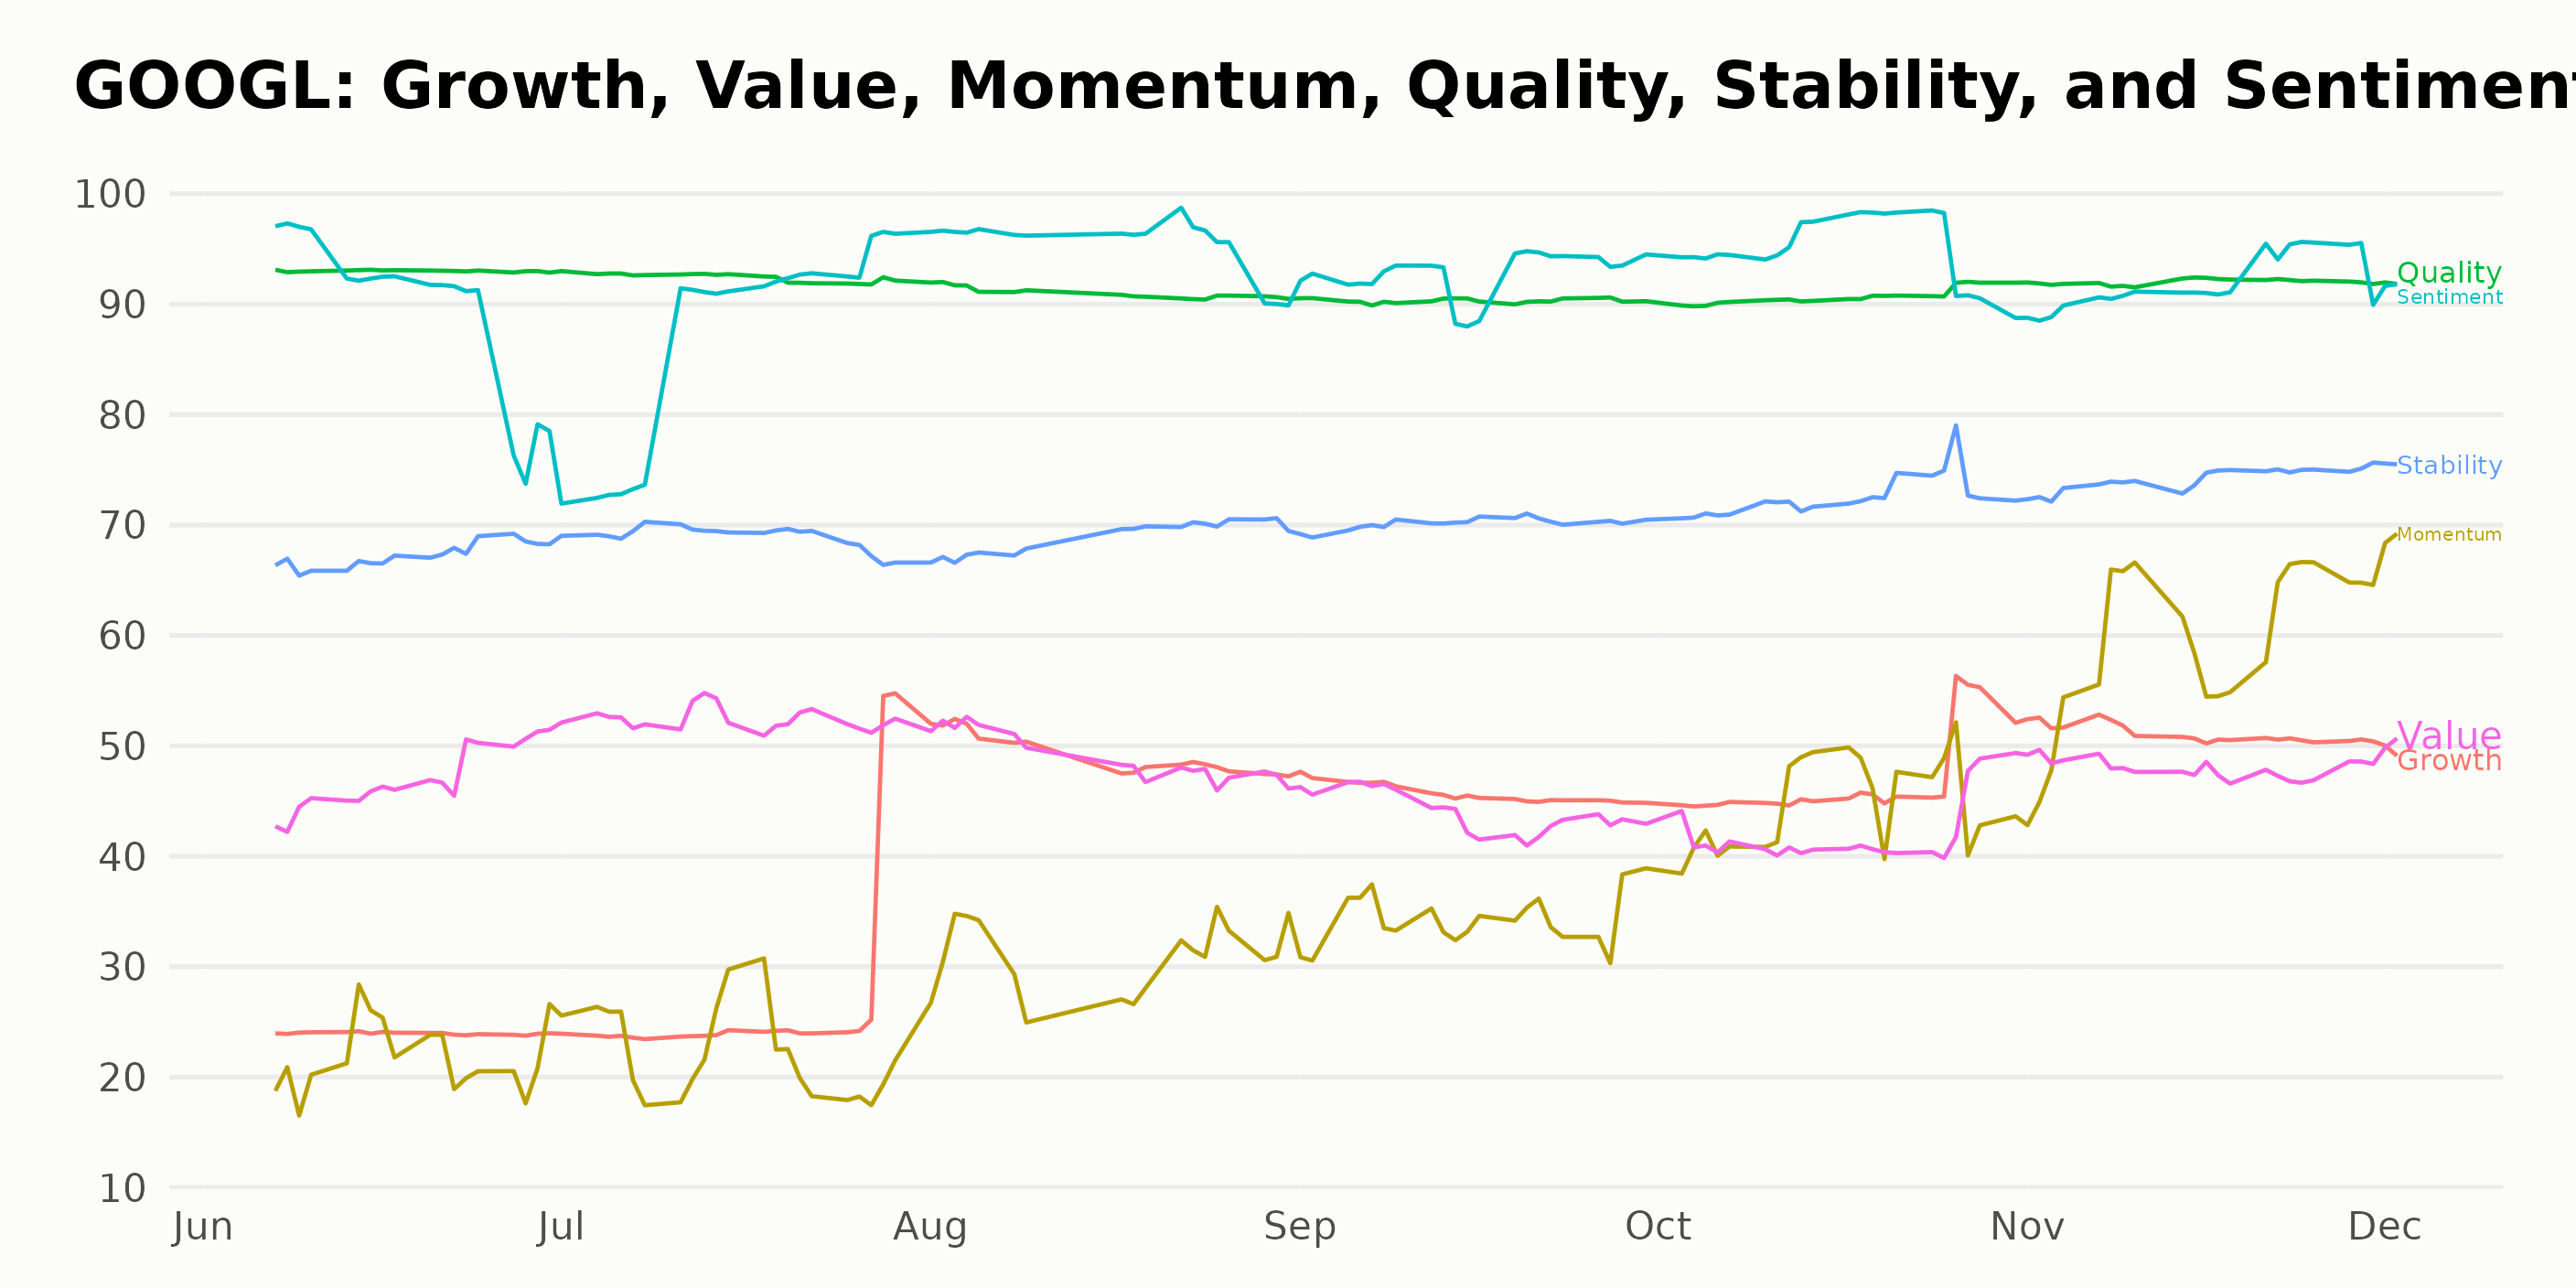
The POWR Ratings for GOOGL across six dimensions over the course of 6 months, from June to December 2023, reveal some significant patterns and noteworthy dimensions. After a close examination, three dimensions clearly stand out based on their ratings: Quality, Sentiment, and Momentum.
Quality: The Quality dimension for Alphabet consistently ranks highest amongst the dimensions throughout this period. Starting at 93 in June 2023, it marginally declines to 90 in September and climbs back to 92 by November, maintaining this score into the first few days of December.
Sentiment: The Sentiment dimension follows a positive trend across the period, starting at 90 in June 2023, dipping to 87 in July, but rising steadily thereafter. By August, it attains the highest rating of 95, which it sustains in October and concludes with 92 in both November and early December.
Momentum: The Momentum dimension reflects a clear growth trend across the investigated period. While starting off on a lower note at 22 in June and July, it shows substantial increments over the months. Momentum reaches 45 by October 2023, escalates to 59 in November, and finally tops off at 69 in the first days of December.
These observations suggest that GOOGL’s prospects, based on these dimensions, are either stable (Quality), have improved sentiment over time (Sentiment), and have been gathering growth momentum steadily from mid-2023 onwards (Momentum).
How does Alphabet Inc. (GOOGL) Stack Up Against its Peers?
Other stocks in the Internet sector that may be worth considering are Yelp Inc. (YELP - Get Rating), Meta Platforms, Inc. (META - Get Rating), and Travelzoo (TZOO - Get Rating) – they have an A (Strong Buy) and B (Buy) overall grade. Click here to explore more Internet stocks.
What To Do Next?
Discover 10 widely held stocks that our proprietary model shows have tremendous downside potential. Please make sure none of these “death trap” stocks are lurking in your portfolio:
Want More Great Investing Ideas?
GOOGL shares were trading at $128.48 per share on Monday morning, down $3.38 (-2.56%). Year-to-date, GOOGL has gained 45.62%, versus a 20.48% rise in the benchmark S&P 500 index during the same period.
About the Author: Anushka Dutta

Anushka is an analyst whose interest in understanding the impact of broader economic changes on financial markets motivated her to pursue a career in investment research. More...
More Resources for the Stocks in this Article
| Ticker | POWR Rating | Industry Rank | Rank in Industry |
| GOOGL | Get Rating | Get Rating | Get Rating |
| VMW | Get Rating | Get Rating | Get Rating |
| YELP | Get Rating | Get Rating | Get Rating |
| META | Get Rating | Get Rating | Get Rating |
| TZOO | Get Rating | Get Rating | Get Rating |


