
Robinhood Markets, Inc. (HOOD) operates a financial platform that allows users to invest in stocks, ETFs, options, gold, and cryptocurrencies. Since its inception, the platform has revolutionized the way people participate in financial markets by offering commission-free trading and a user-friendly mobile app.
The company is a major player in the online brokerage industry, attracting a large user base, especially younger and novice investors. However, it currently faces pressures from the regulatory crackdown on cryptocurrencies.
Recently, the company announced that it would stop supporting three tokens, Cardano, Polygon, and Solana, starting on June 27 following a review. The company’s May operating data shows that its total crypto trading volumes declined 43% month-over-month and 68% year-over-year. Moreover, Monthly Active Users (MAU) declined to 10.6 million in May, down approximately 900 thousand from April 2023.
Let’s look at the trends of some of its key financial metrics to understand why it could be wise to avoid the stock now.
Examining Financial Performance: HOOD’s Net Income, Revenue, and Analyst Price Target Trends
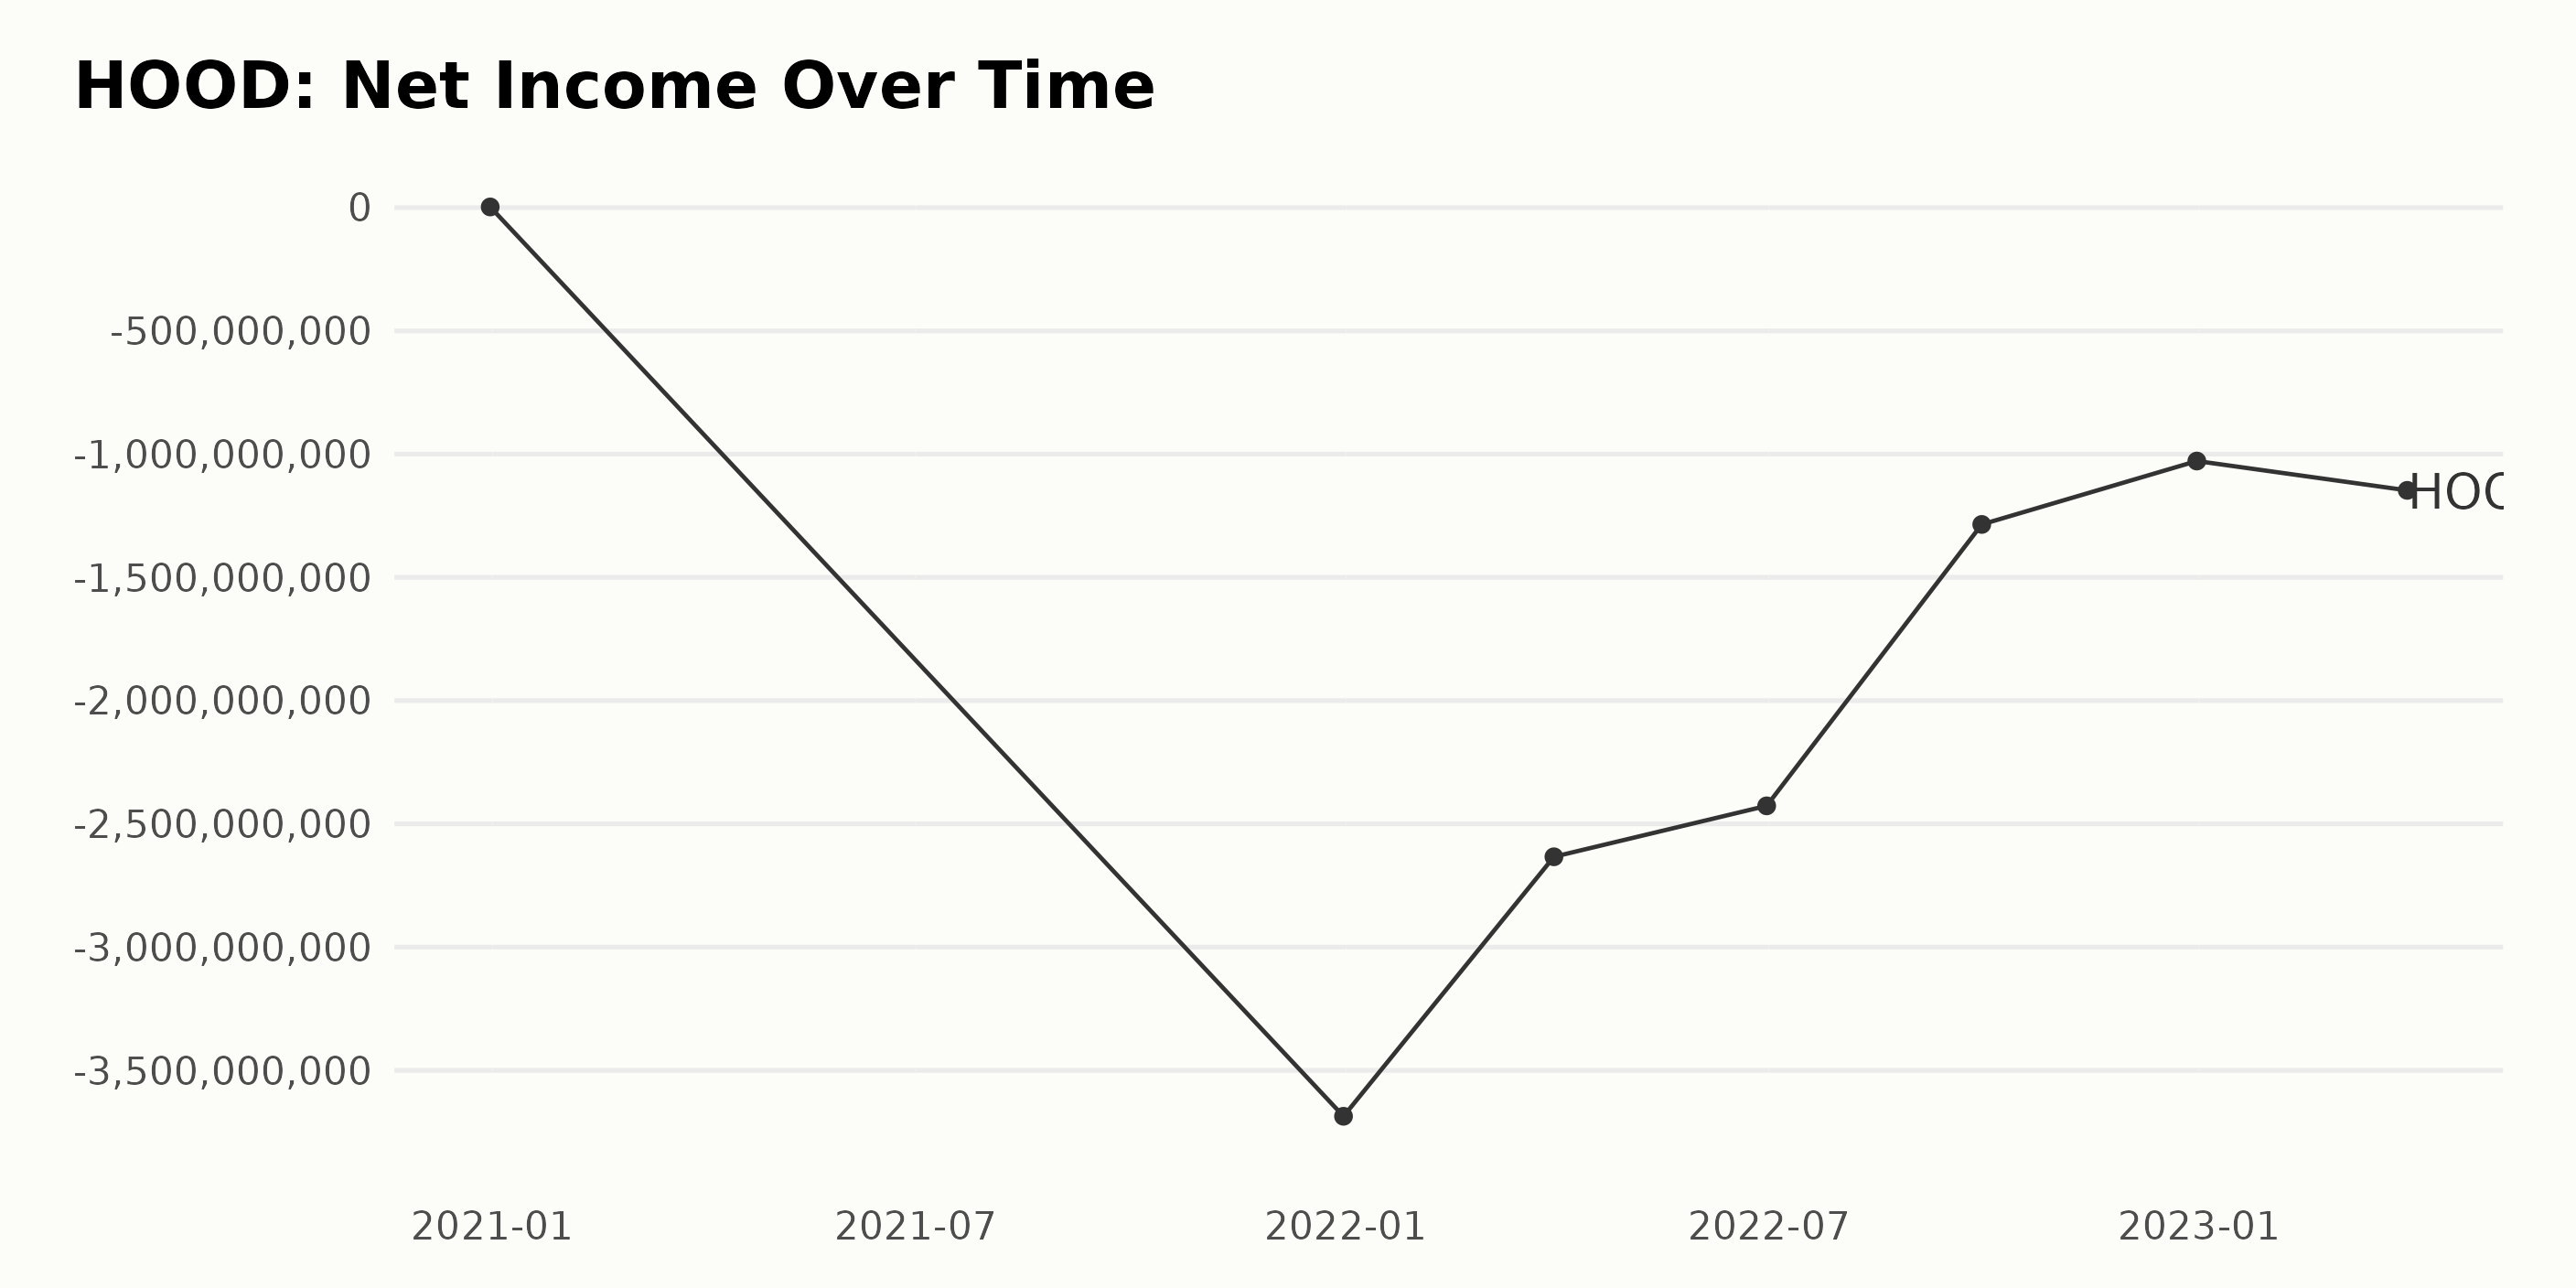
The trend and fluctuations of the reported trailing-12-month net income of HOOD can be summarized as follows:
- December 2020: $2.85 million
- December 2021: -$3.69 billion
- March 2022: -$2.63 billion
- June 2022: -$2.43 billion
- September 2022: -$1.29 billion
- December 2022: -$1.03 billion
- March 2023: -$1.15 billion
From this data series, we can observe a significant downward trend in the net income of HOOD. The company experienced a massive loss of $3.69 billion by December 2021, which is a substantial decline from its positive net income of $2.85 million in December 2020.
However, following December 2021, there has been a slow but consistent improvement in the company’s net income, with losses gradually reducing over the subsequent quarters in 2022 and 2023.
By March 2023, the company’s net income was at -$1.15 billion, still showcasing a loss but considerably less compared to the previous downfall seen in December 2021. When calculating the growth rate from December 2020 to March 2023, we can determine a growth rate of about -405%.
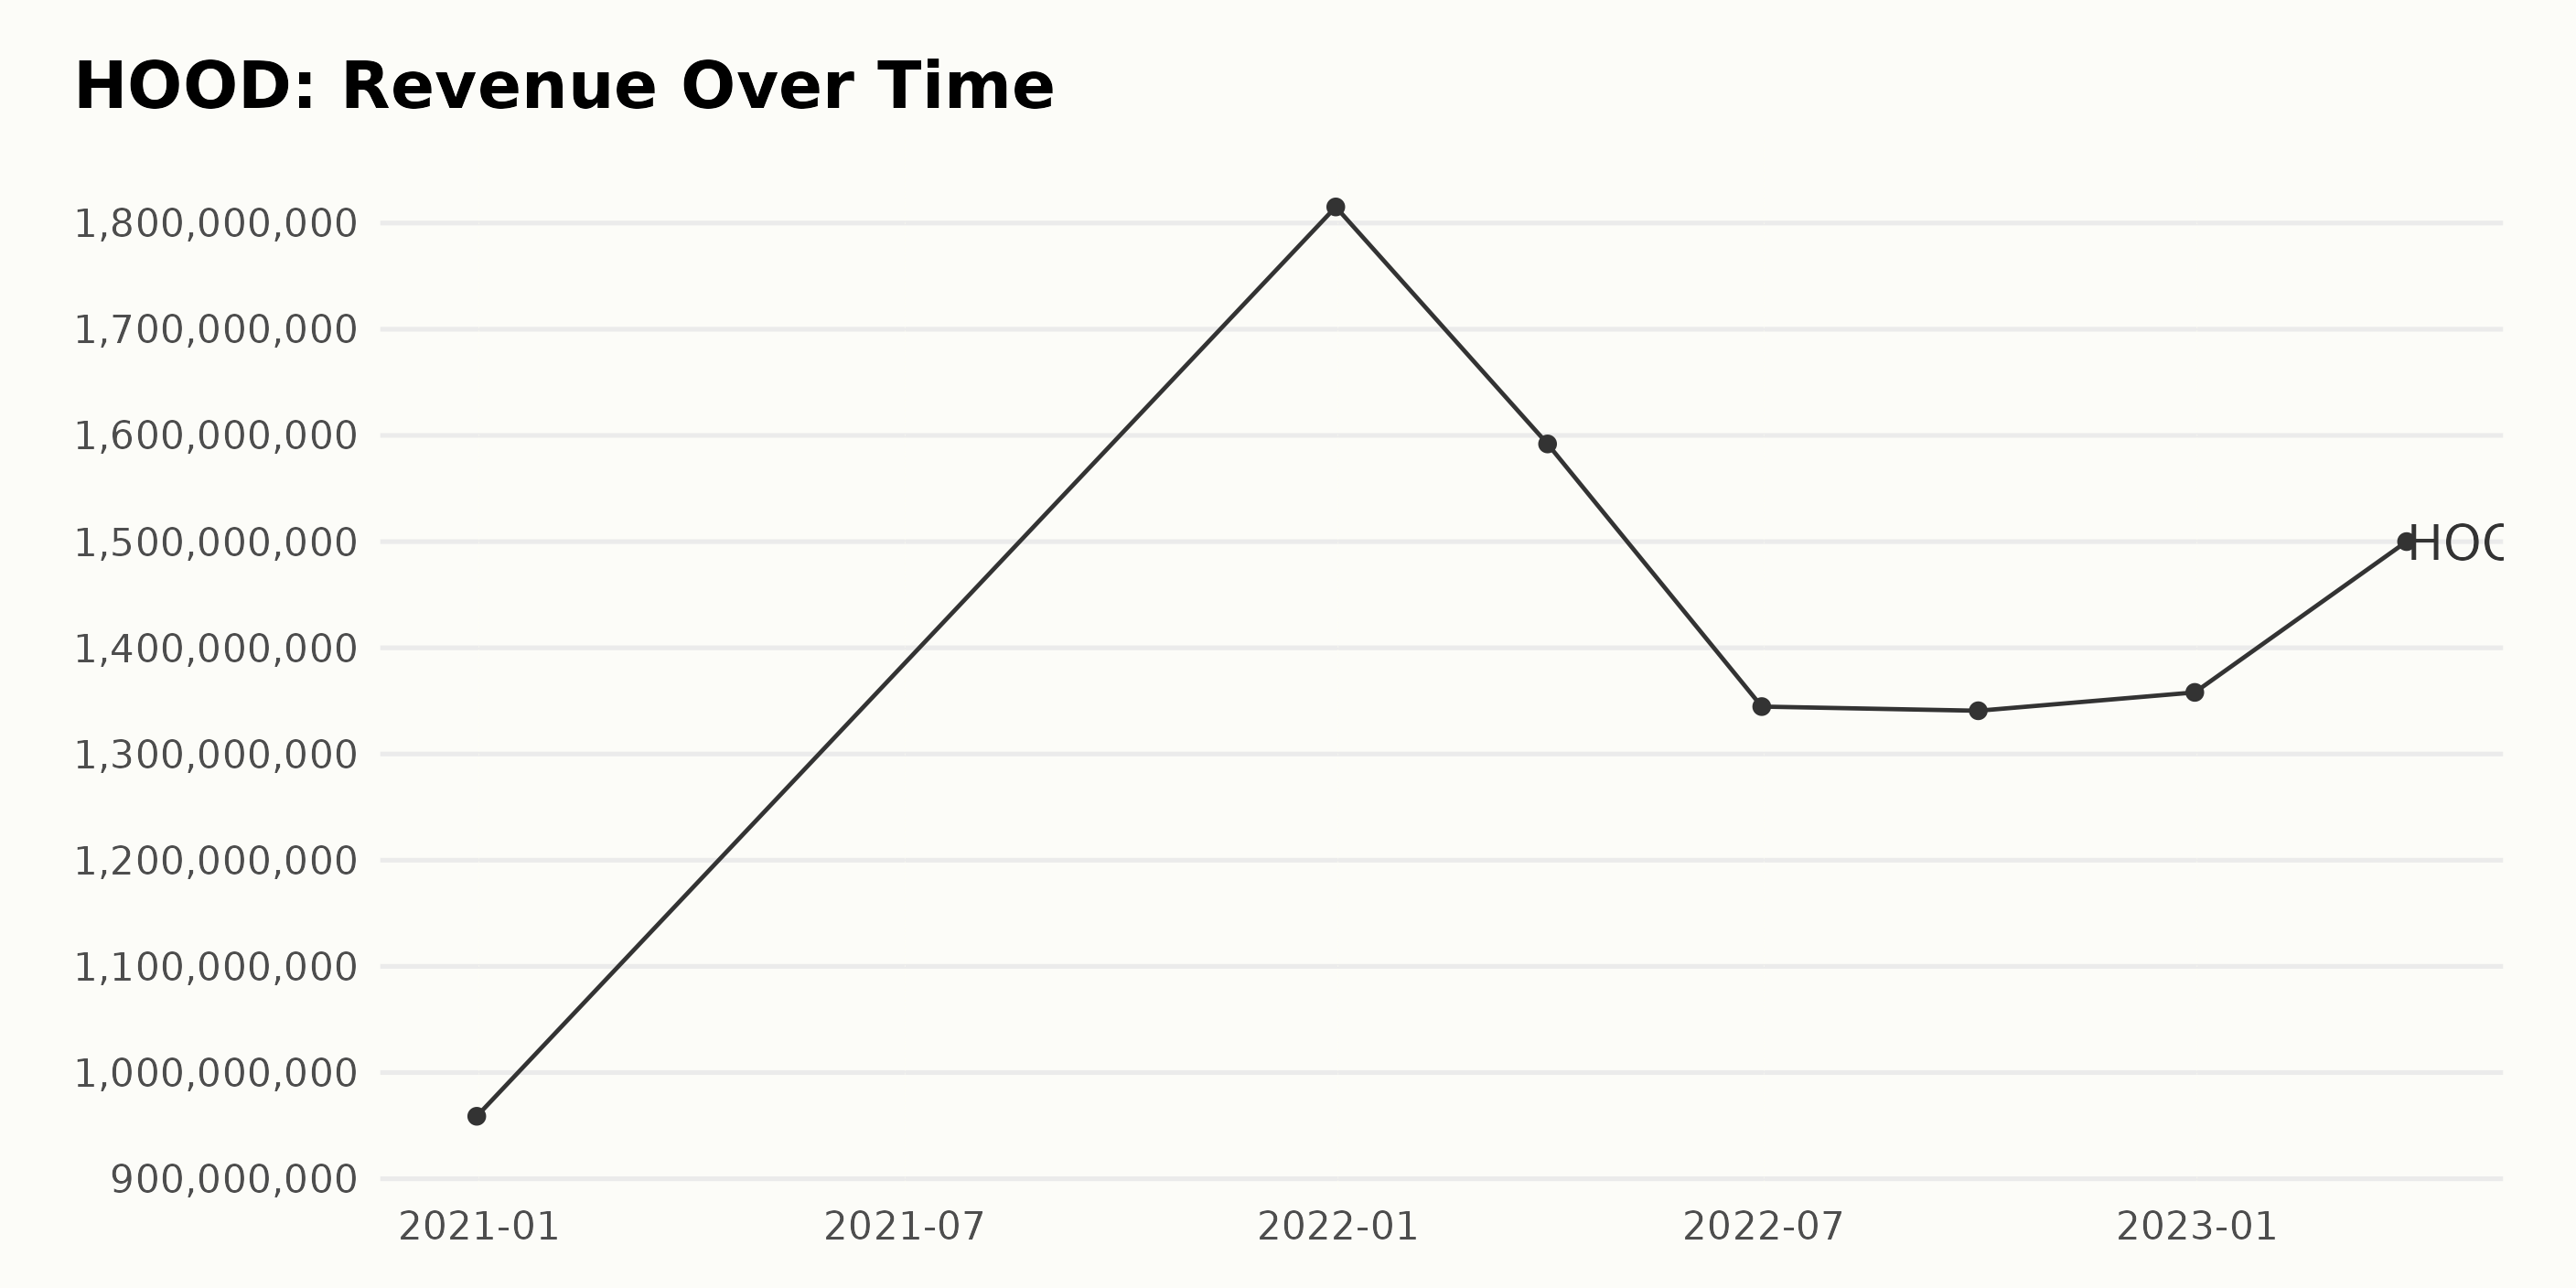
The trailing-12-month revenue trend and fluctuations for HOOD can be summarized as follows: — December 2020: Revenue was at $958.83 million. December 2021: Revenue increased to $1.82 billion, representing a significant growth from the previous year. March 2022: Revenue decreased to $1.59 billion, showing a downward fluctuation in the first quarter of 2022.
June 2022: Revenue further dropped to $1.34 billion, continuing to decline in the second quarter of 2022. September 2022: Revenue remained relatively stable at $1.34 billion, slightly decreasing compared to the previous quarter. December 2022: Revenue showed a minor increase, reaching $1.36 billion in the last quarter of 2022.
March 2023: Revenue grew significantly to $1.5 billion in the first quarter of 2023. Placing greater emphasis on the most recent data and the last value in the series, HOOD’s revenue has experienced fluctuations throughout the period, with noticeable growth from December 2020 to December 2021 and a general declining trend in 2022.
However, the March 2023 figure indicates positive growth. The overall growth rate from December 2020 to March 2023 is approximately 56.47%, considering the series’ first and last value.
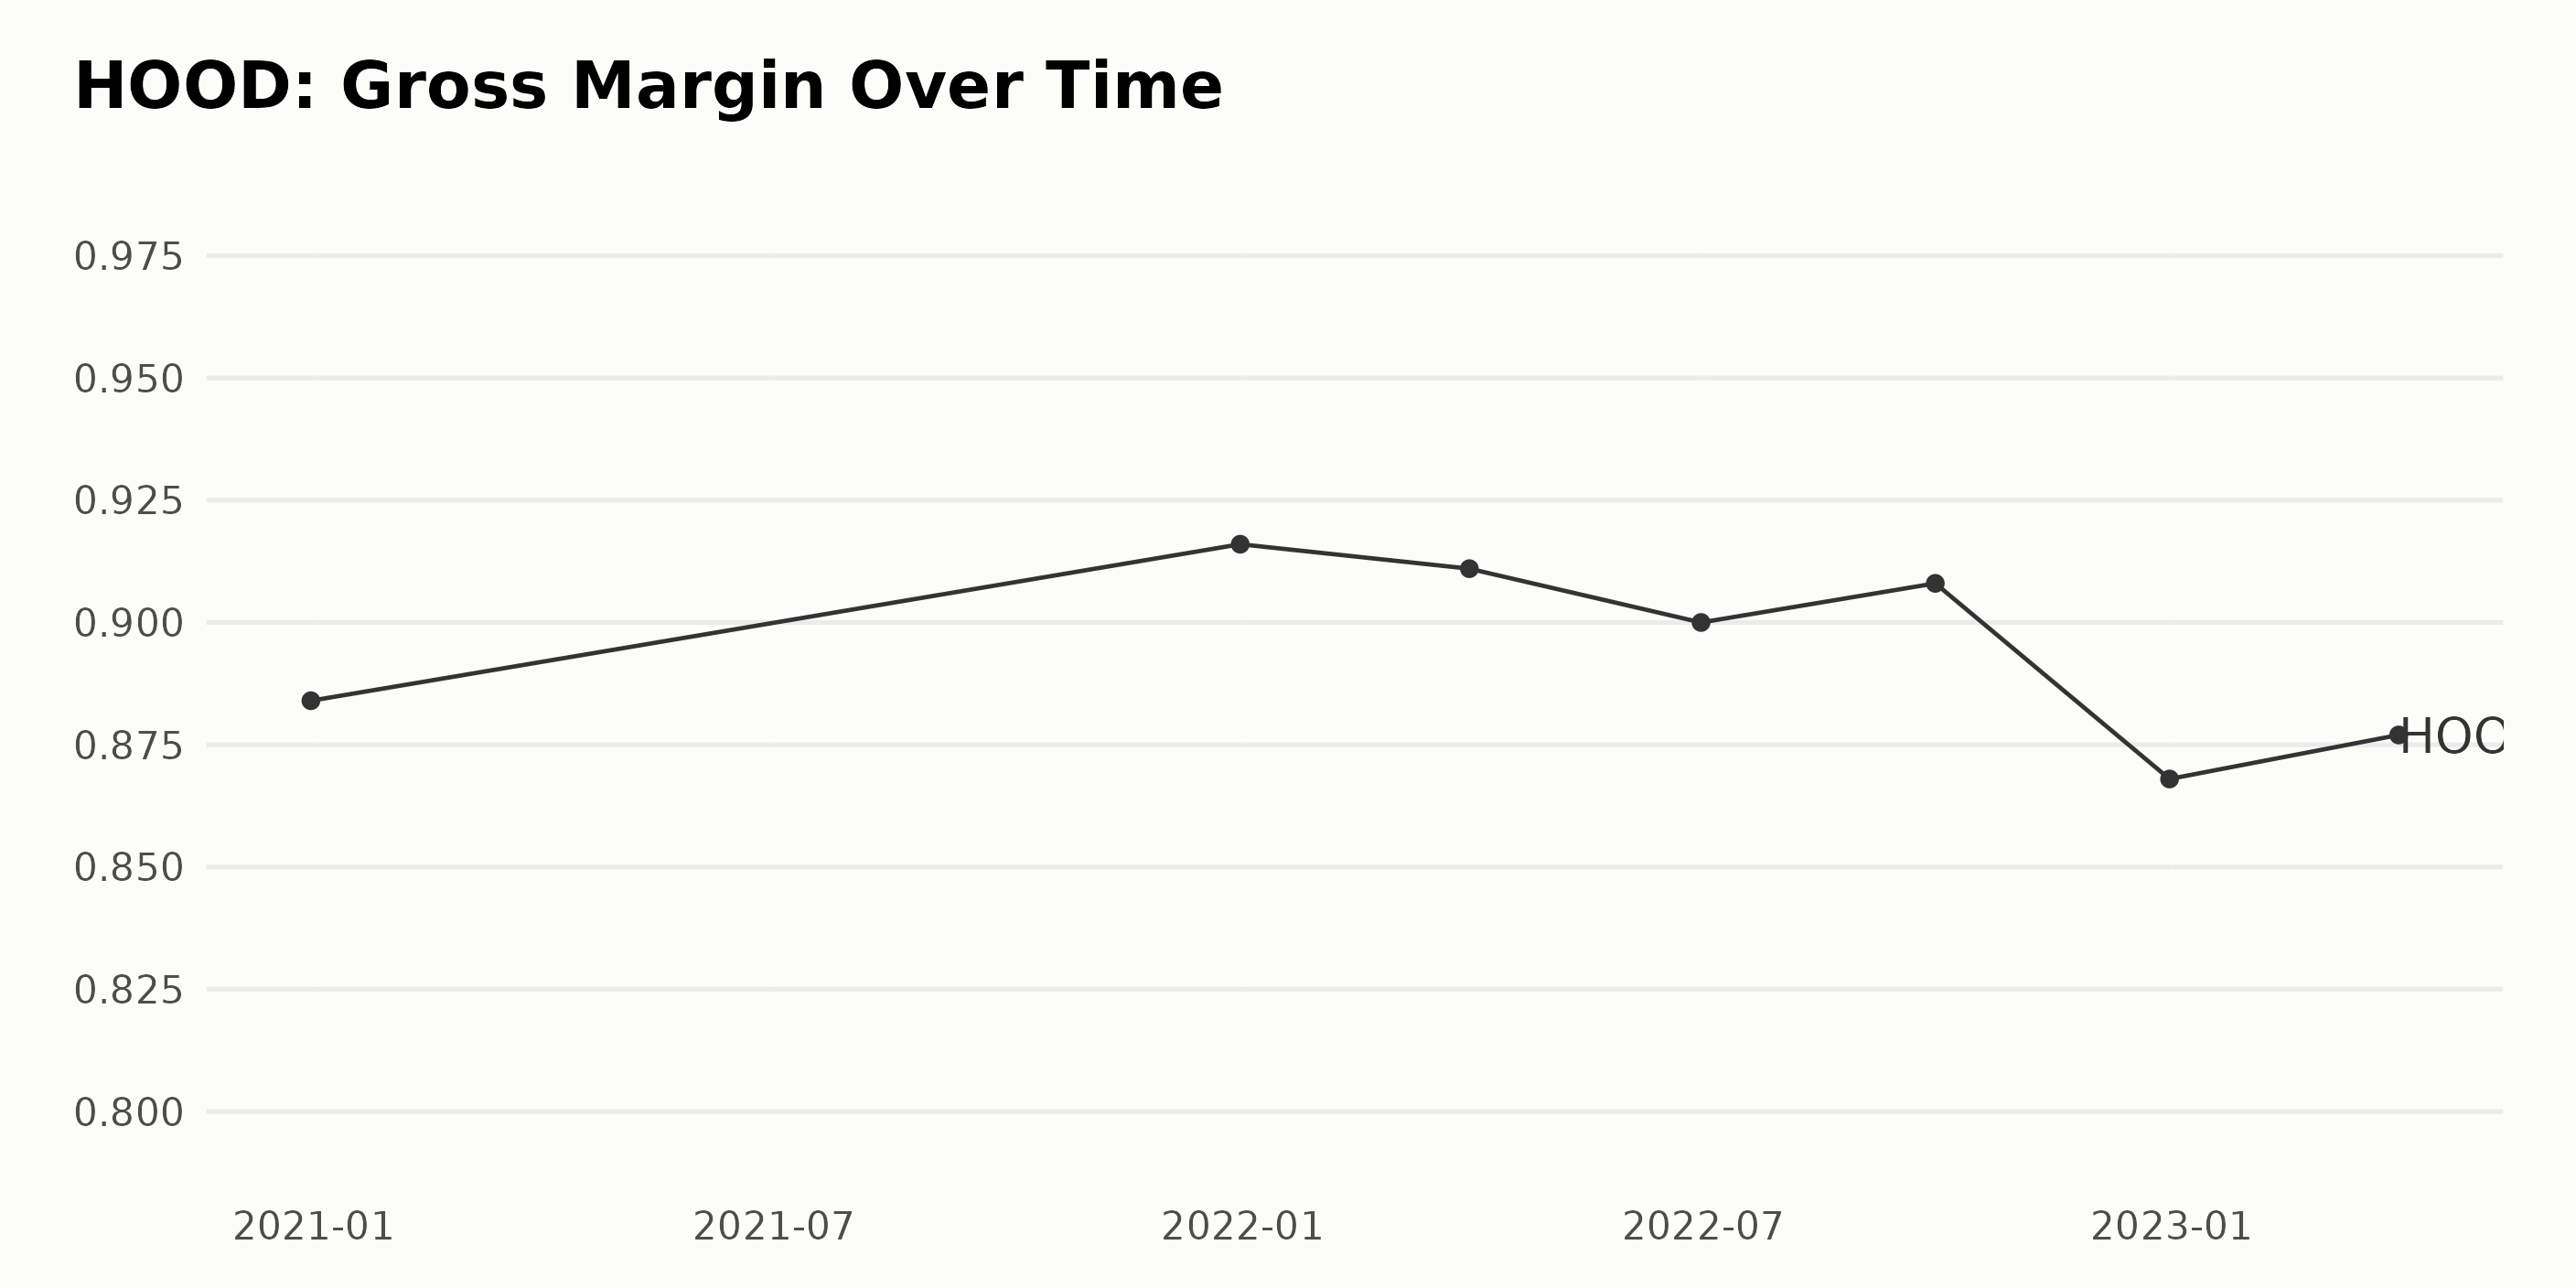
HOOD’s gross margin has experienced fluctuations during the analyzed period. The trend can be summarized as follows — December 2020: 88.4%, December 2021: 91.6%, March 2022: 91.1%, June 2022: 90.0%, September 2022: 90.8%, December 2022: 86.8%, and March 2023: 87.7%.
Overall, there has been a growth rate of -0.7% between December 2020 and March 2023. It is important to note that more recent data showcases a downward trend in gross margin, with the last reported value being 87.7% in March 2023. This indicates that HOOD’s gross margin might be slightly declining or experiencing some instability in its performance.
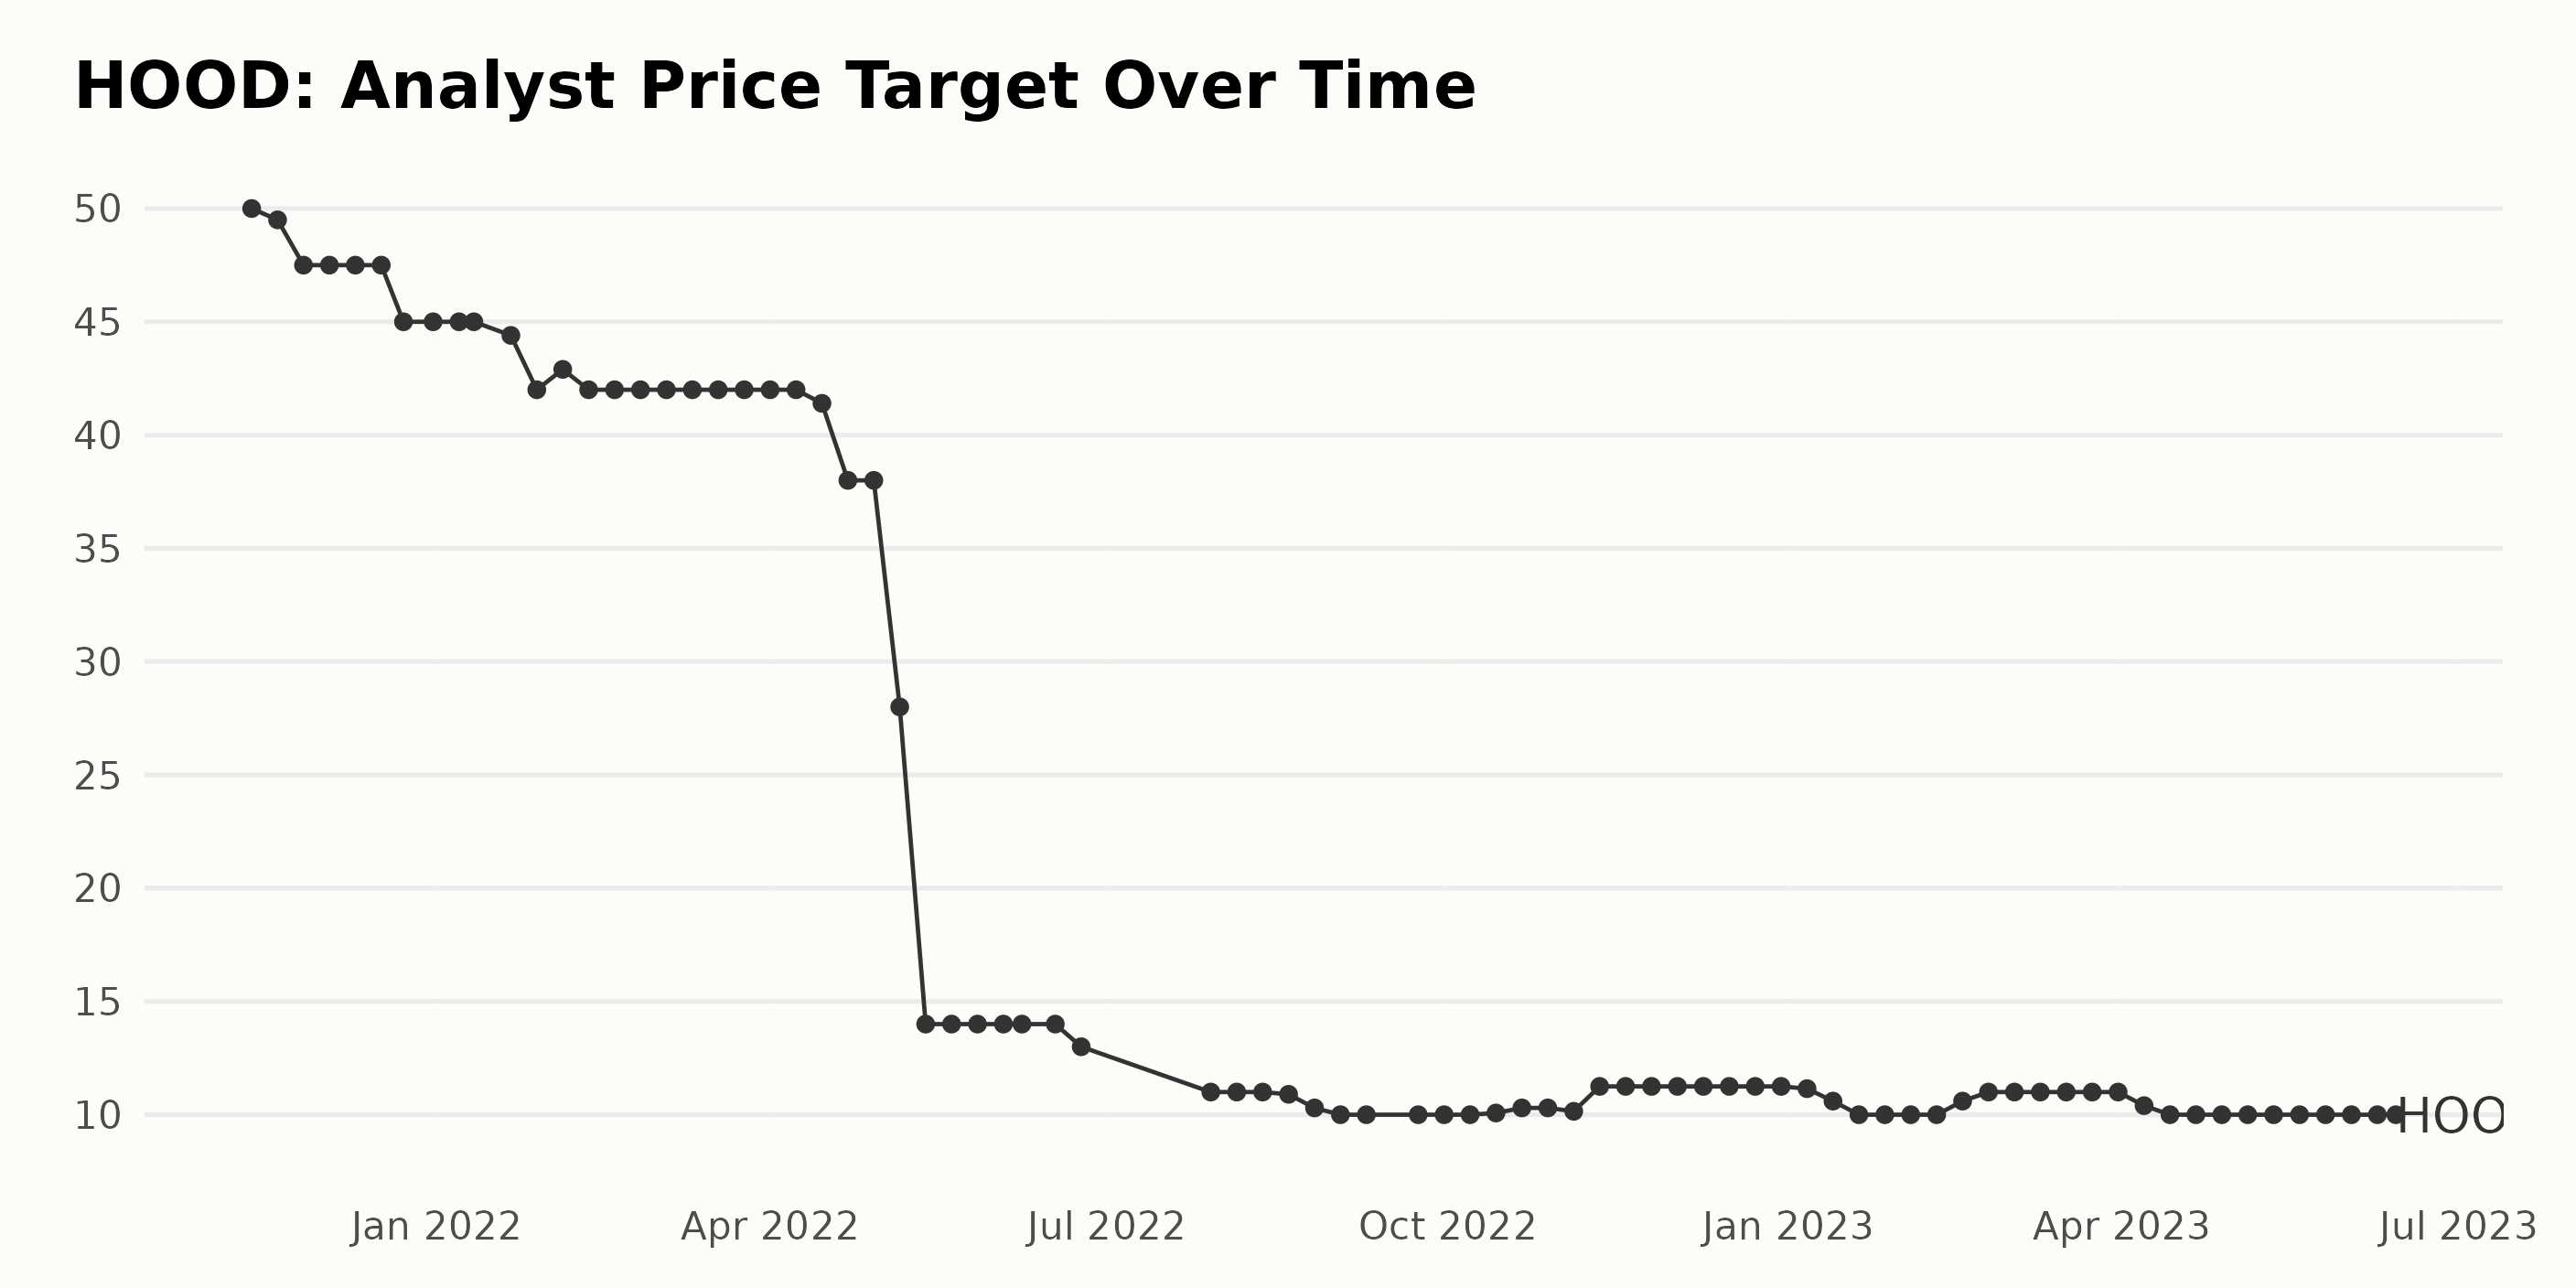
Here is a summary of the trend and fluctuations in the analyst price target of HOOD, emphasizing recent data:- From November 2021 to June 2023, the price target has shown an overall downtrend, decreasing from $50 to $10. The growth rate from the first value to the last is -80%.
The price target fluctuated throughout the series, with a noticeable drop between May 6, 2022, at $28, and May 13, 2022, at $14. Another significant decrease occurred between April 22, 2022, and May 6, 2022, when the price target dropped from $38 to $28. In recent months, specifically since October 2022, the price target has stabilized between $10 and $11.25.
Notably, the price target experienced a brief increase from $10 to $11 between February 17, 2023, and March 31, 2023, before stabilizing again at $10. In conclusion, the overall trend for HOOD’s analyst price target has been negative and experienced a few noteworthy fluctuations. However, the price target has shown more stability in recent months.
Analyzing HOOD’s Share Price: Fluctuations and Market Uncertainties (December 2022 – June 2023)
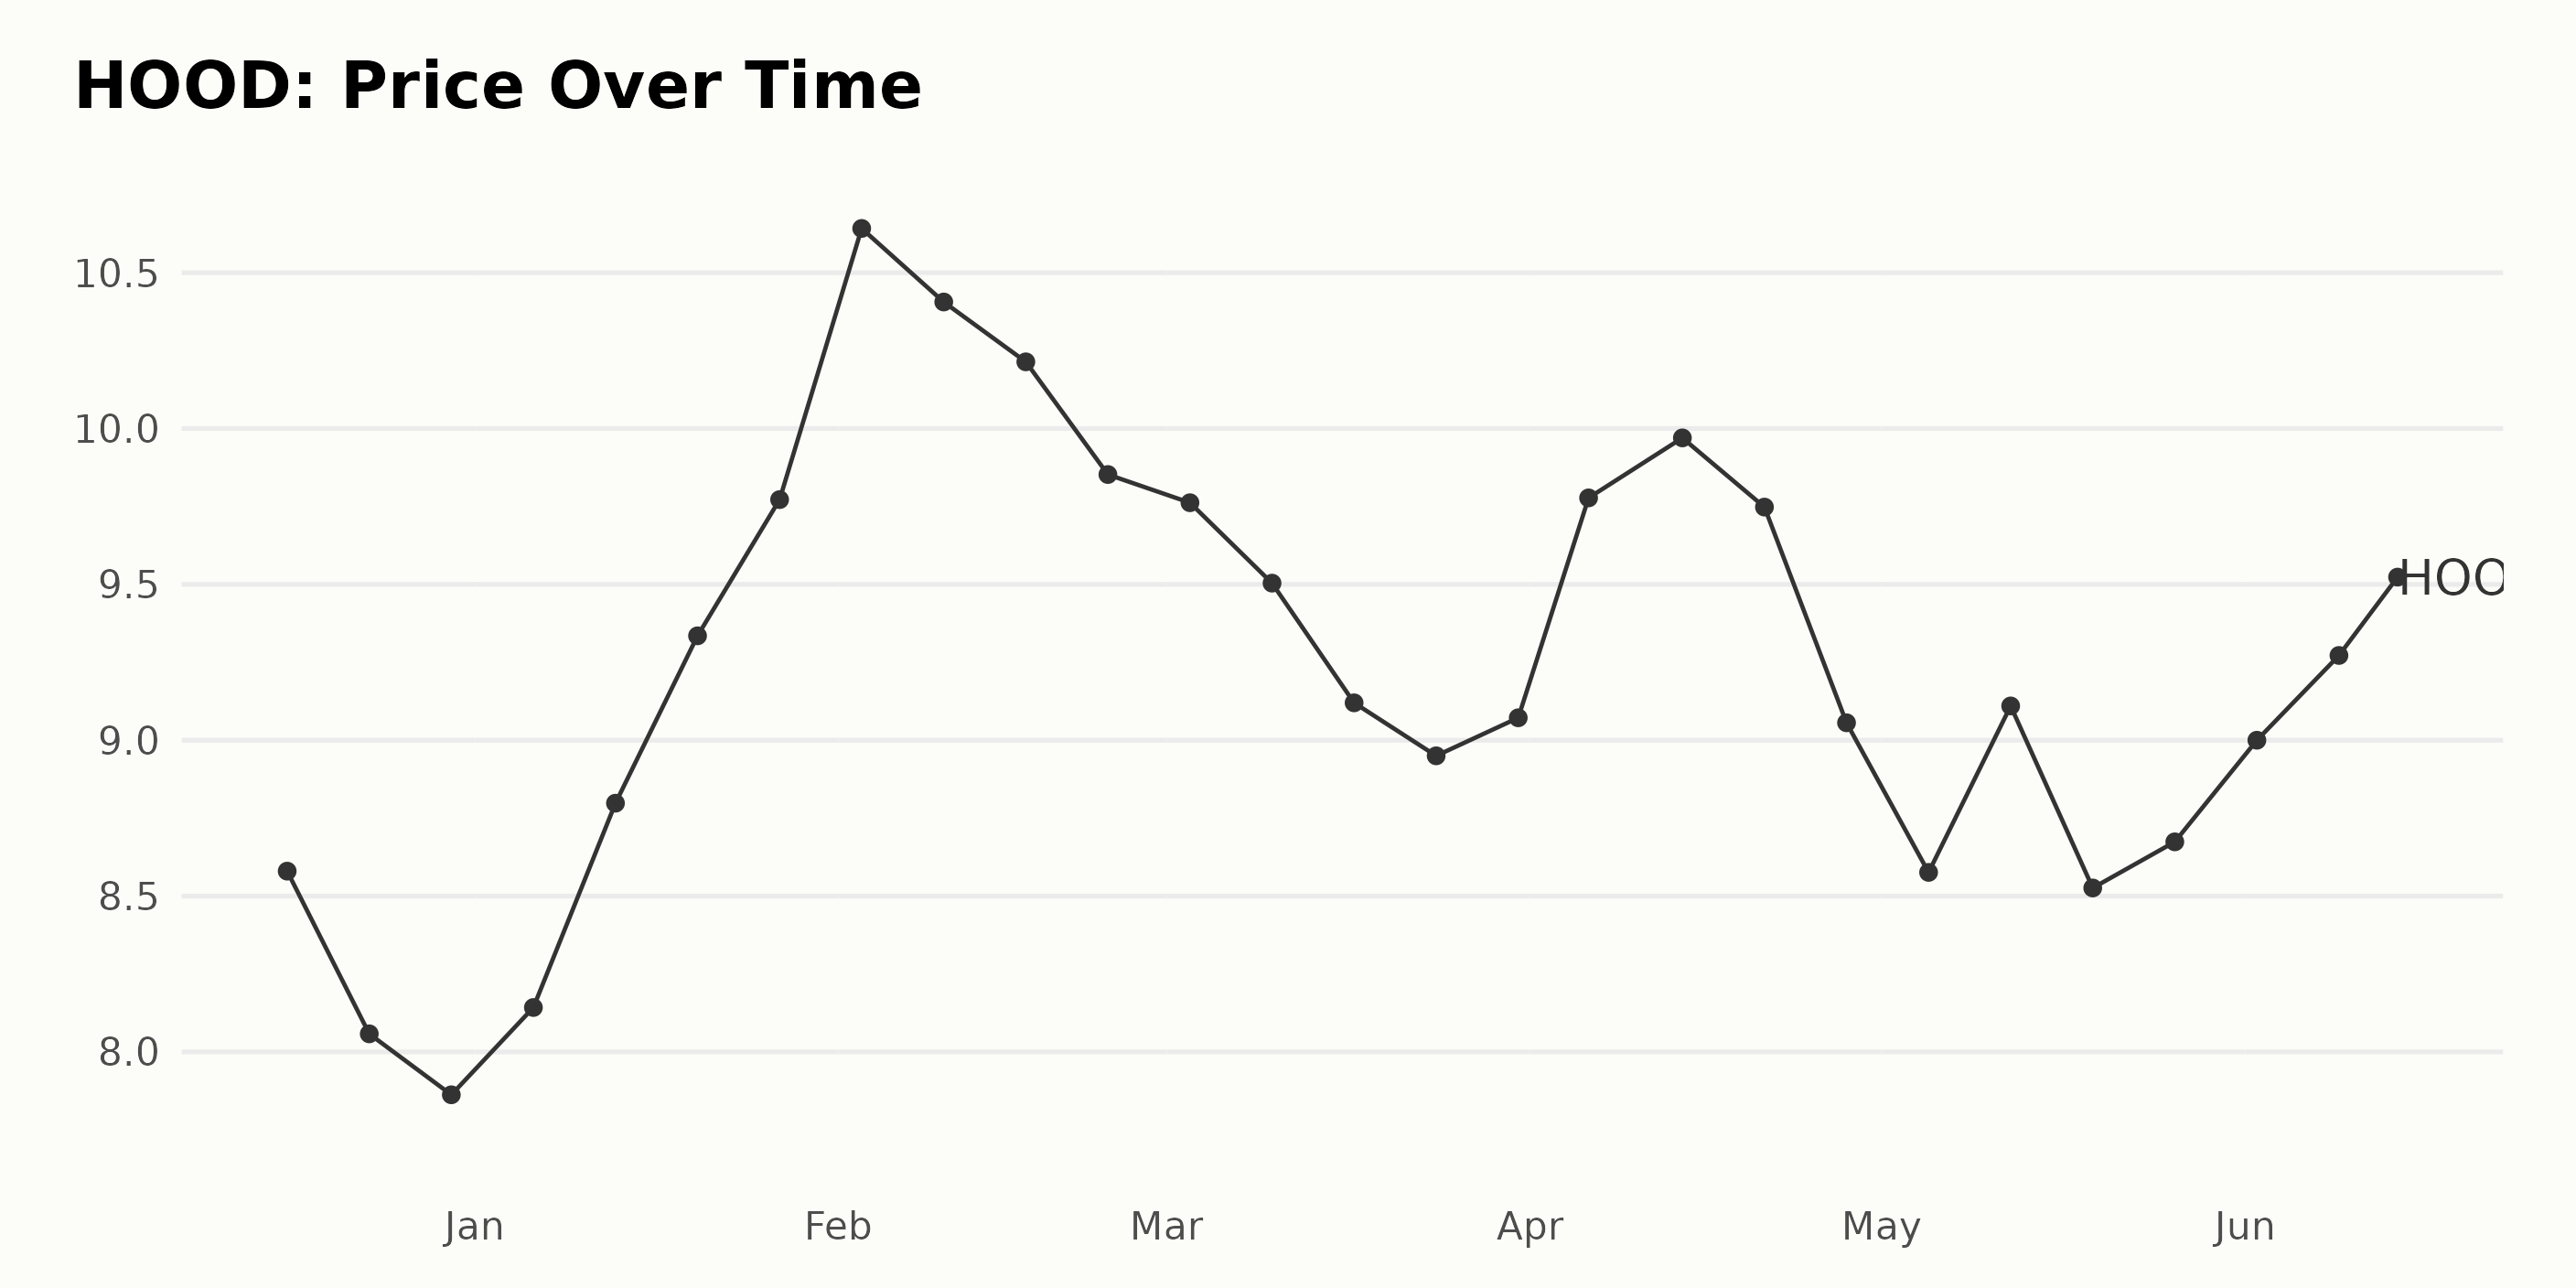
Based on the provided data, the trend and growth rate of HOOD’s share price can be described as follows:
- December 16, 2022: $8.58
- December 23, 2022: $8.06
- December 30, 2022: $7.86
- January 6, 2023: $8.14
- January 13, 2023: $8.80
- January 20, 2023: $9.34
- January 27, 2023: $9.77
- February 3, 2023: $10.64
- February 10, 2023: $10.41
- February 17, 2023: $10.21
- February 24, 2023: $9.85
- March 3, 2023: $9.76
- March 10, 2023: $9.50
- March 17, 2023: $9.12
- March 24, 2023: $8.95
- March 31, 2023: $9.07
- April 6, 2023: $9.78
- April 14, 2023: $9.97
- April 21, 2023: $9.75
- April 28, 2023: $9.06
- May 5, 2023: $8.58
- May 12, 2023: $9.11
- May 19, 2023: $8.53
- May 26, 2023: $8.67
- June 2, 2023: $9.00
- June 9, 2023: $9.27
- June 13, 2023: $9.60
The overall trend for HOOD’s share price from December 2022 to June 2023 appears to be fluctuating. The stock price initially decreased from $8.58 in December 2022 to a low of $7.86 by the end of the month. However, after that, the stock began a relatively steady climb, peaking at $10.64 in early February 2023.
After the peak, the share price experienced some volatility and ultimately decreased to $8.53 by May 19, 2023. The stock began to rise again, reaching $9.60 by June 13, 2023. This dataset has no consistent accelerating or decelerating trend, indicating fluctuations and potential market uncertainties. Here is a chart of HOOD’s price over the past 180 days.
Analyzing HOOD’s Top 3 POWR Ratings Dimensions: Momentum, Growth, and Quality
As of June 13, 2023, the overall POWR Ratings grade for HOOD is D, which equates to Sell. This rating has remained consistent in recent months, with some weeks dipping to an F (Strong Sell) rating.
The rank-in-category for HOOD has varied but has generally been on the lower end, indicating a less favorable position compared to others in its category. It is ranked #126 out of 136 stocks within the D-rated Software – Application industry.
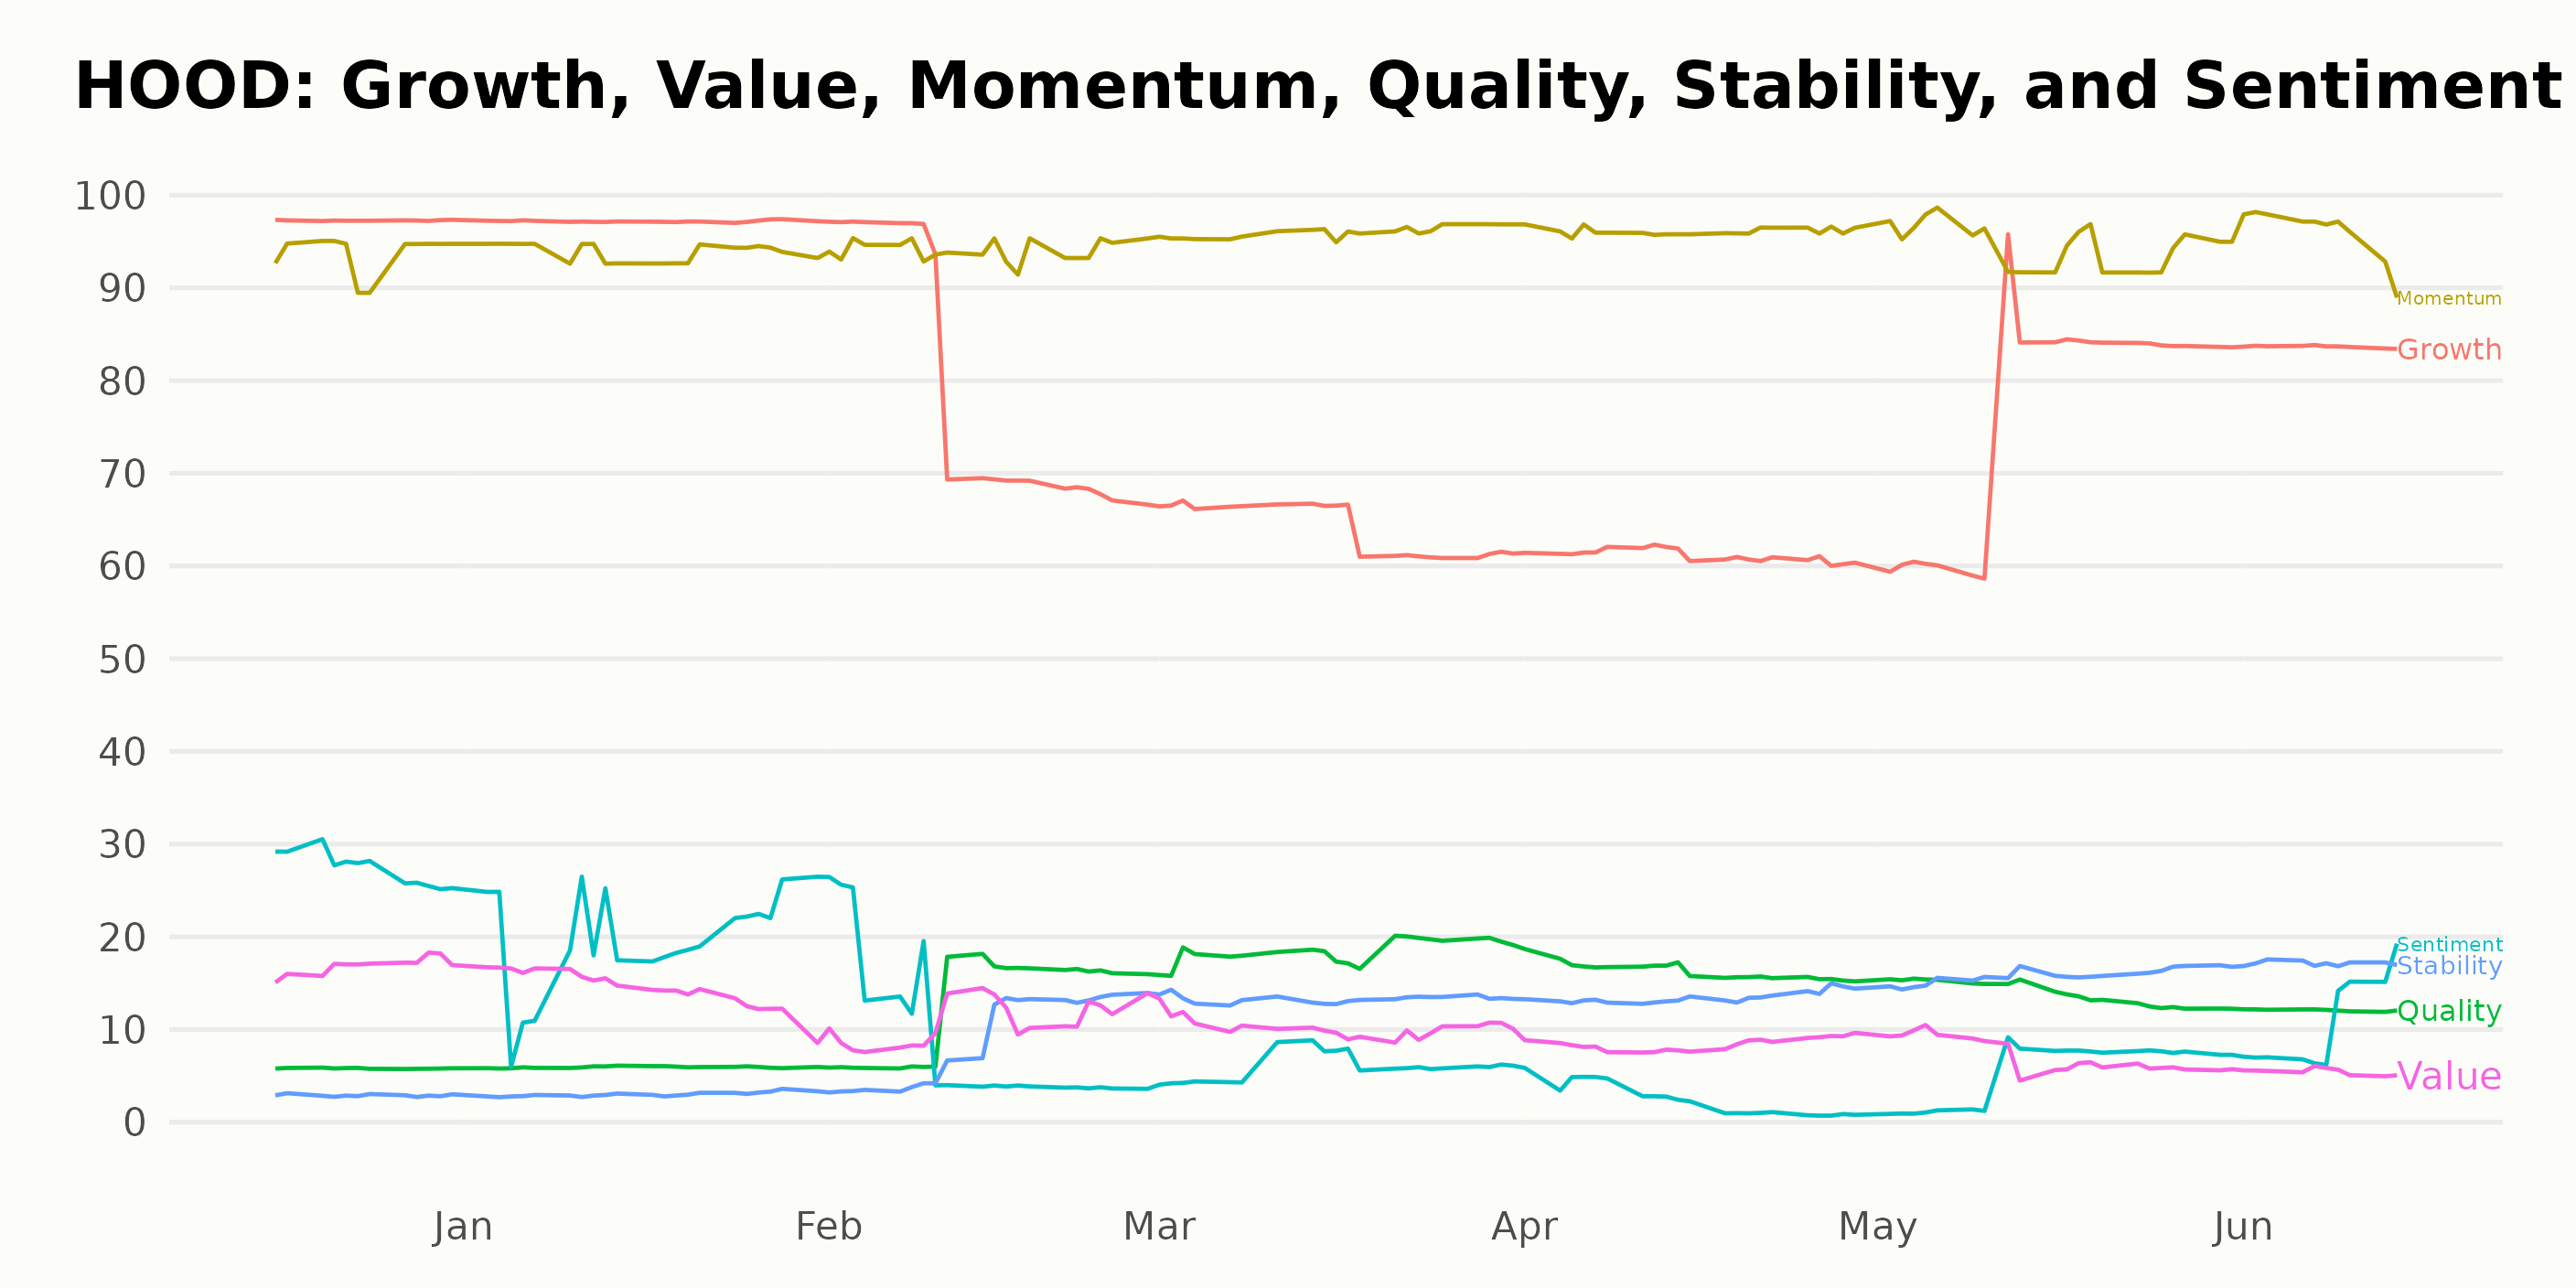
The POWR Ratings for HOOD reveal the top 3 most noteworthy dimensions as follows:
- Momentum consistently remains strong throughout the period, with a peak of 97 on June 13, 2023.
- Growth starts high at 97 on December 31, 2022, and then decreases to the lowest score of 61 on April 29, 2023, before beginning to rebound back up to 84 by June 13, 2023.
- The Quality dimension shows a gradual improvement trend from an initial score of 6 on December 31, 2022, to 19 on March 31, 2023. There is a slight dip to 12 by June 13, 2023, but still higher than the initial value.
How does Robinhood Markets, Inc. (HOOD) Stack Up Against its Peers?
Other stocks in the Software – Application sector that may be worth considering are eGain Corporation (EGAN), Commvault Systems, Inc. (CVLT), and IBEX Limited (IBEX) – they have better POWR Ratings.
What To Do Next?
Discover 10 widely held stocks that our proprietary model shows have tremendous downside potential. Please make sure none of these “death trap” stocks are lurking in your portfolio:
Want More Great Investing Ideas?
HOOD shares were trading at $9.67 per share on Wednesday morning, up $0.07 (+0.73%). Year-to-date, HOOD has gained 18.80%, versus a 14.84% rise in the benchmark S&P 500 index during the same period.
About the Author: Anushka Dutta

Anushka is an analyst whose interest in understanding the impact of broader economic changes on financial markets motivated her to pursue a career in investment research. More...
More Resources for the Stocks in this Article
| Ticker | POWR Rating | Industry Rank | Rank in Industry |
| HOOD | Get Rating | Get Rating | Get Rating |
| EGAN | Get Rating | Get Rating | Get Rating |
| CVLT | Get Rating | Get Rating | Get Rating |
| IBEX | Get Rating | Get Rating | Get Rating |