
Home improvement retailer Lowe’s Companies, Inc. (LOW) is set to report its third-quarter earnings tomorrow amid the broad setback in the home improvement market due to the current economic climate.
On the other hand, the company’s second-quarter financials indicated improving consumer sentiment, as spending on small-scale repair and maintenance partially offset the fall in demand for large items. Its $4.56 EPS topped the expected $4.49, while the company reaffirmed its fiscal 2023 outlook for its operational results.
On top of that, the company has 60 years of consecutive dividend growth. On November 10, LOW declared a quarterly cash dividend of $1.10 per share, payable to shareholders on February 7, 2024. Its annual dividend of $4.40 yields 2.16% on prevailing prices. Its dividend payouts have grown at CAGRs of 24.1% and 19.3% over the past three and five years, respectively.
Amid this, let’s look at the trends of LOW’s key financial metrics to understand why it could be prudent to invest in the stock now.
Analyzing Lowe’s Companies, Inc.’s Financial Performance and Market Trends from 2021-2023
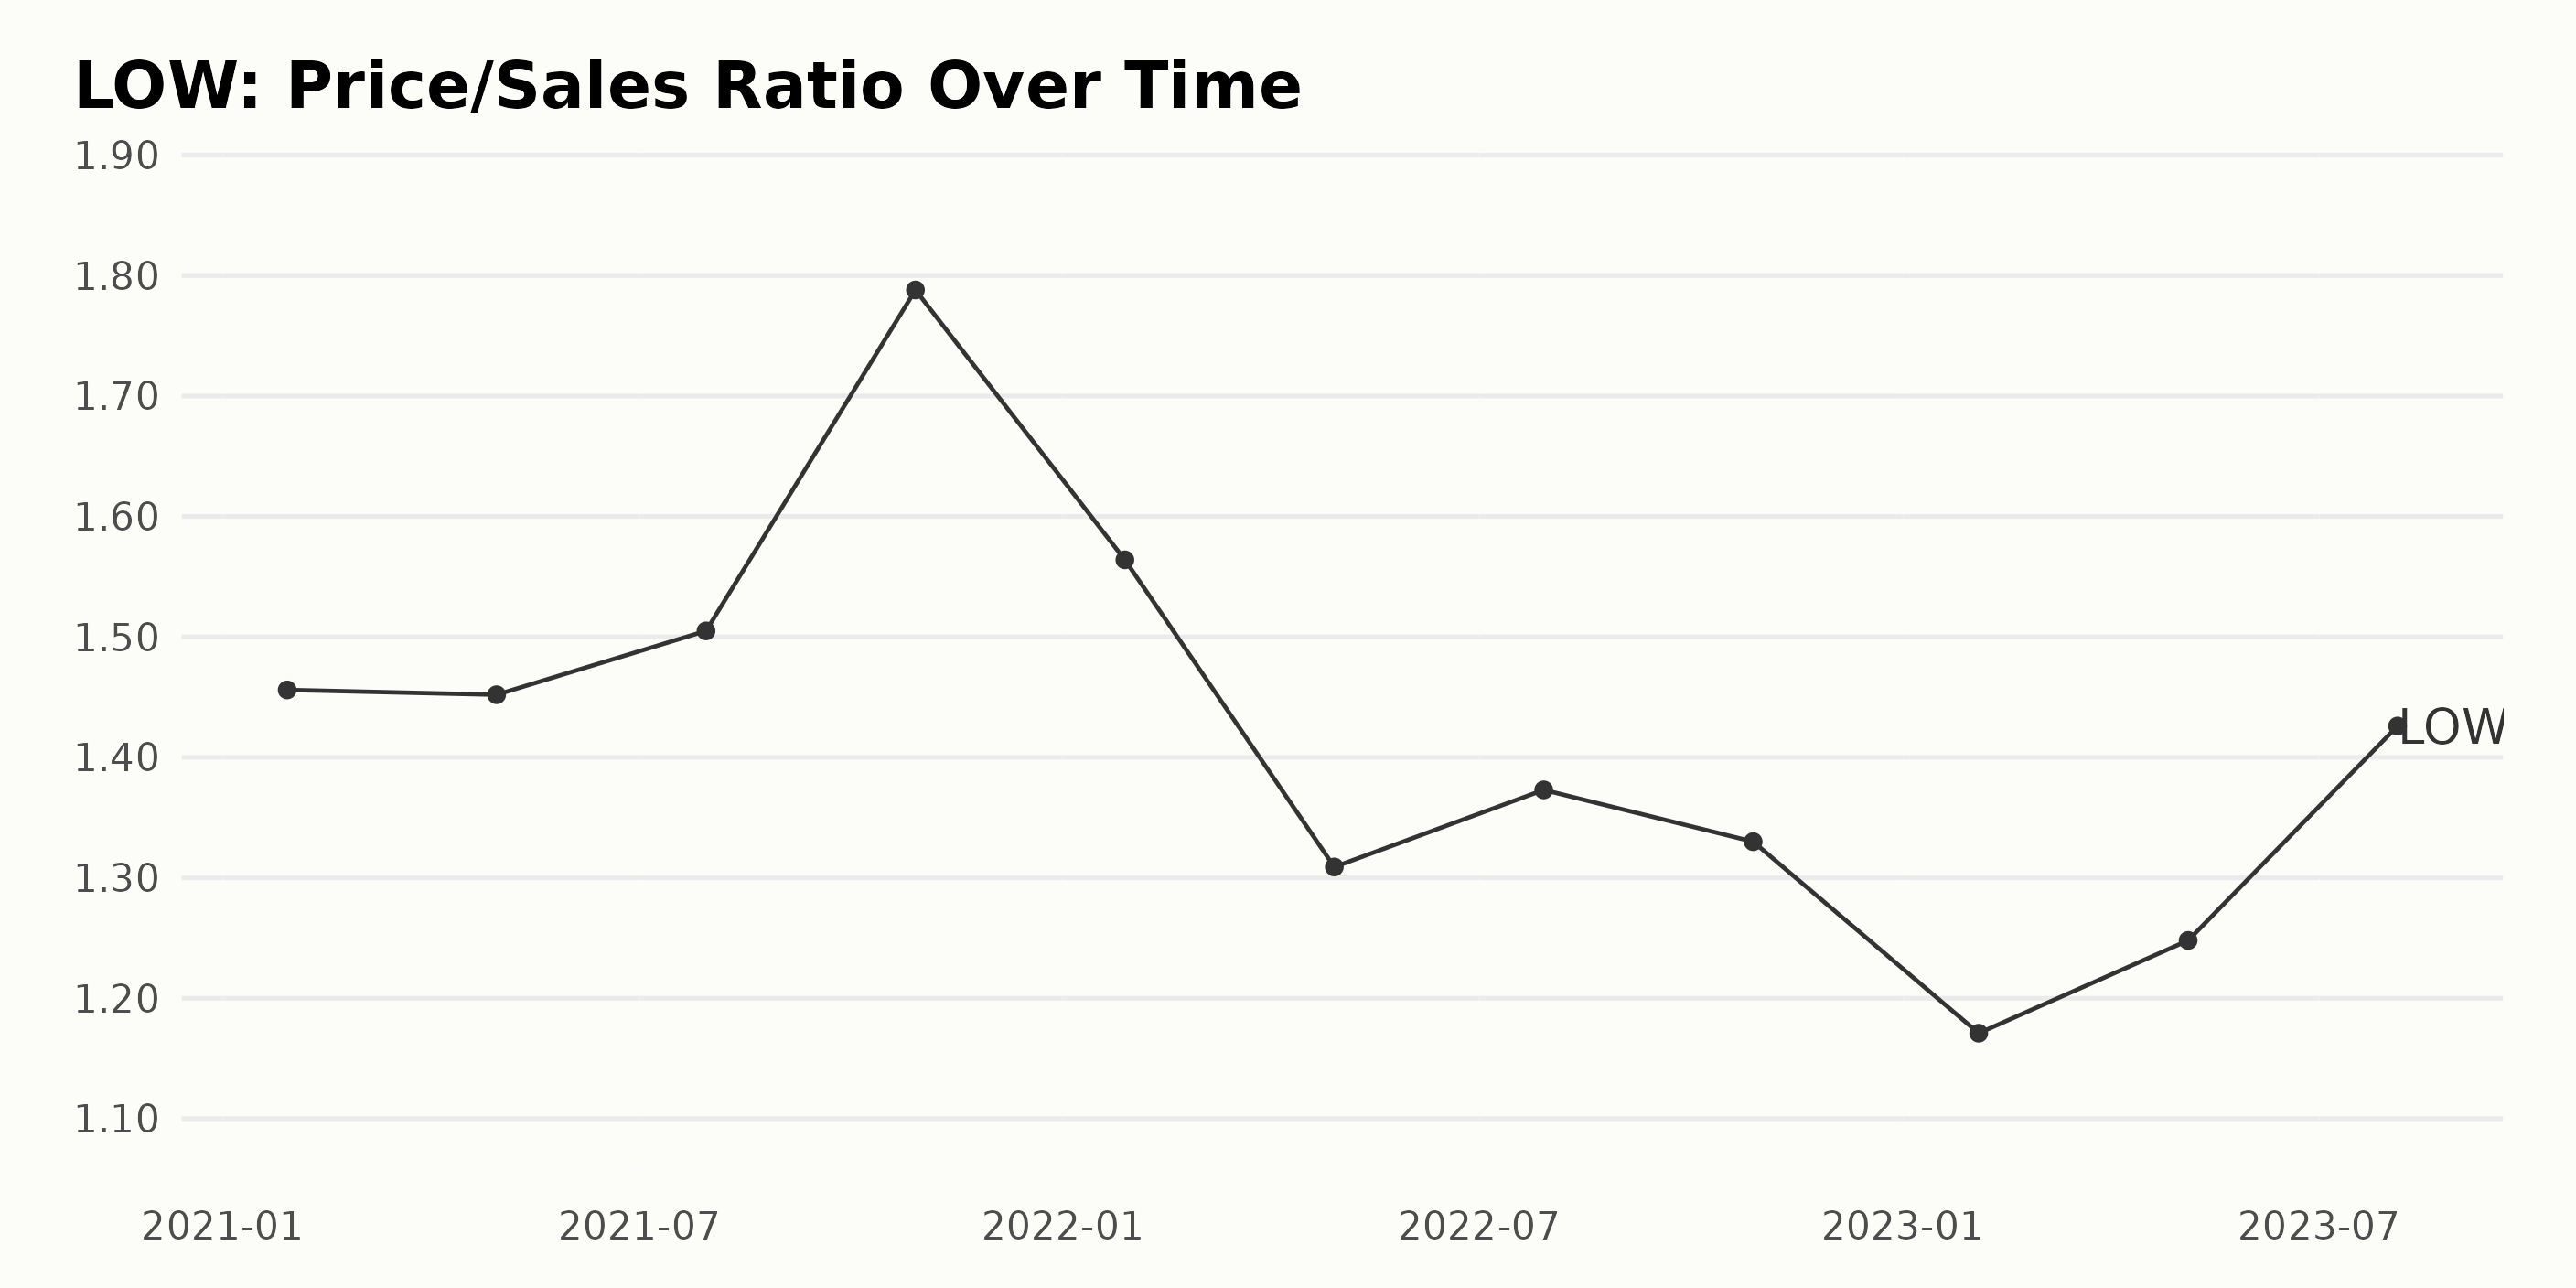
The data set shows the trend and fluctuations in LOW’s Price/Sales ratio (P/S). The data indicates variance in P/S, pointing out potential radical changes in LOW’s market conditions.
- In January 2021, LOW started with a Price/Sales ratio of 1.46.
- The reported figures showed slight instability, with readings hovering between 1.30 and 1.79 from April 2021 to October 2022. In this period, the highest P/S was registered in October 2021 at 1.788, while the lowest was in April 2022 at 1.309.
- Notably, there was a marked decline in P/S from October 2022 (1.33) to February 2023 (1.171), representing a significant decrease in the company’s valuation.
- There was a rebound in LOW’s P/S from February 2023 onwards. By August 2023, it had regained momentum to reach 1.426.
In terms of growth, the Price/Sales ratio has contracted by nearly 0.03 (or ~2%) since January 2021 compared to its most recent reading in August 2023. Greater significance is placed on more recent data in view of recognizing present market climates and their potential implications.
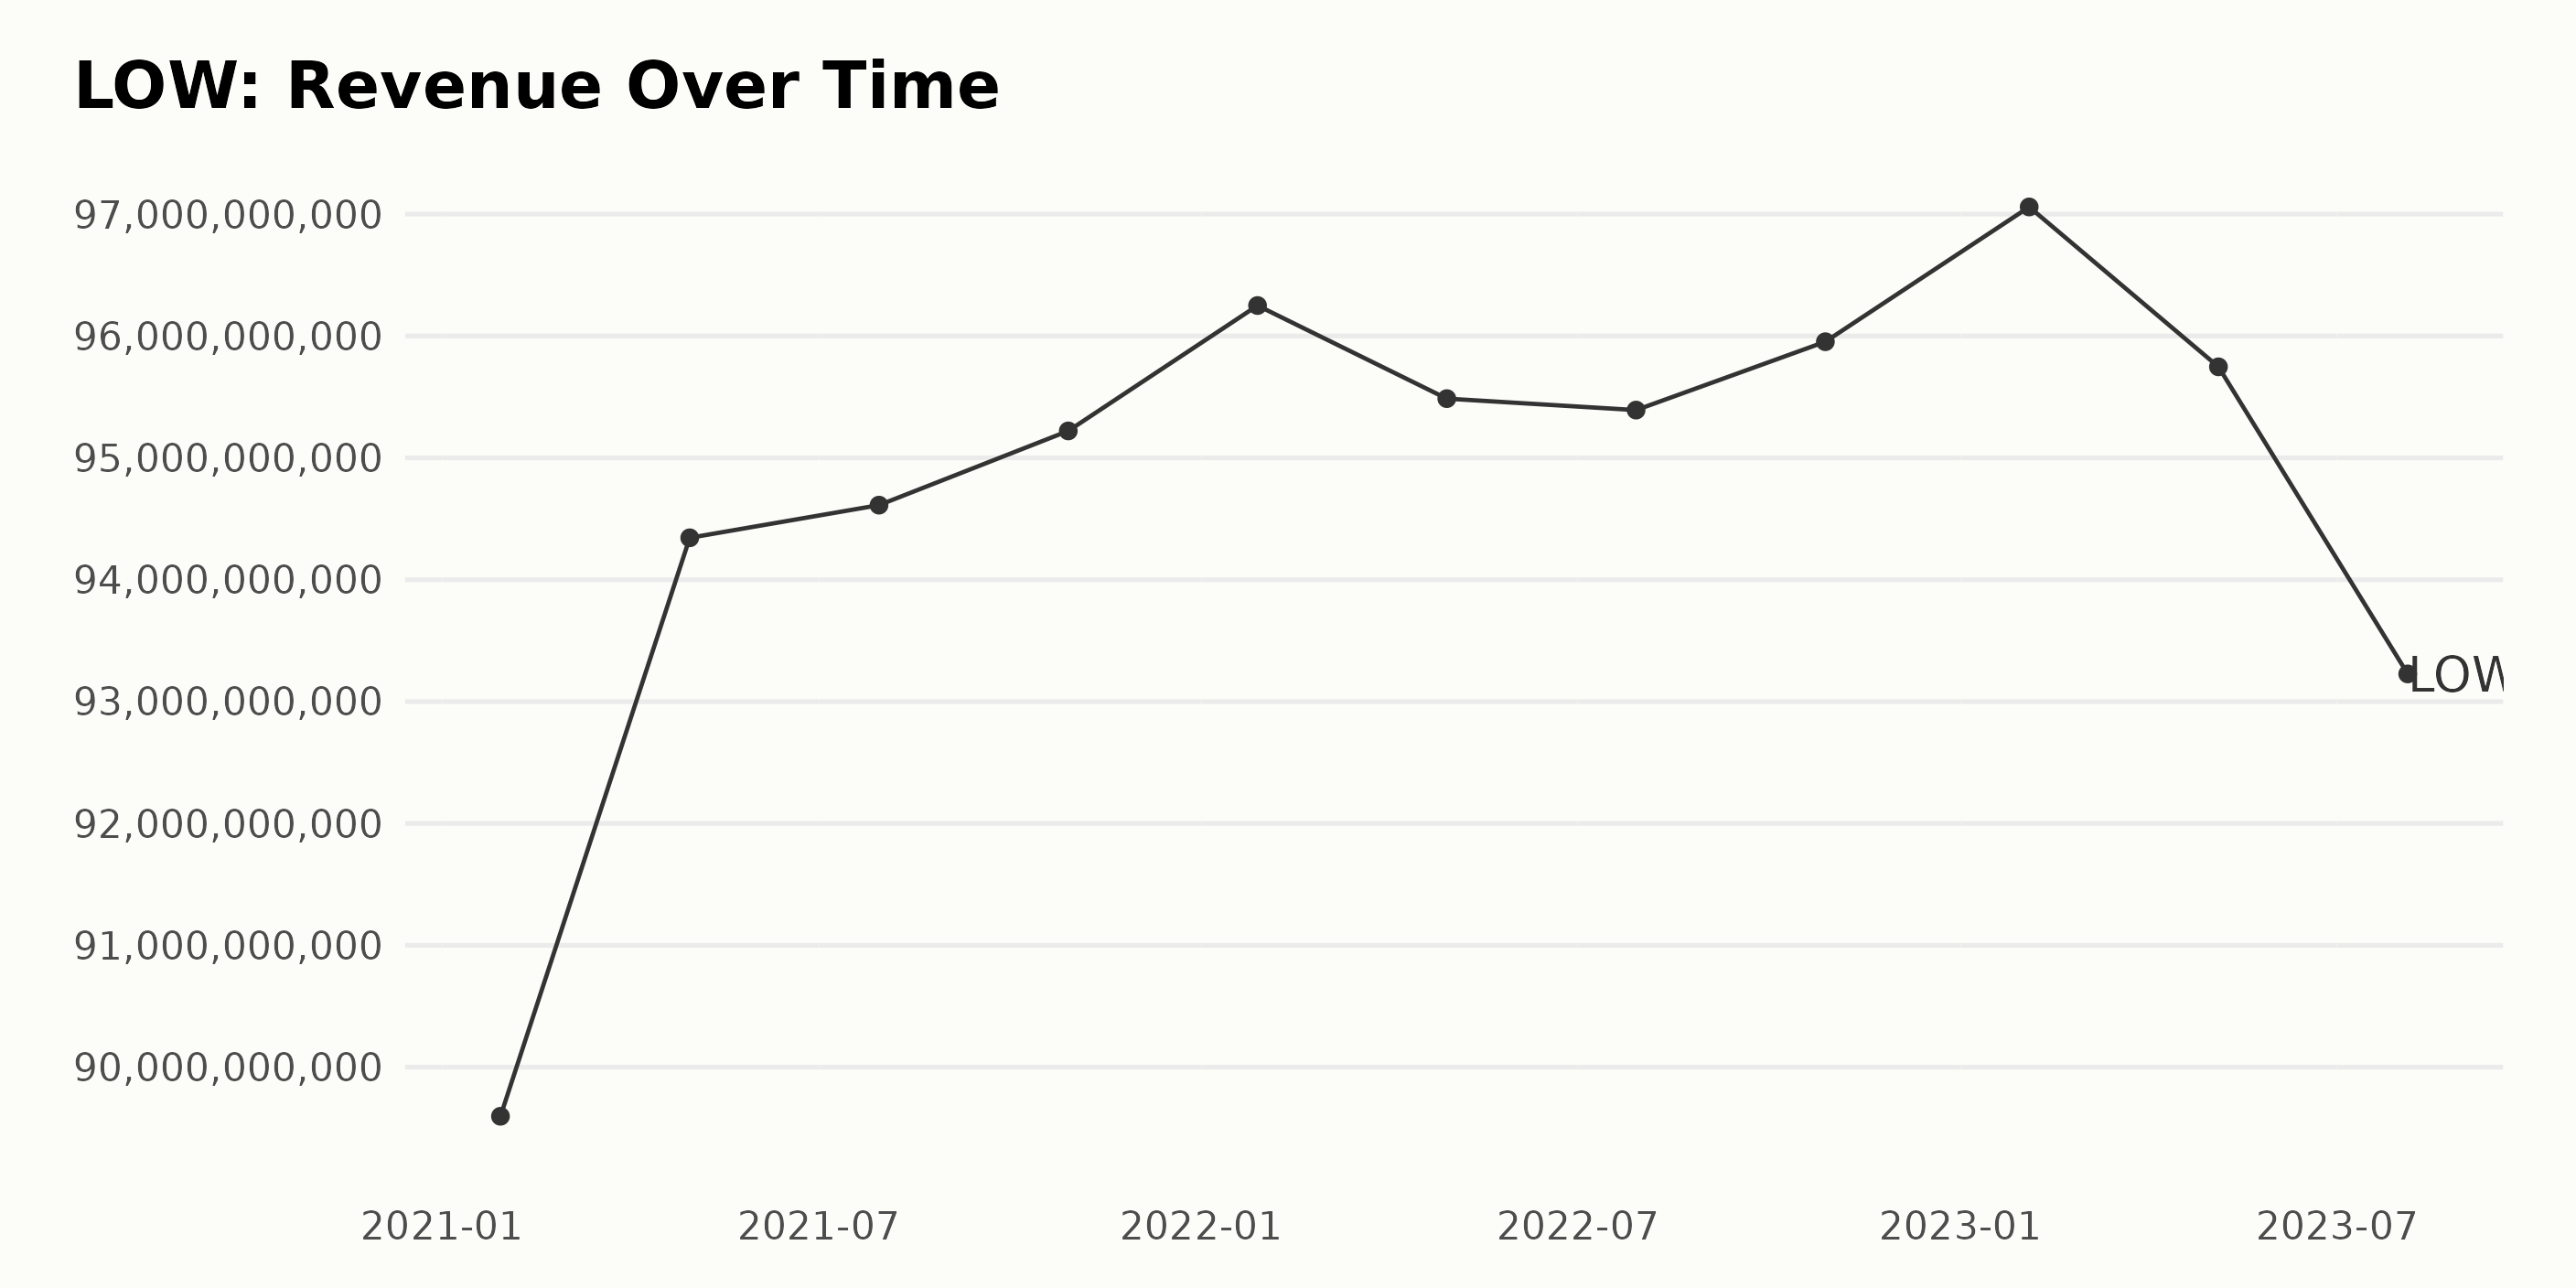
The trailing-12-month revenue trend for LOW tracked fluctuations over the reporting period from 2021 to 2023.
- Starting in January 2021, LOW reported a revenue of $89.60 billion.
- The revenue experienced an overall upward trend and reached $94.64 billion by April 2021.
- However, slight fluctuations were recorded until October 2021, when the revenue was $95.22 billion.
- Revenue witnessed a surge to $96.25 billion in January 2022.
- The revenue dropped in April 2022, producing a figure of $95.49 billion. The revenues reached $95.39 billion in July 2022.
- For the rest of 2022, the revenue saw modest growth, closing at $95.95 billion in October.
- January 2023 marked a peak in the data series, where LOW’s reported a revenue of $97.06 billion.
- Following this spike in revenue, there was a decline through to August 2023, when the value dropped to $93.23 billion, the last value in the series.
In terms of growth rate measured from the first to the last value, LOW has seen about a 7.05% increase in revenues from January 2021 to August 2023. The fluctuation across these years indicates revenue variations, with a general trend towards growth over this period.
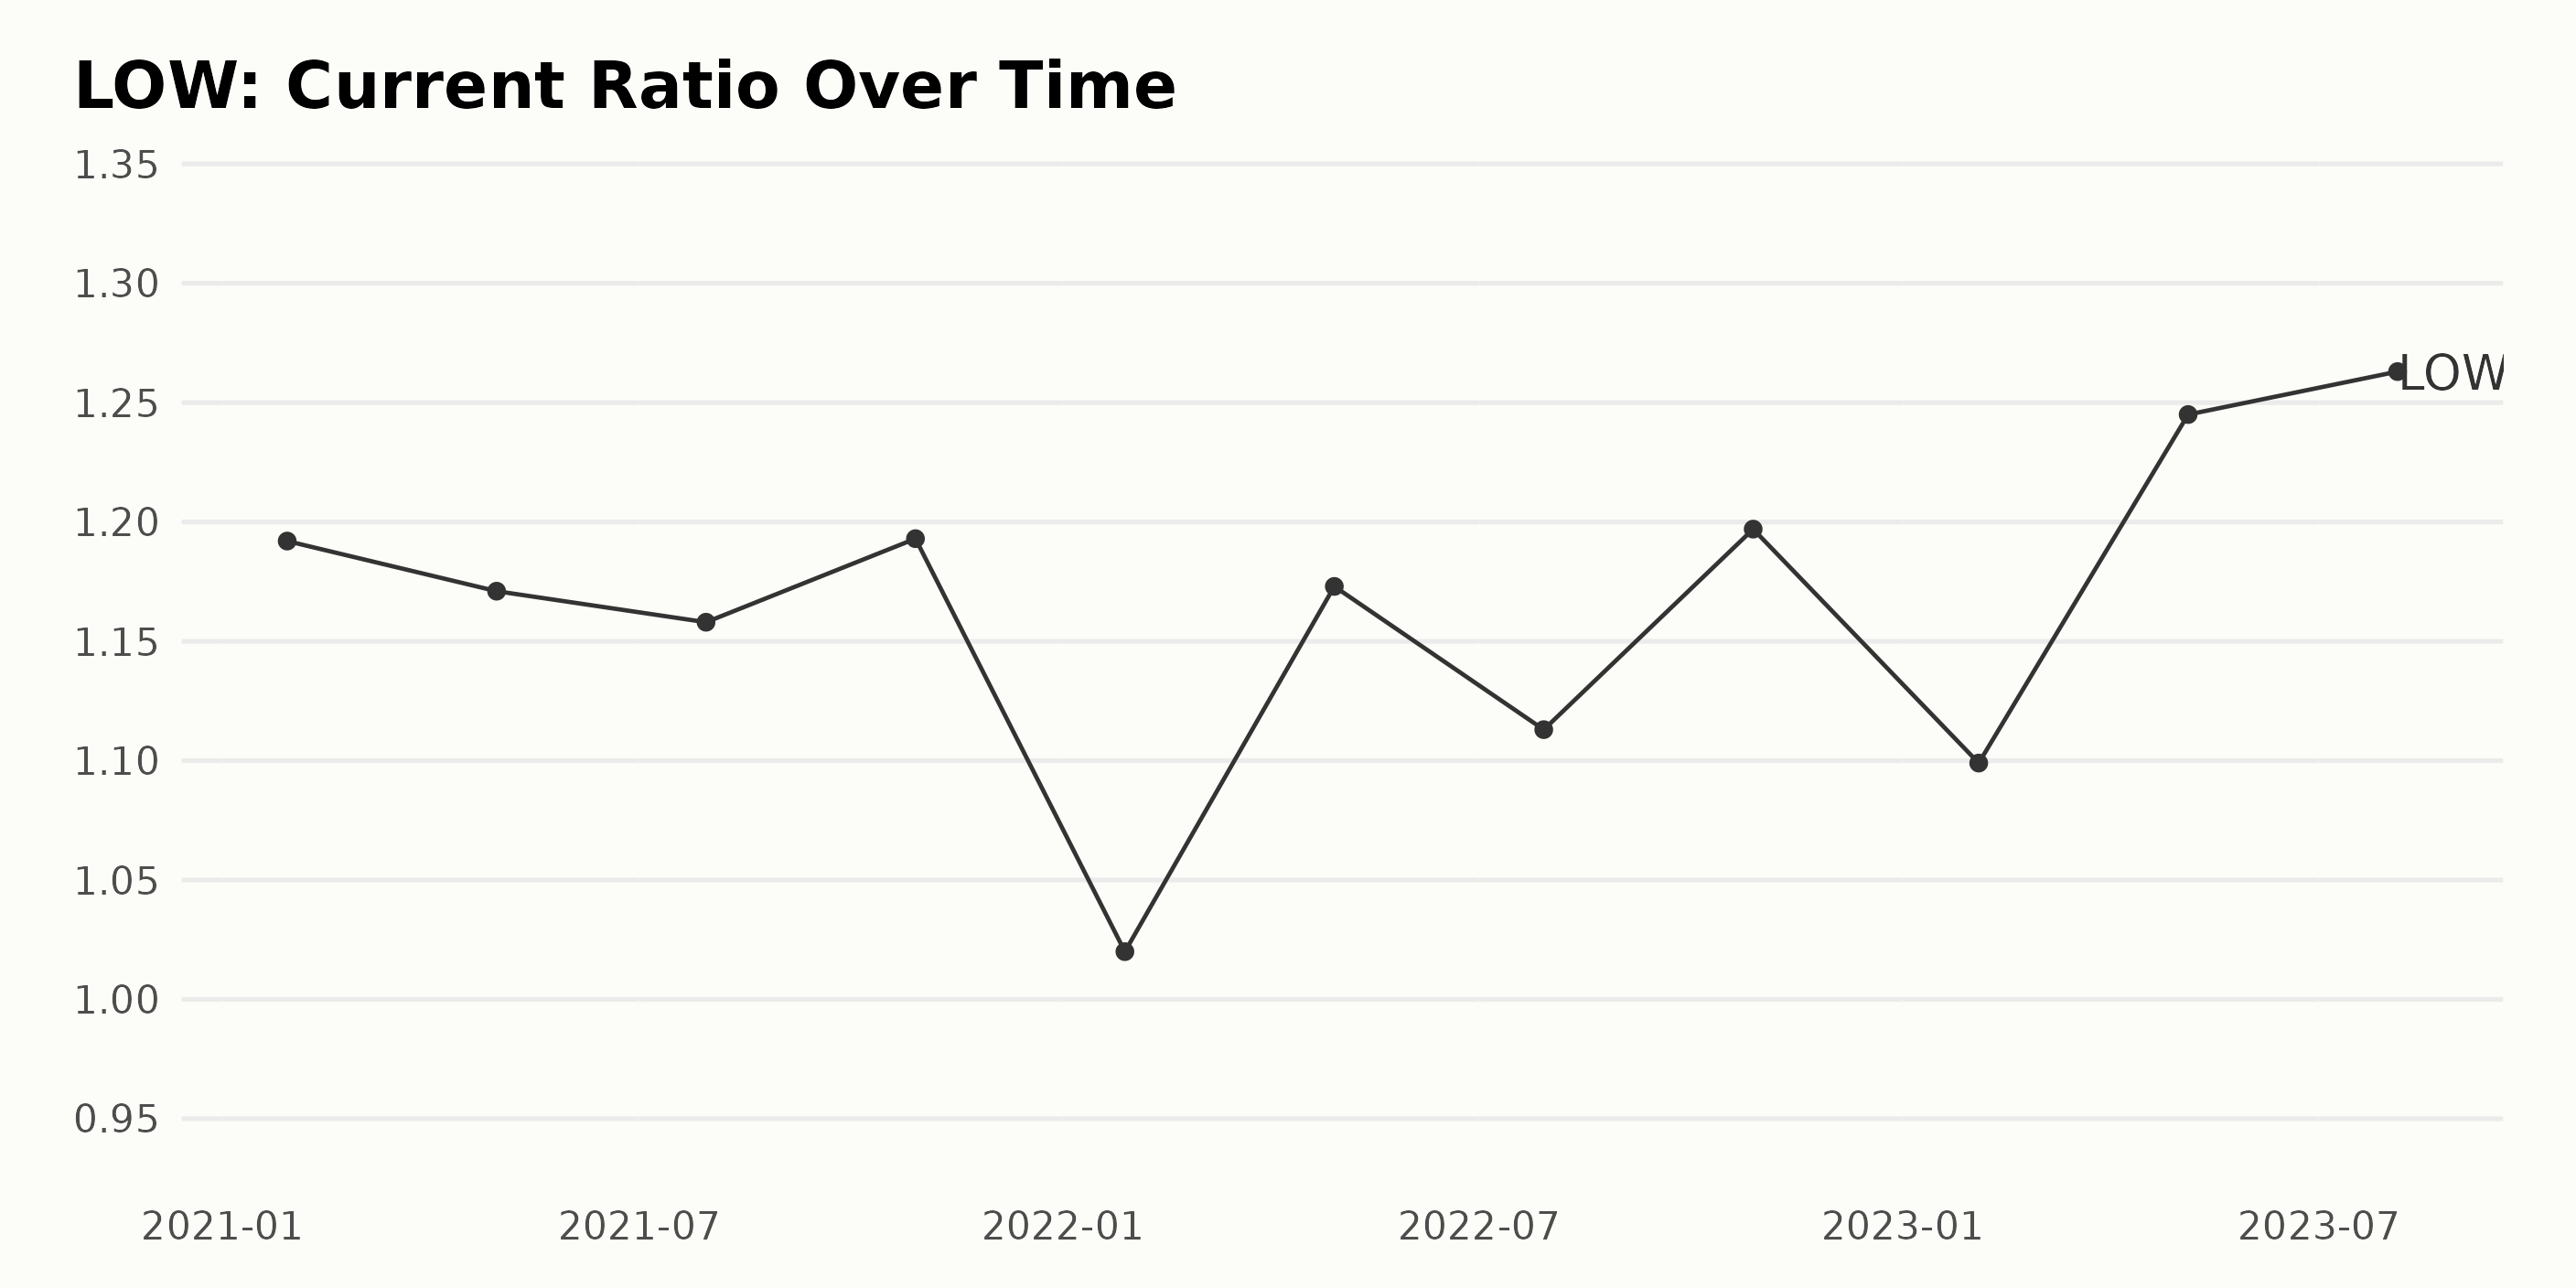
The data series represents the trend and fluctuations of the current ratio for LOW from January 29, 2021, to August 4, 2023. This period observes a moderate increase with occasional dips.
- On January 29, 2021, the current ratio was at 1.19.
- We observe a minor decline over the next few months, reaching 1.16 by July 30, 2021.
- This drop is followed by a slight rise to 1.19 by October 29, 2021, and a steep fall to 1.02 by January 28, 2022, marking the lowest point in the series.
- The ratio then picks up again, peaking at 1.20 by October 28, 2022, before another dip to 1.10 by February 3, 2023.
- The final quarter shows a significant increase, with the ratio reaching its highest point at 1.26 by August 4, 2023.
In terms of growth rate, the current ratio grew from 1.19 on January 29, 2021, to 1.26 by August 4, 2023. This represents an overall increase of approximately 5.9% across the specified time frame. Recent data points suggest an upward trend, with an increase from 1.10 in February 2023 to 1.26 in August 2023, registering a growth of about 14.7%.
This series indicates occasional volatility in LOW’s liquidity status but also suggests an overall increasing trend in their ability to meet short-term obligations, with the most recent period indicating a stronger position.
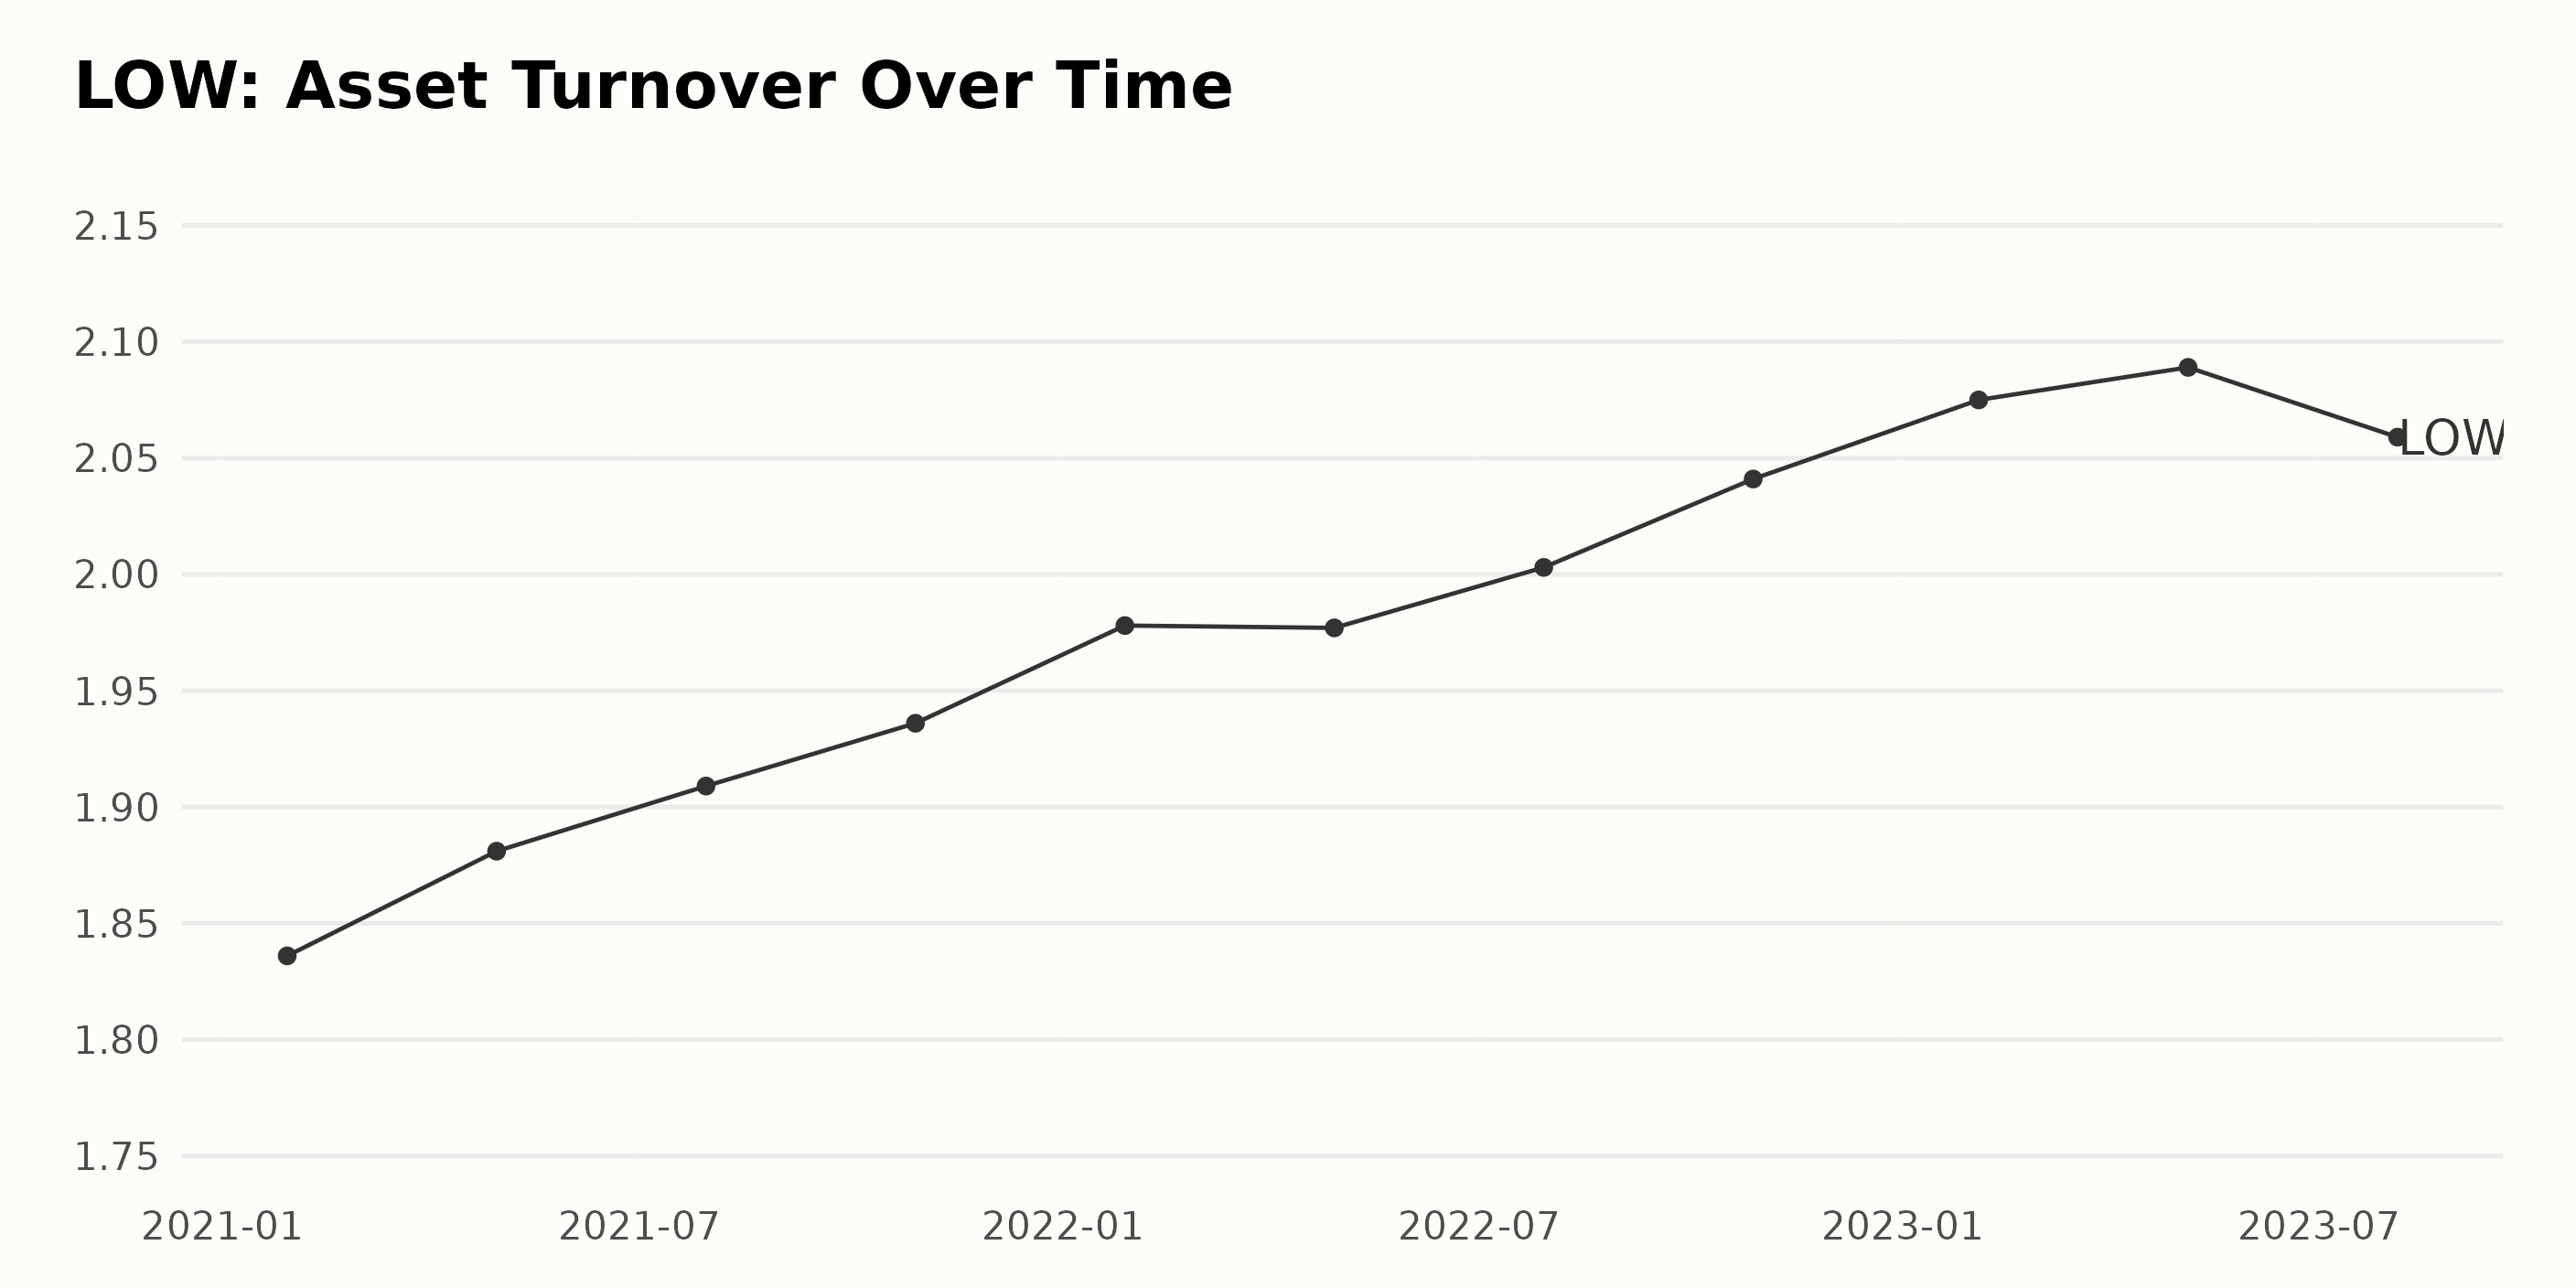
The data series represents the asset turnover of LOW over a specific time frame. Here are the most notable details:
- At the start of the series on January 29, 2021, LOW had an asset turnover value of 1.84.
- The series presents a general upward trend in asset turnover from January 2021 to August 2023.
- By July 2022, the asset turnover metric had initially increased to 2.00, reaching the two-mark for the first time.
- The highest reported asset turnover for LOW was on May 5, 2023, at 2.09. This shows an efficient use of the company’s assets during this period.
- The asset turnover slightly mitigated at the end of the series on August 4, 2023, at 2.06. This indicates a small decrease compared to its peak in May 2023.
In calculating the growth rate from the first to the last value, there has been a positive growth in LOW’s asset turnover by about 12%. This highlights the increasing efficiency of LOW in generating revenue from its assets over the given period.
Overall, we see a consistent augmentation in LOW’s asset turnover over this data series, with some minor fluctuations along the way. This trajectory implies that LOW conditionally improved its asset efficiency from January 2021 to August 2023.
Examining Lowe’s Share Price Fluctuations: May-November 2023 Analysis
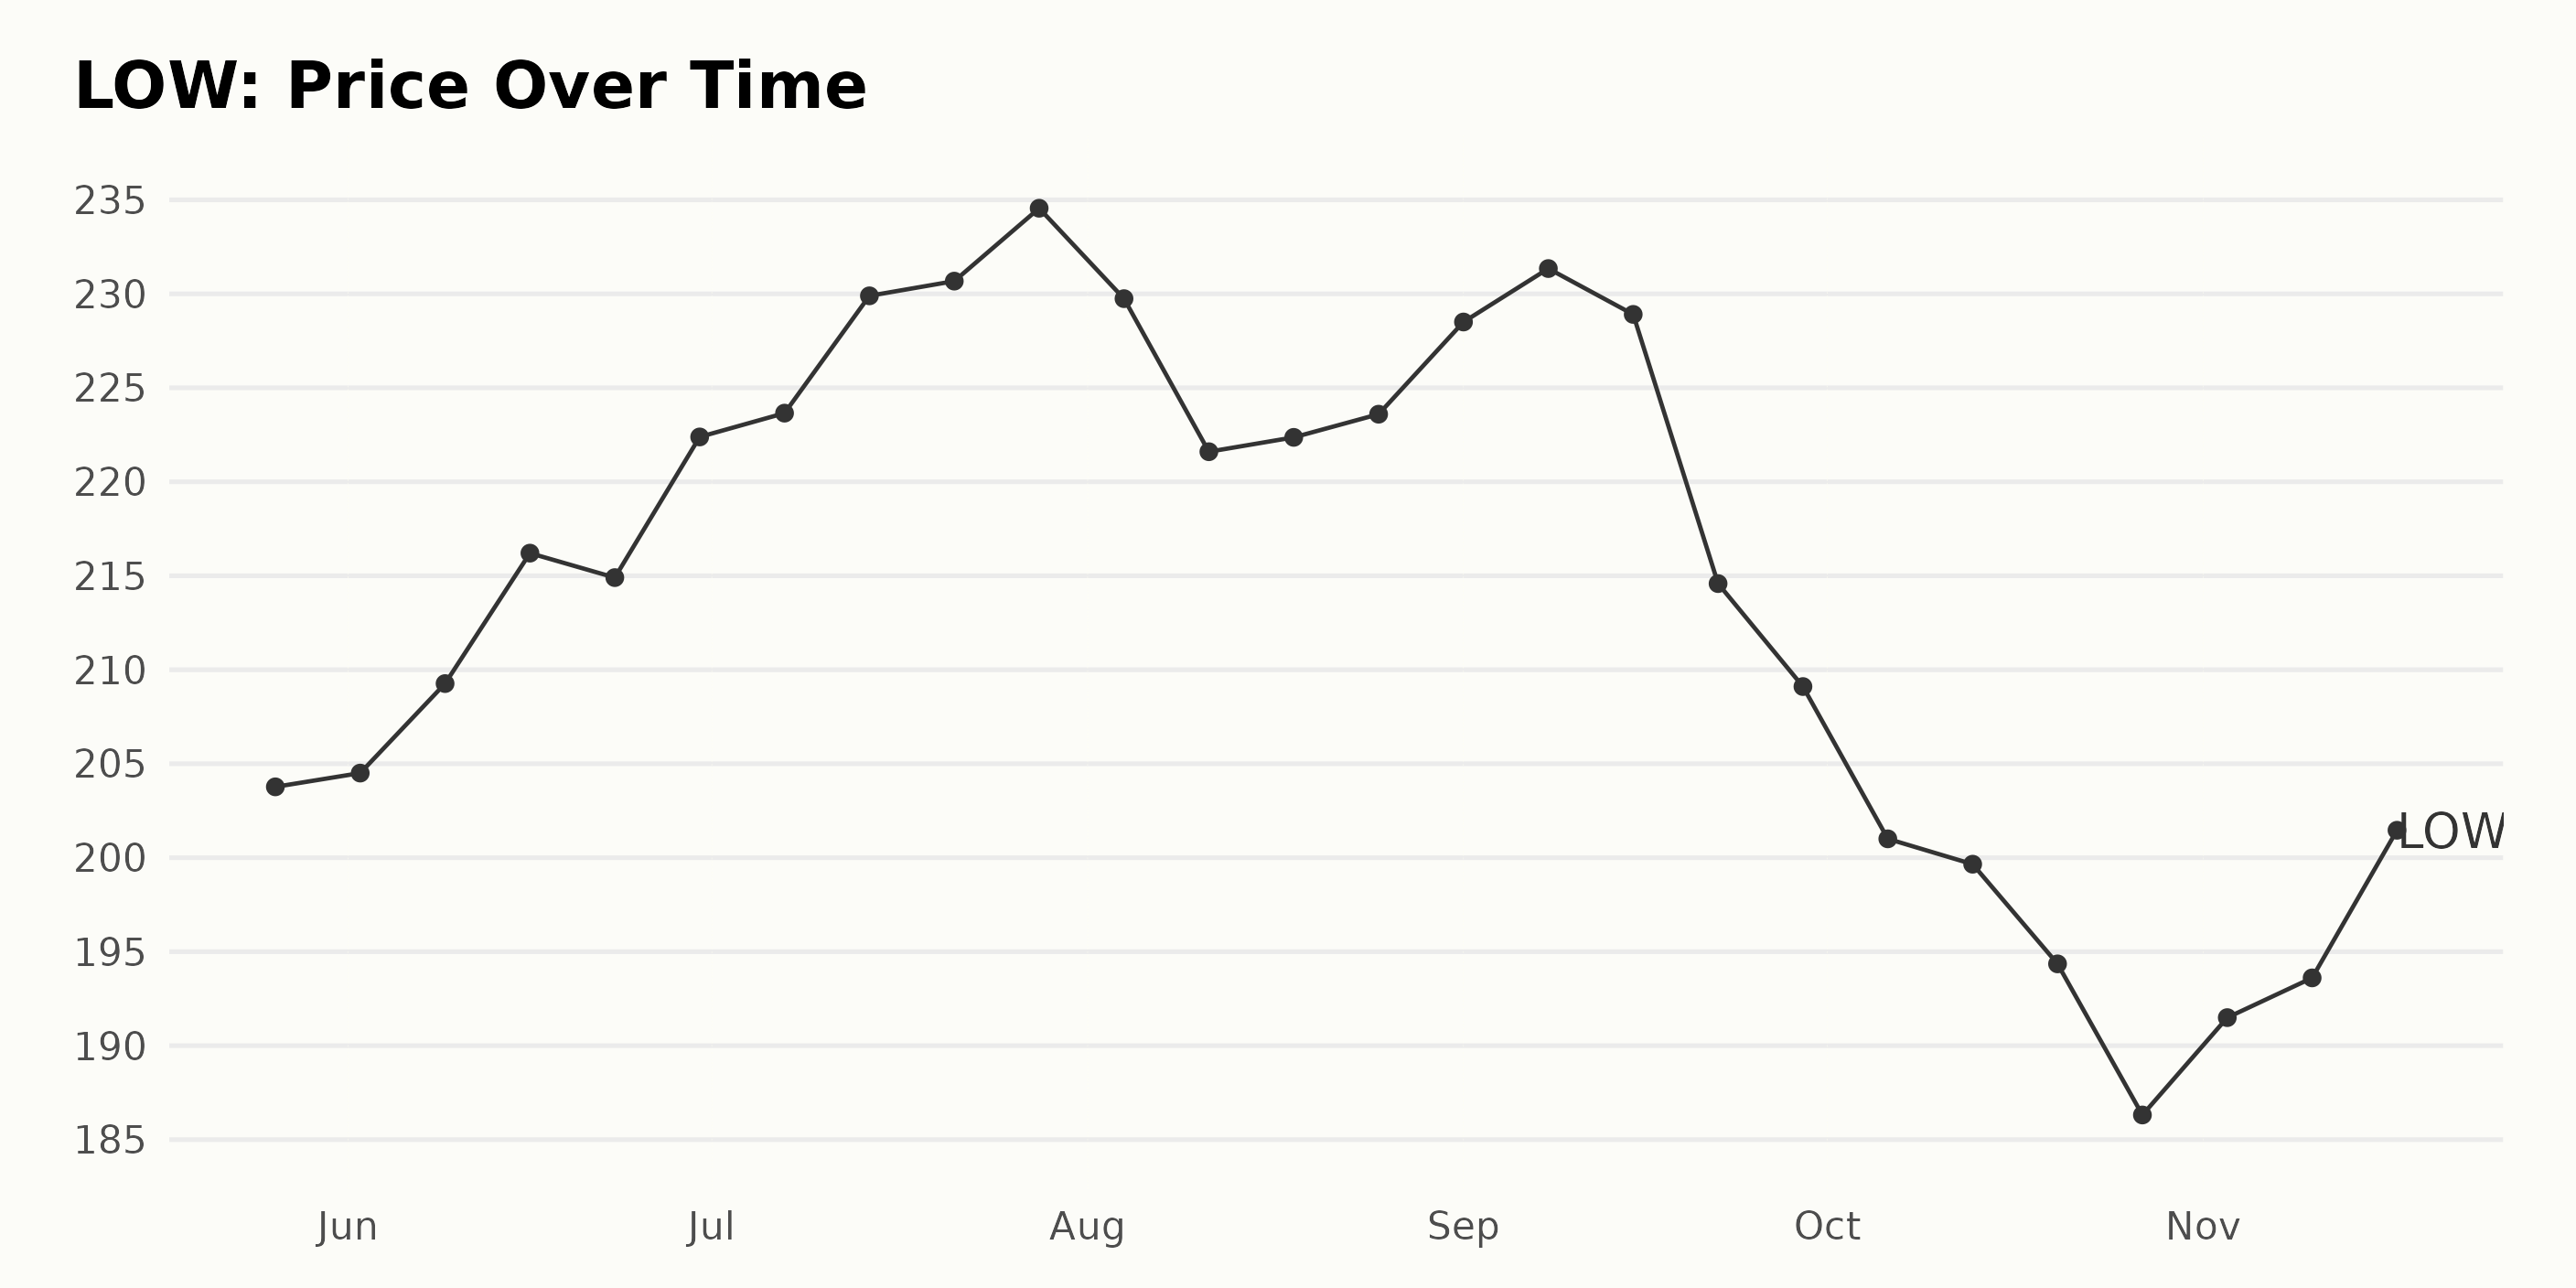
The provided data set consists of the weekly share prices of LOW from May 26, 2023, through November 17, 2023. Here are some significant points about the trend and growth rate derived from this data:
- On May 26, 2023, the price of LOW stood at $203.77.
- There was a steady increase in price throughout June and July, with the highest point recorded on July 21, 2023, at $230.676. This suggests a period of growth for LOW during these months.
- Following this peak, the prices started to fluctuate, hitting another high at $234.554 on July 28, 2023.
- In August, there was a slight decrease in the share price, with the lowest recorded at $221.6 on August 11, before going back up to $228.502 by September 1, 2023.
- A considerable drop in the share prices is observed from mid-September through October, where the shares dipped to $186.312 on October 27, 2023.
- This downward trend was reversed in early November, with the price appreciating to $203.70 by November 17, 2023.
There seems to be no clear linear trend in the given period; instead, the share prices display a pattern of peaks and troughs. The general pattern can be broken down into three periods: a period of increase (until late July), followed by price fluctuations before experiencing a significant fall (from mid-September through late October), then eventually recuperating a part of losses (in November).
The company’s share price seems somewhat volatile during this six-month tenure. It implies that those market factors might have affected the pricing during this period. Further insights and growth rate calculations could be gained from deeper statistical analysis. Here is a chart of LOW’s price over the past 180 days.
Analyzing POWR Ratings: Lowe’s Quality, Growth, and Momentum Trends
The POWR Ratings grade of LOW, a stock in the 58-stock Home Improvement & Goods category, has seen varied changes throughout 2023. It predominantly maintains a B (Buy) grade but occasionally drops to a C (Neutral).
Below are the notable values of POWR grade and rank-in-category from May 27, 2023, to November 20, 2023:
- May 27, 2023 – POWR Grade: B / Rank in Category: #15
- June 3, 2023 – POWR Grade: C / Rank in Category: #22
- August 19, 2023 – POWR Grade: C / Rank in Category: #27
- September 16, 2023 – POWR Grade: B / Rank in Category: #8 (best ranking over the period)
- November 4, 2023 – POWR Grade: C / Rank in Category: #27
- November 20, 2023 – POWR Grade: B / Rank in Category: #21
Despite certain fluctuations in its POWR grade and rank-in-category demonstrating the stock’s volatility over the period, LOW’s grade generally stays at B (Buy), denoting stable performance.
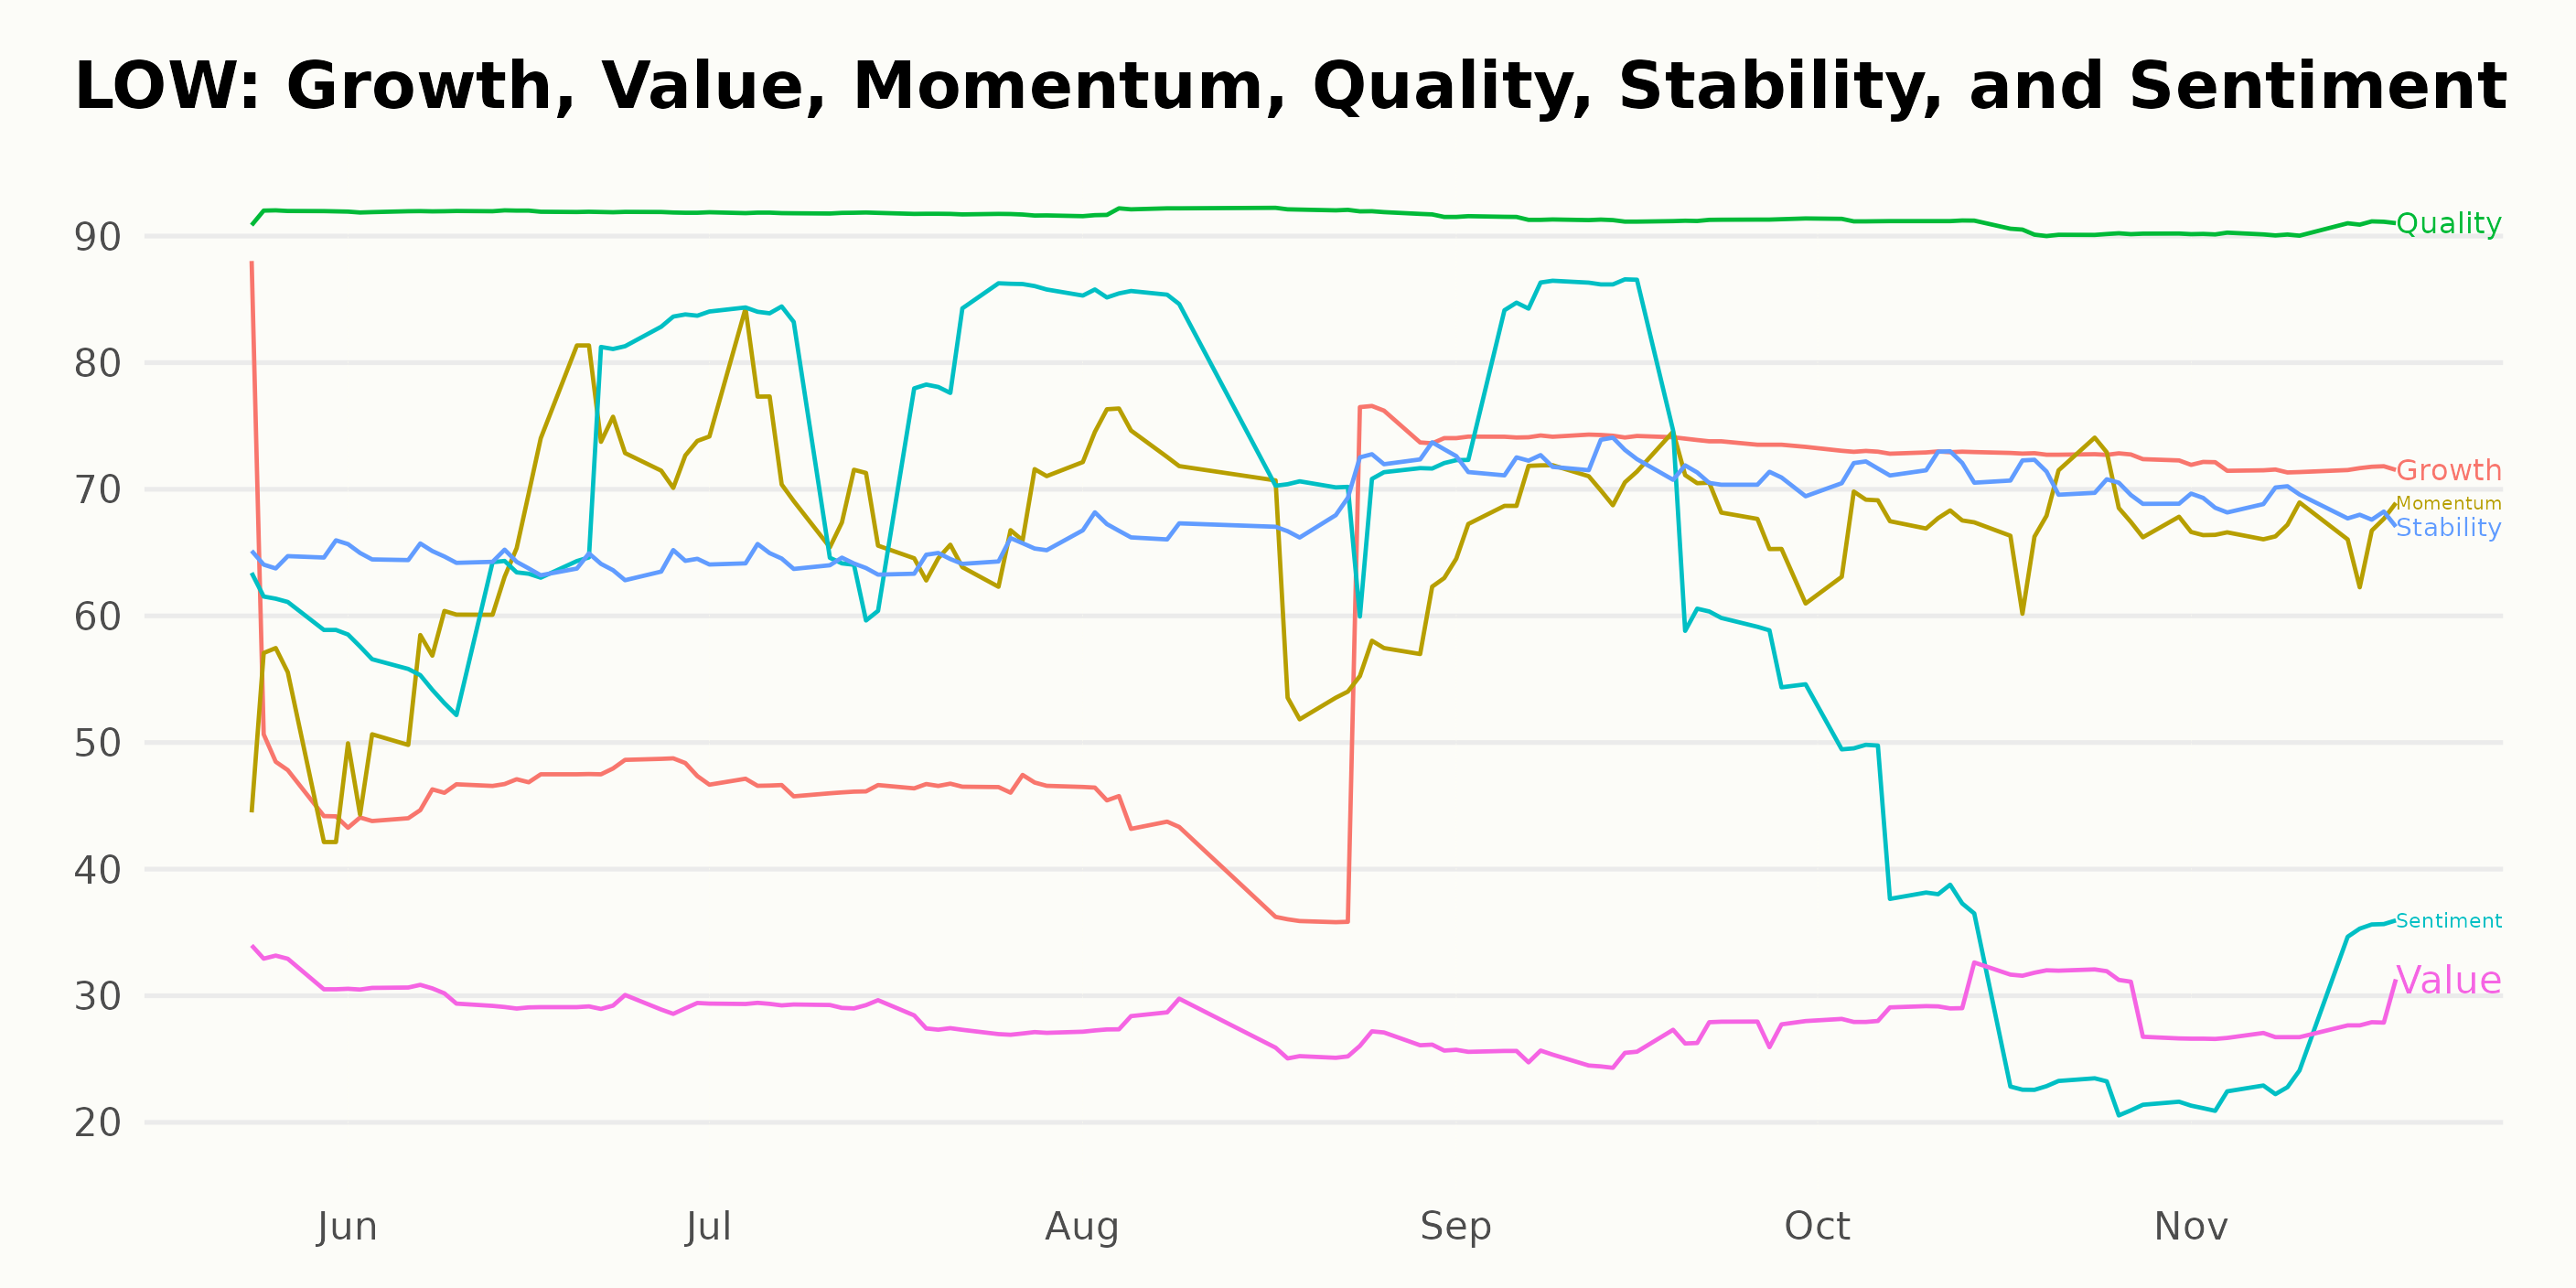
Looking at the POWR Ratings for LOW, the most noteworthy dimensions are Quality, Growth, and Momentum.
Quality: The quality dimension consistently remained the highest among other dimensions. Its value was mostly 92 throughout the months up to October 2023 and then slightly decreased to 91 in November 2023.
Growth: According to the data, a significant trend is seen in the growth dimension. It shows a notable rise from 54 in May 2023, dropping slightly to 47 in June and July 2023 but again increasing remarkably to 74 by September 2023. Even though it fell slightly in the later months, it remained higher than the initial points.
Momentum: Momentum appears to be moderately noteworthy, maintaining a fairly steady increase through the selected timeframe. Starting from 50 in May 2023, this dimension peaked at 69 by September 2023 and finally slightly reduced to 67 by November 2023.
Each of the above-mentioned three dimensions indicates different levels of improvement and stability, with Quality staying remarkably high, Growth showing strong escalation, and Momentum indicating a stable upward trend.
How does Lowe’s Companies, Inc. (LOW) Stack Up Against its Peers?
Other stocks in the Home Improvement & Goods sector that may be worth considering are Alarm.com Holdings, Inc. (ALRM), Hamilton Beach Brands Holding Company (HBB), and Lifetime Brands, Inc. (LCUT) – they have better POWR Ratings. Click here to explore more Home Improvement & Goods stocks.
What To Do Next?
43 year investment veteran, Steve Reitmeister, has just released his 2024 market outlook along with trading plan and top 11 picks for the year ahead.
Want More Great Investing Ideas?
LOW shares rose $0.85 (+0.42%) in premarket trading Monday. Year-to-date, LOW has gained 4.38%, versus a 19.18% rise in the benchmark S&P 500 index during the same period.
About the Author: Anushka Dutta

Anushka is an analyst whose interest in understanding the impact of broader economic changes on financial markets motivated her to pursue a career in investment research. More...
More Resources for the Stocks in this Article
| Ticker | POWR Rating | Industry Rank | Rank in Industry |
| LOW | Get Rating | Get Rating | Get Rating |
| ALRM | Get Rating | Get Rating | Get Rating |
| HBB | Get Rating | Get Rating | Get Rating |
| LCUT | Get Rating | Get Rating | Get Rating |


