
Leading fintech firm PayPal Holdings, Inc. (PYPL) has experienced considerable growth during the pandemic as consumers increasingly relied on online transactions. However, the stock’s momentum began to wane with the easing of pandemic restrictions. Challenges such as a slowdown in e-commerce spending and heightened competition in the digital-payment sector are now facing the company.
Despite these temporary setbacks, the current situation presents an attractive opportunity to acquire PYPL shares at a discounted price. While the company navigates changing consumer preferences, it appears well-positioned for long-term growth.
As of the first quarter of 2023, PYPL boasted a 42% market share and an impressive 433 million active users, reaffirming its position as one of the largest online payment processors.
Furthermore, as of May 2023, over 17.3 million websites worldwide had used PayPal. Also, PayPal is accepted by 79% of the largest retailers in North America and Europe. A study also found PayPal to be the preferred payment method among 42% of consumers surveyed across seven markets.
PayPal’s extensive market reach and solid financial standing are expected to foster growth in the face of rising competition. Additionally, the company is committed to continuous evolution through diversifying services and revenue streams.
Furthermore, considering the rising adoption of digital payment methods and the fintech industry’s promising outlook, PYPL could be considered an excellent investment choice. The global fintech market is projected to reach $556.58 billion by 2030, growing at a CAGR of 19.5%.
Let’s take a look at some key metrics that further support my bullish stance on PayPal’s prospects.
PayPal’s Financial Performance: Analyzing Net Income, Revenue, and PE Ratio
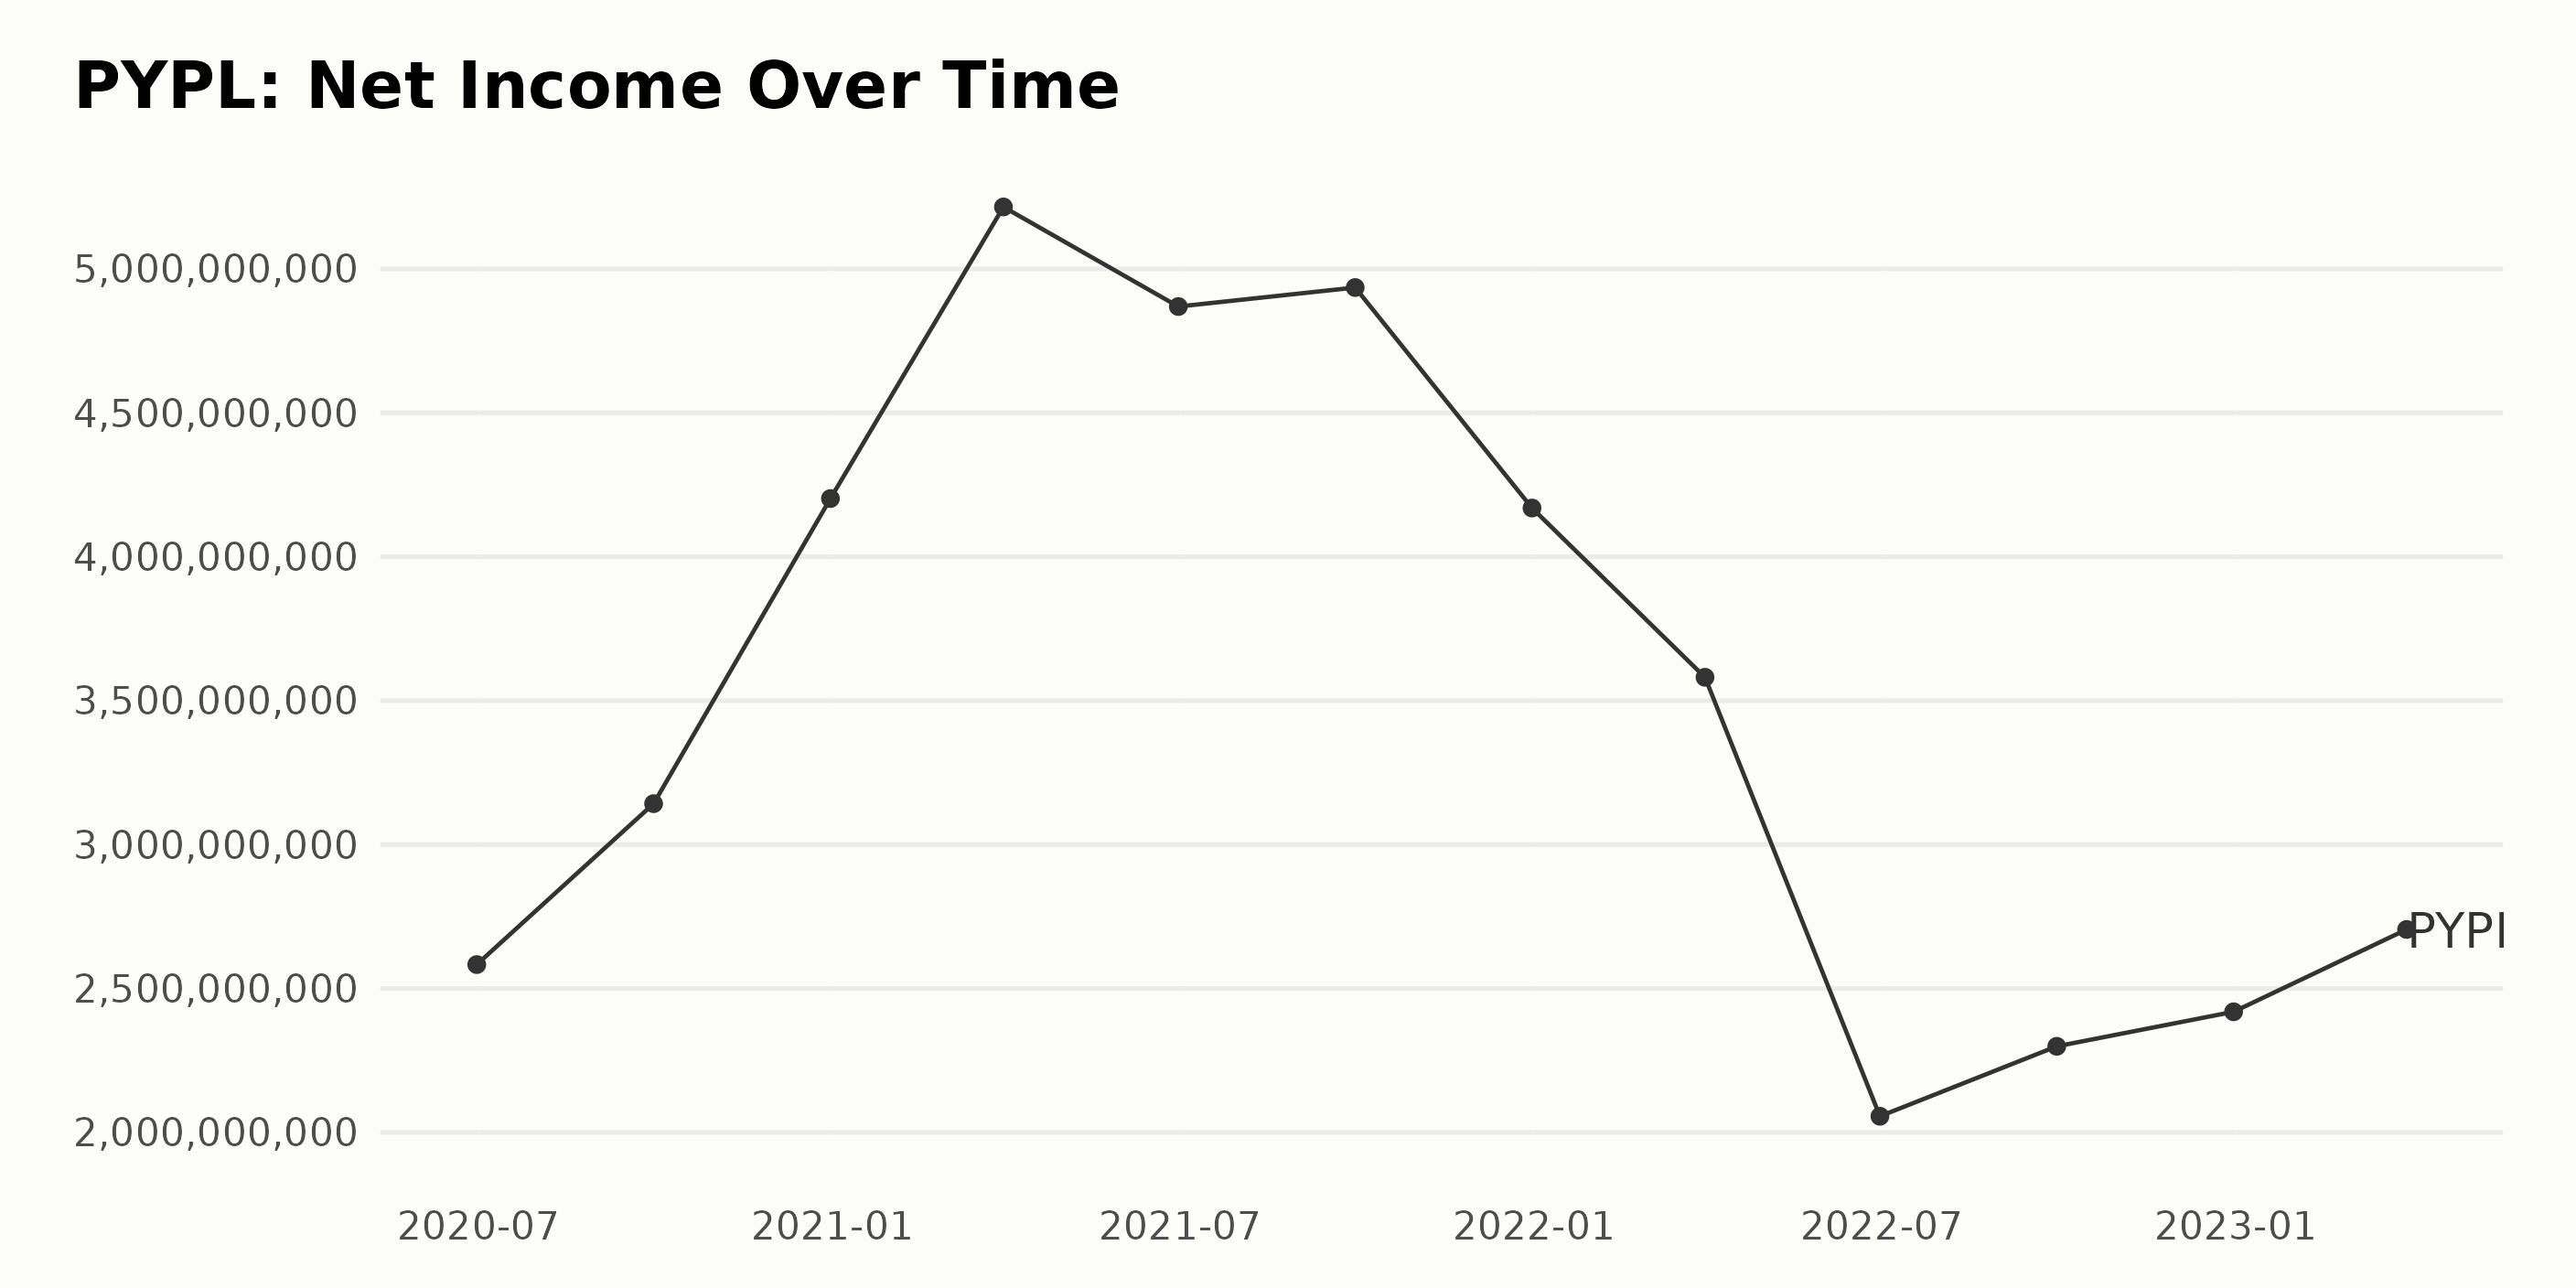
The trend and fluctuations of the trailing-12-month net income for PYPL from June 2020 to March 2023 can be summarized as follows:
- June 2020: $2.58 billion
- September 2020: $3.14 billion
- December 2020: $4.20 billion
- March 2021: $5.21 billion
- June 2021: $4.86 billion
- September 2021: $4.93 billion
- December 2021: $4.16 billion
- March 2022: $3.58 billion
- June 2022: $2.05 billion
- September 2022: $2.29 billion
- December 2022: $2.41 billion
- March 2023: $2.70 billion
PYPL experienced a generally upward trend in net income from June 2020 to March 2021, increasing from $2.58 billion to a peak of $5.21 billion. However, the company has experienced fluctuations since then, with a noticeable decline in its net income since June 2021, reaching a low point of $2.05 billion in June 2022. Despite multiple fluctuations, the overall growth rate from June 2020 to March 2023 is approximately 4.6%.
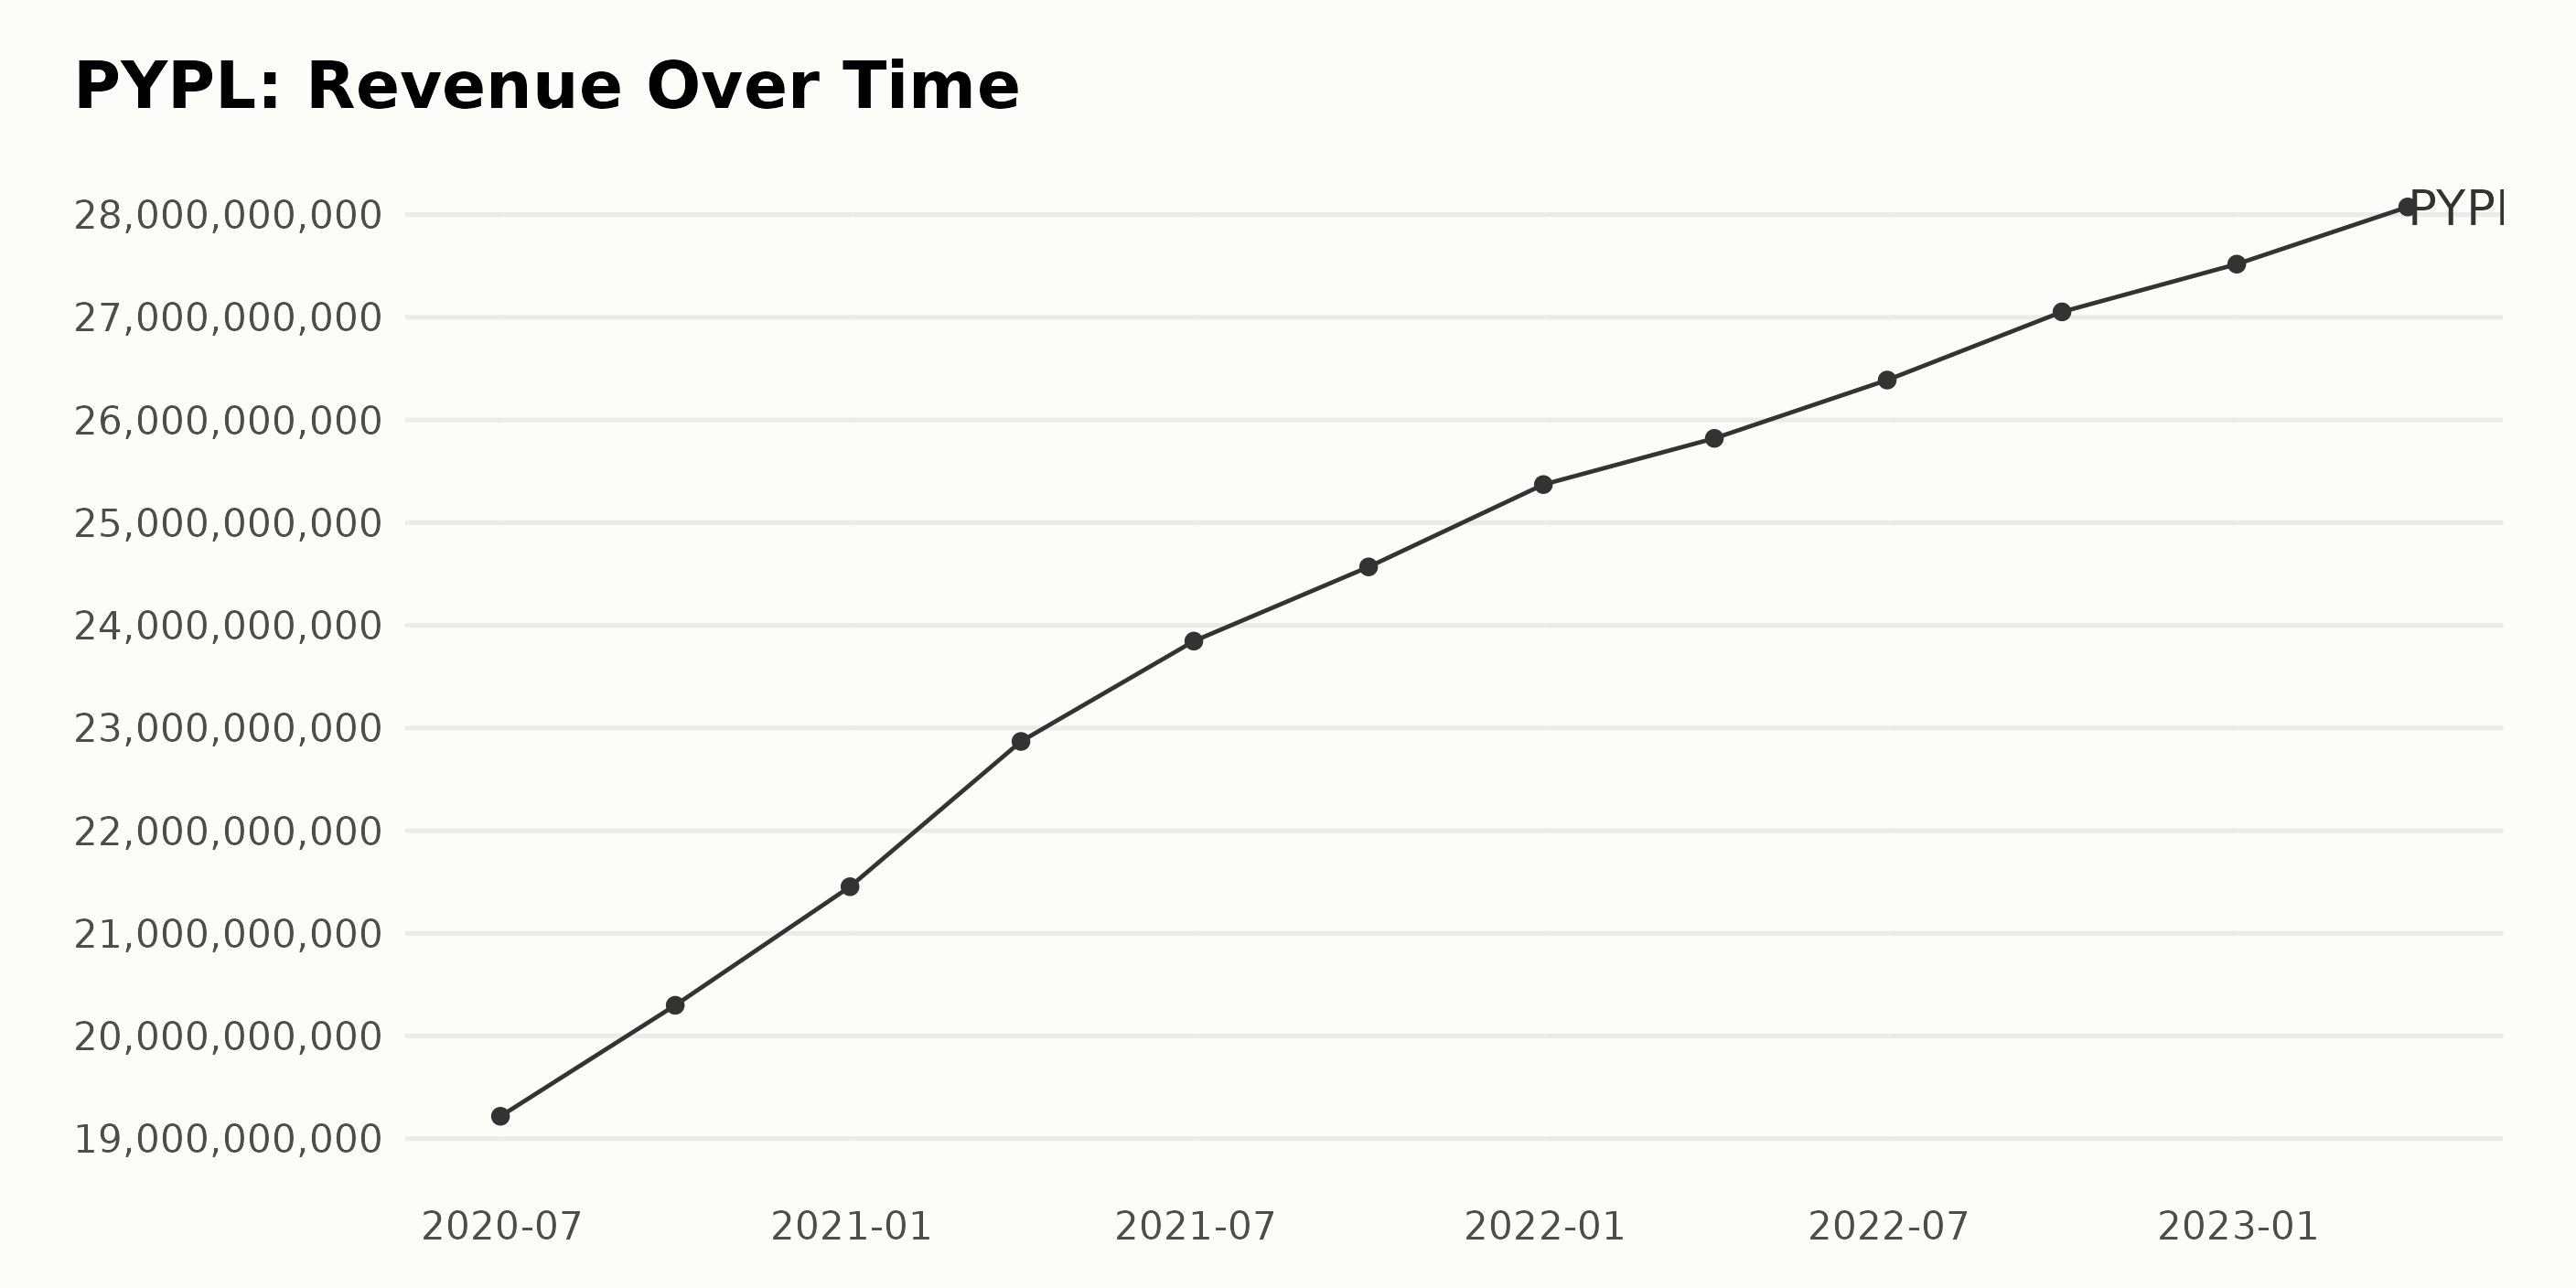
The trailing-12-month revenue trend for PYPL shows steady growth from June 2020 to March 2023. Here is the summary of the fluctuations in PYPL’s revenue:
- June 30, 2020: $19.22 billion
- September 30, 2020: $20.30 billion
- December 31, 2020: $21.45 billion
- March 31, 2021: $22.87 billion
- June 30, 2021: $23.85 billion
- September 30, 2021: $24.57 billion
- December 31, 2021: $25.37 billion
- March 31, 2022: $25.82 billion
- June 30, 2022: $26.39 billion
- September 30, 2022: $27.05 billion
- December 31, 2022: $27.52 billion
- March 31, 2023: $28.08 billion
The most recent data shows that as of March 31, 2023, the revenue was $28.08 billion. Comparing this to the first value of $19.22 billion on June 30, 2020, PYPL experienced a growth of approximately 46.12% in its revenue from June 2020 to March 2023.
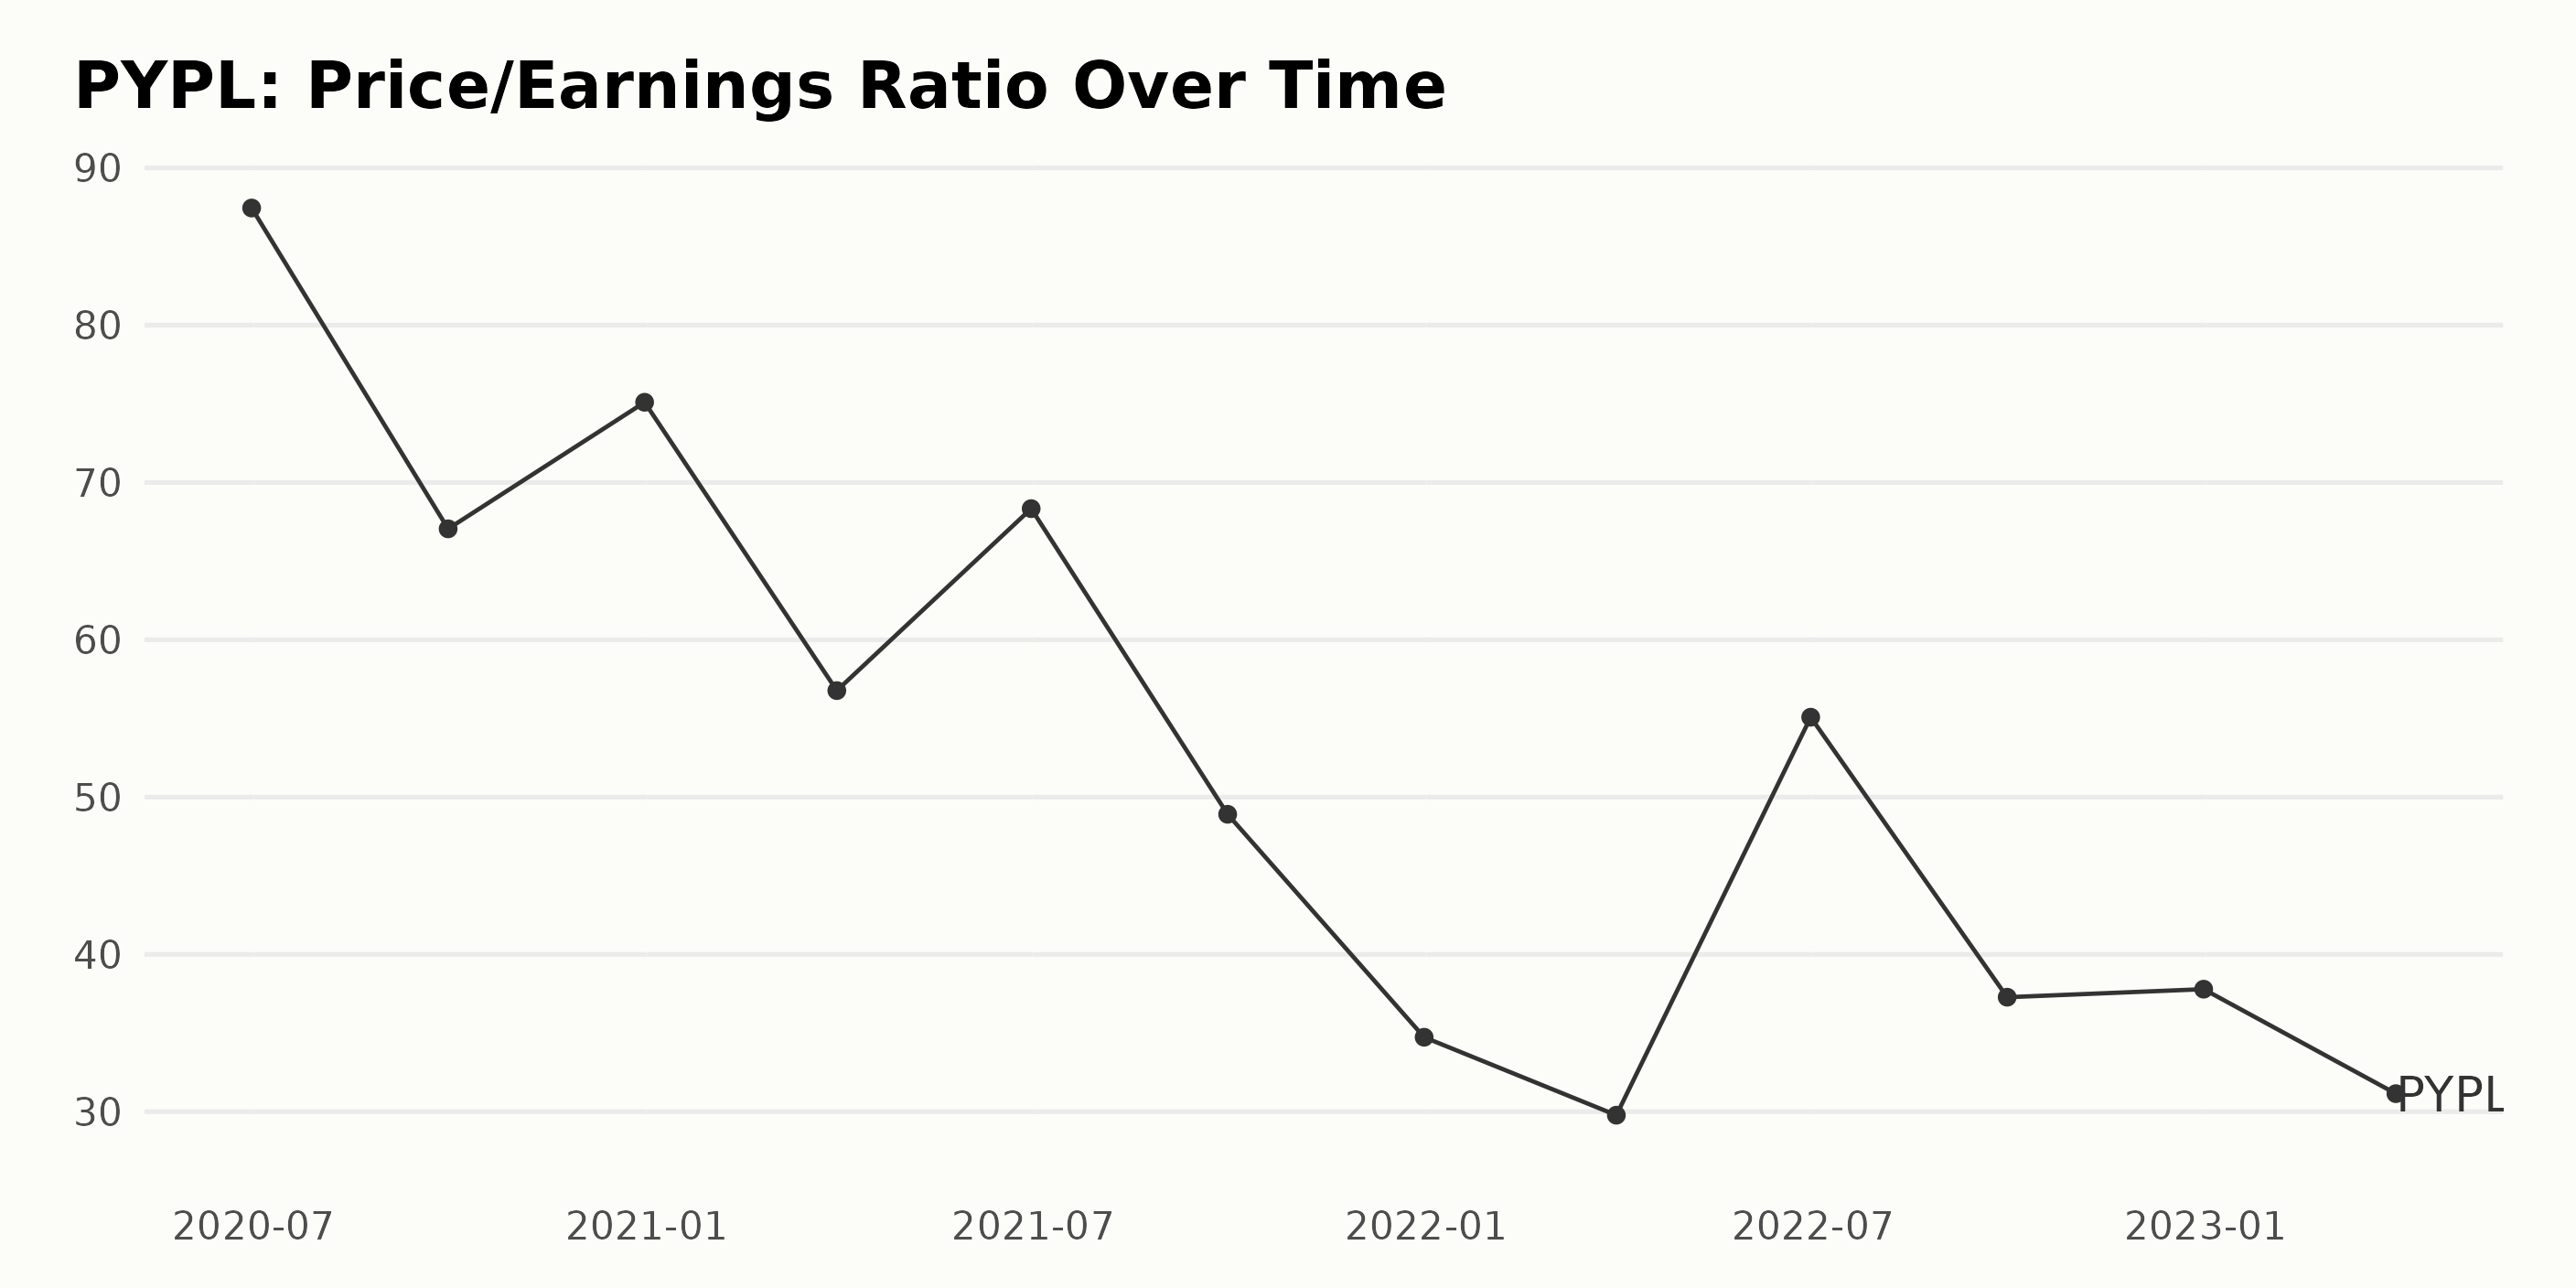
The Price/Earnings Ratio of PYPL showed fluctuations from June 2020 to March 2023, with an overall downward trend. Here is a summary of the key data points:
In June 2020, P/E was at its highest at 87.45. The P/E value generally decreased over time, with some fluctuations:
- September 2020: 67.05
- December 2020: 75.10
- March 2021: 56.77
- June 2021: 68.34
- September 2021: 48.91
- December 2021: 34.74
- March 2022: 29.78 (lowest value in the series)
From April 2022 to March 2023, the P/E values showed a slight recovery with fluctuations:
- June 2022: 55.08
- September 2022: 37.28
- December 2022: 37.79
- March 2023: 31.15 (last value)
The growth rate from June 2020 to March 2023 of -64.4% demonstrates a significant decrease in the P/E value for PYPL over the period observed. In conclusion, PYPL’s Price/Earnings Ratio has experienced notable fluctuations over time, with an overall downward trend.
Analyzing PYPL’s Share Price Trends: Growth, Decline, and Recovery (December 2022-June 2023)
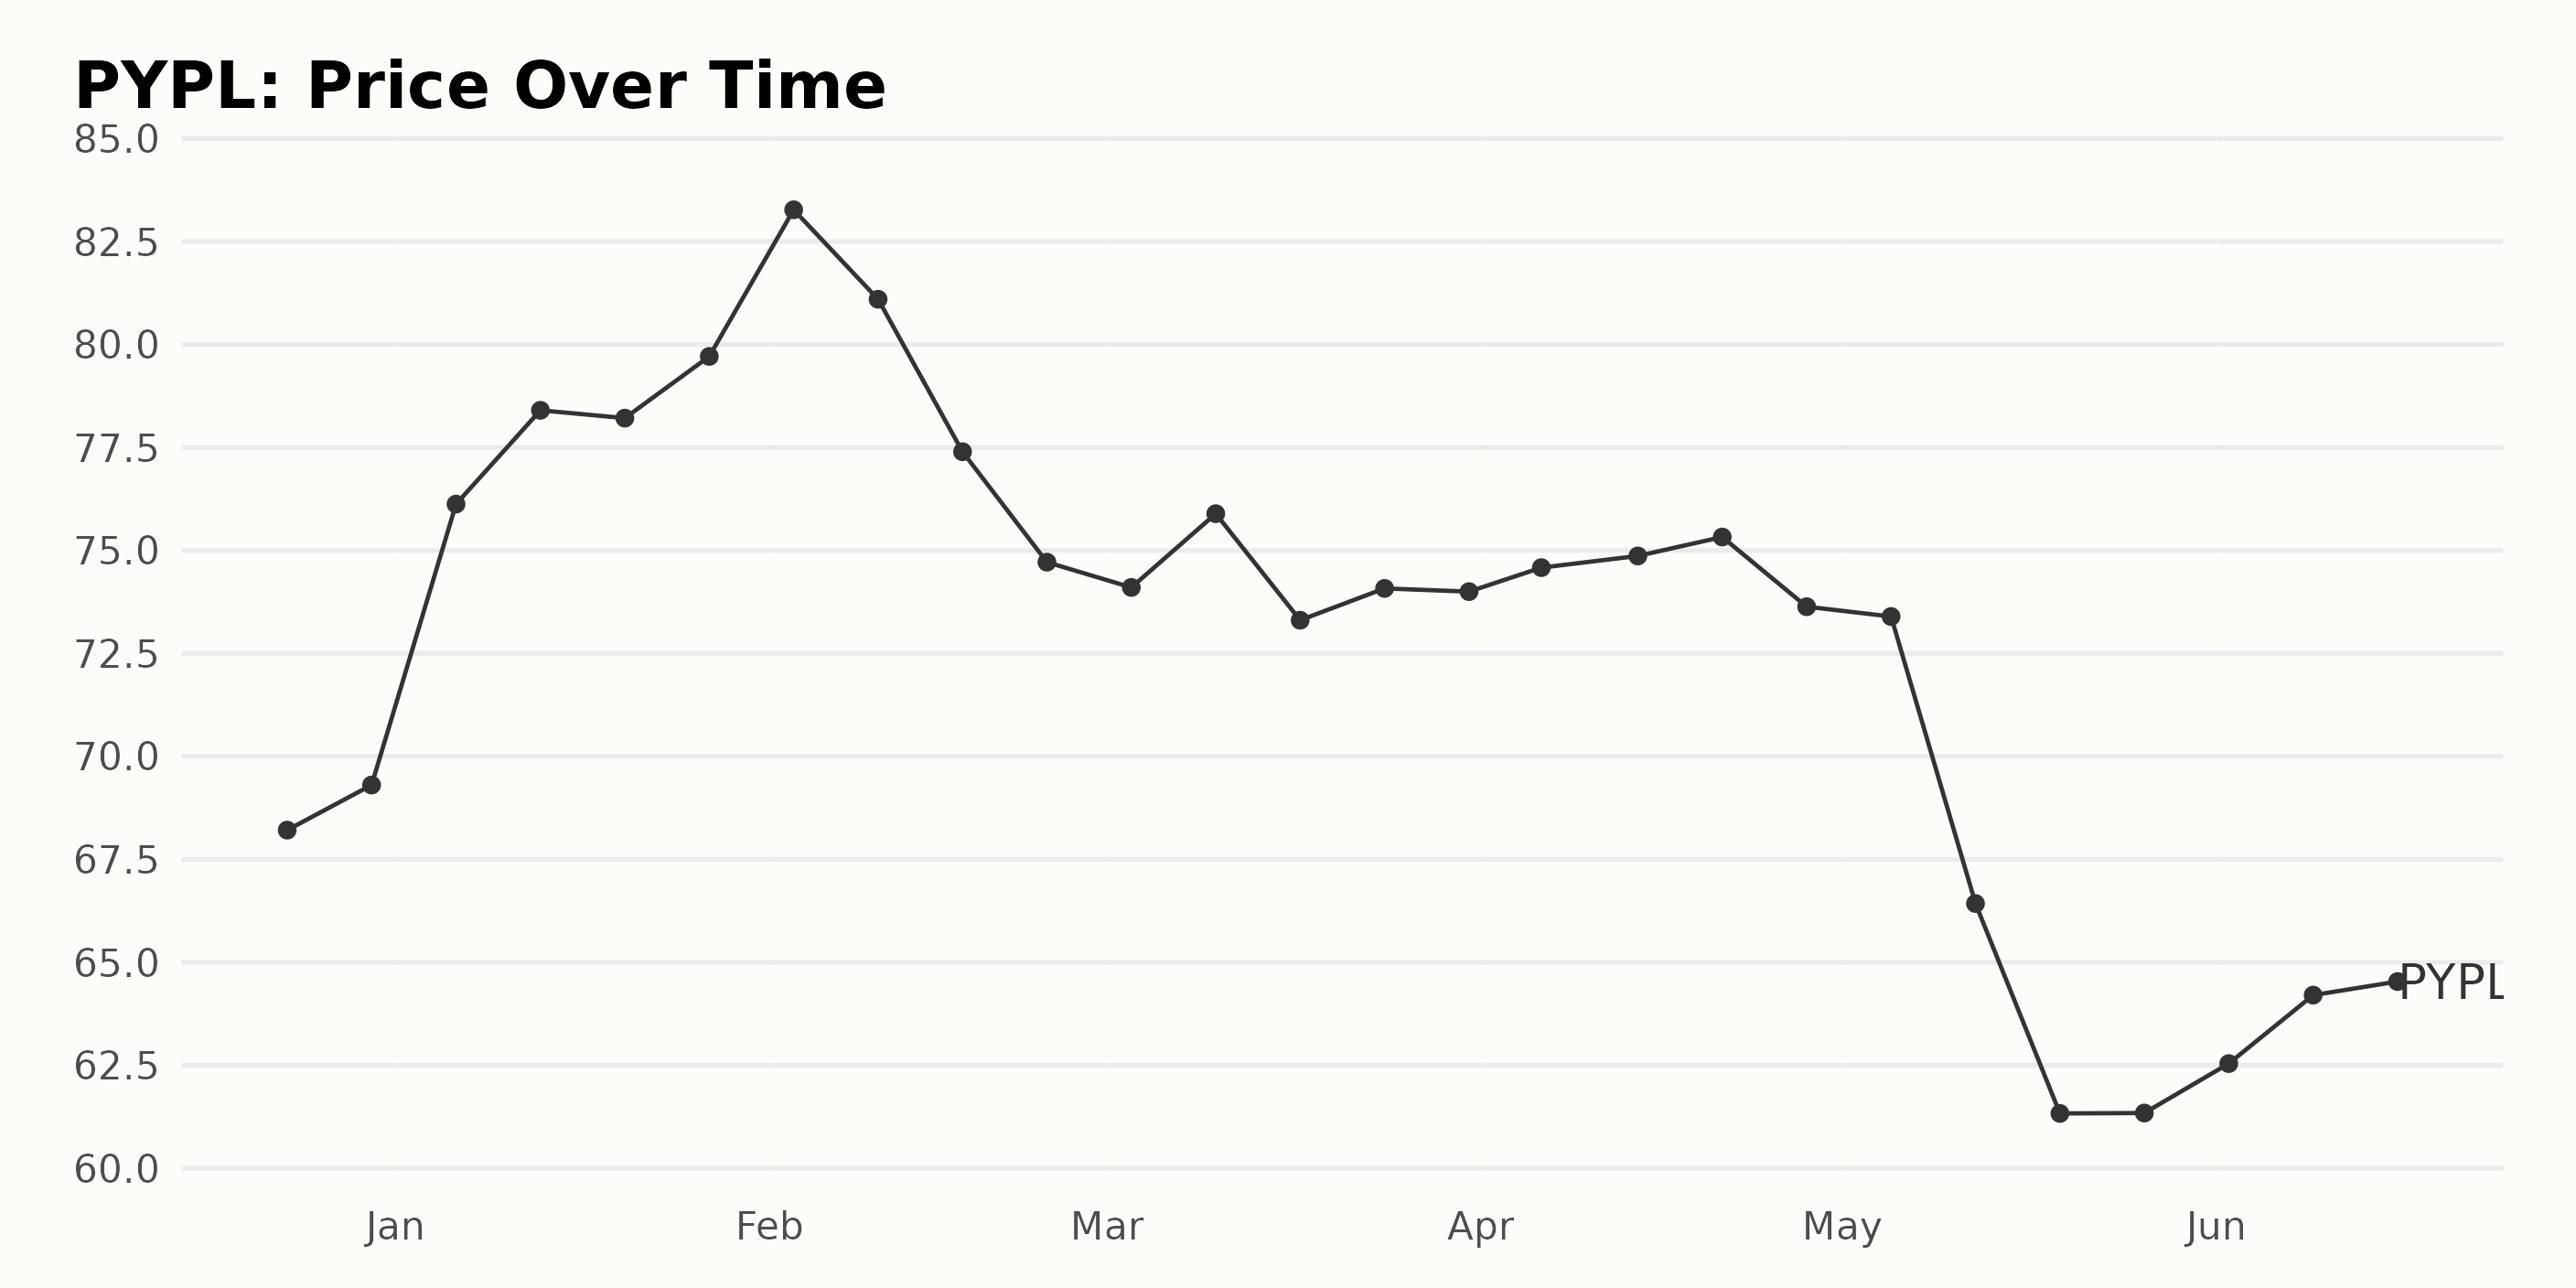
Upon examination of the data, some trends are noted. The general trend comprises of few phases, as listed below:
Steady increase (December 2022 – February 2023): PYPL’s share price experienced consistent growth, moving from $68.21 on December 23, 2022, to $83.27 on February 3, 2023. This represents a significant upward trend.
Decelerating decrease (February 2023 – March 2023): Following the uptrend, there was a decelerating decline in the share price. It dropped from $81.10 on February 10, 2023, down to $73.31 on March 17, 2023, and eventually stabilized near $74 through the end of the month.
Variability and decrease (April 2023 – May 2023): The share price remained relatively stable throughout April, with minor fluctuations around the $75 mark. However, starting in early May, the price started to decrease at an accelerated rate, reaching its lowest value of $61.33 on May 19, 2023.
Recovery (May 2023 – June 2023): From the end of May, the share price began to recover steadily, climbing back to $64.53 by June 16, 2023. PYPL’s share price steadily increased, followed by periods of decline, stabilization, and eventual recovery. The associated growth rates during these periods ranged from consistent increases to decelerating and accelerating decreases, finally settling in a moderate upward trend during recovery. Here is a chart of PYPL’s price over the past 180 days.
PayPal’s Growth, Momentum, and Sentiment: Significant POWR Trends in 2023
PYPL has an overall B rating, translating to a Buy in our POWR Ratings system. Based on the given data, PYPL’s POWR Ratings have shown improvement over time in the Consumer Financial Services category of stocks, which comprises 47 stocks in total, and PYPL is ranked #13. Here is a summary of the changes over time:
- December 24, 2022: POWR Ratings – C, Rank in Category – 20
- January 7, 2023: POWR Ratings – C, Rank in Category – 22
- January 14, 2023: POWR Ratings – C, Rank in Category – 19
- February 4, 2023: POWR Ratings – C, Rank in Category – 20
- February 18, 2023: POWR Ratings – C, Rank in Category – 18
- March 18, 2023: POWR Ratings – C, Rank in Category – 23
- April 1, 2023: POWR Ratings – C, Rank in Category – 23
- April 22, 2023: POWR Ratings – C, Rank in Category – 15
- May 6, 2023: POWR Ratings – C, Rank in Category – 13
- May 13, 2023: POWR Ratings – B, Rank in Category – 6
- May 27, 2023: POWR Ratings – B, Rank in Category – 9
- June 3, 2023: POWR Ratings – B, Rank in Category – 10
- June 17, 2023: POWR Ratings – B, Rank in Category – 13
PYPL’s rank in the category improved significantly from May 13, 2023, moving from 13 to 6, with the rating improving from “C” to “B.” However, in the following weeks, the rank in the category dropped slightly but maintained a “B” rating.
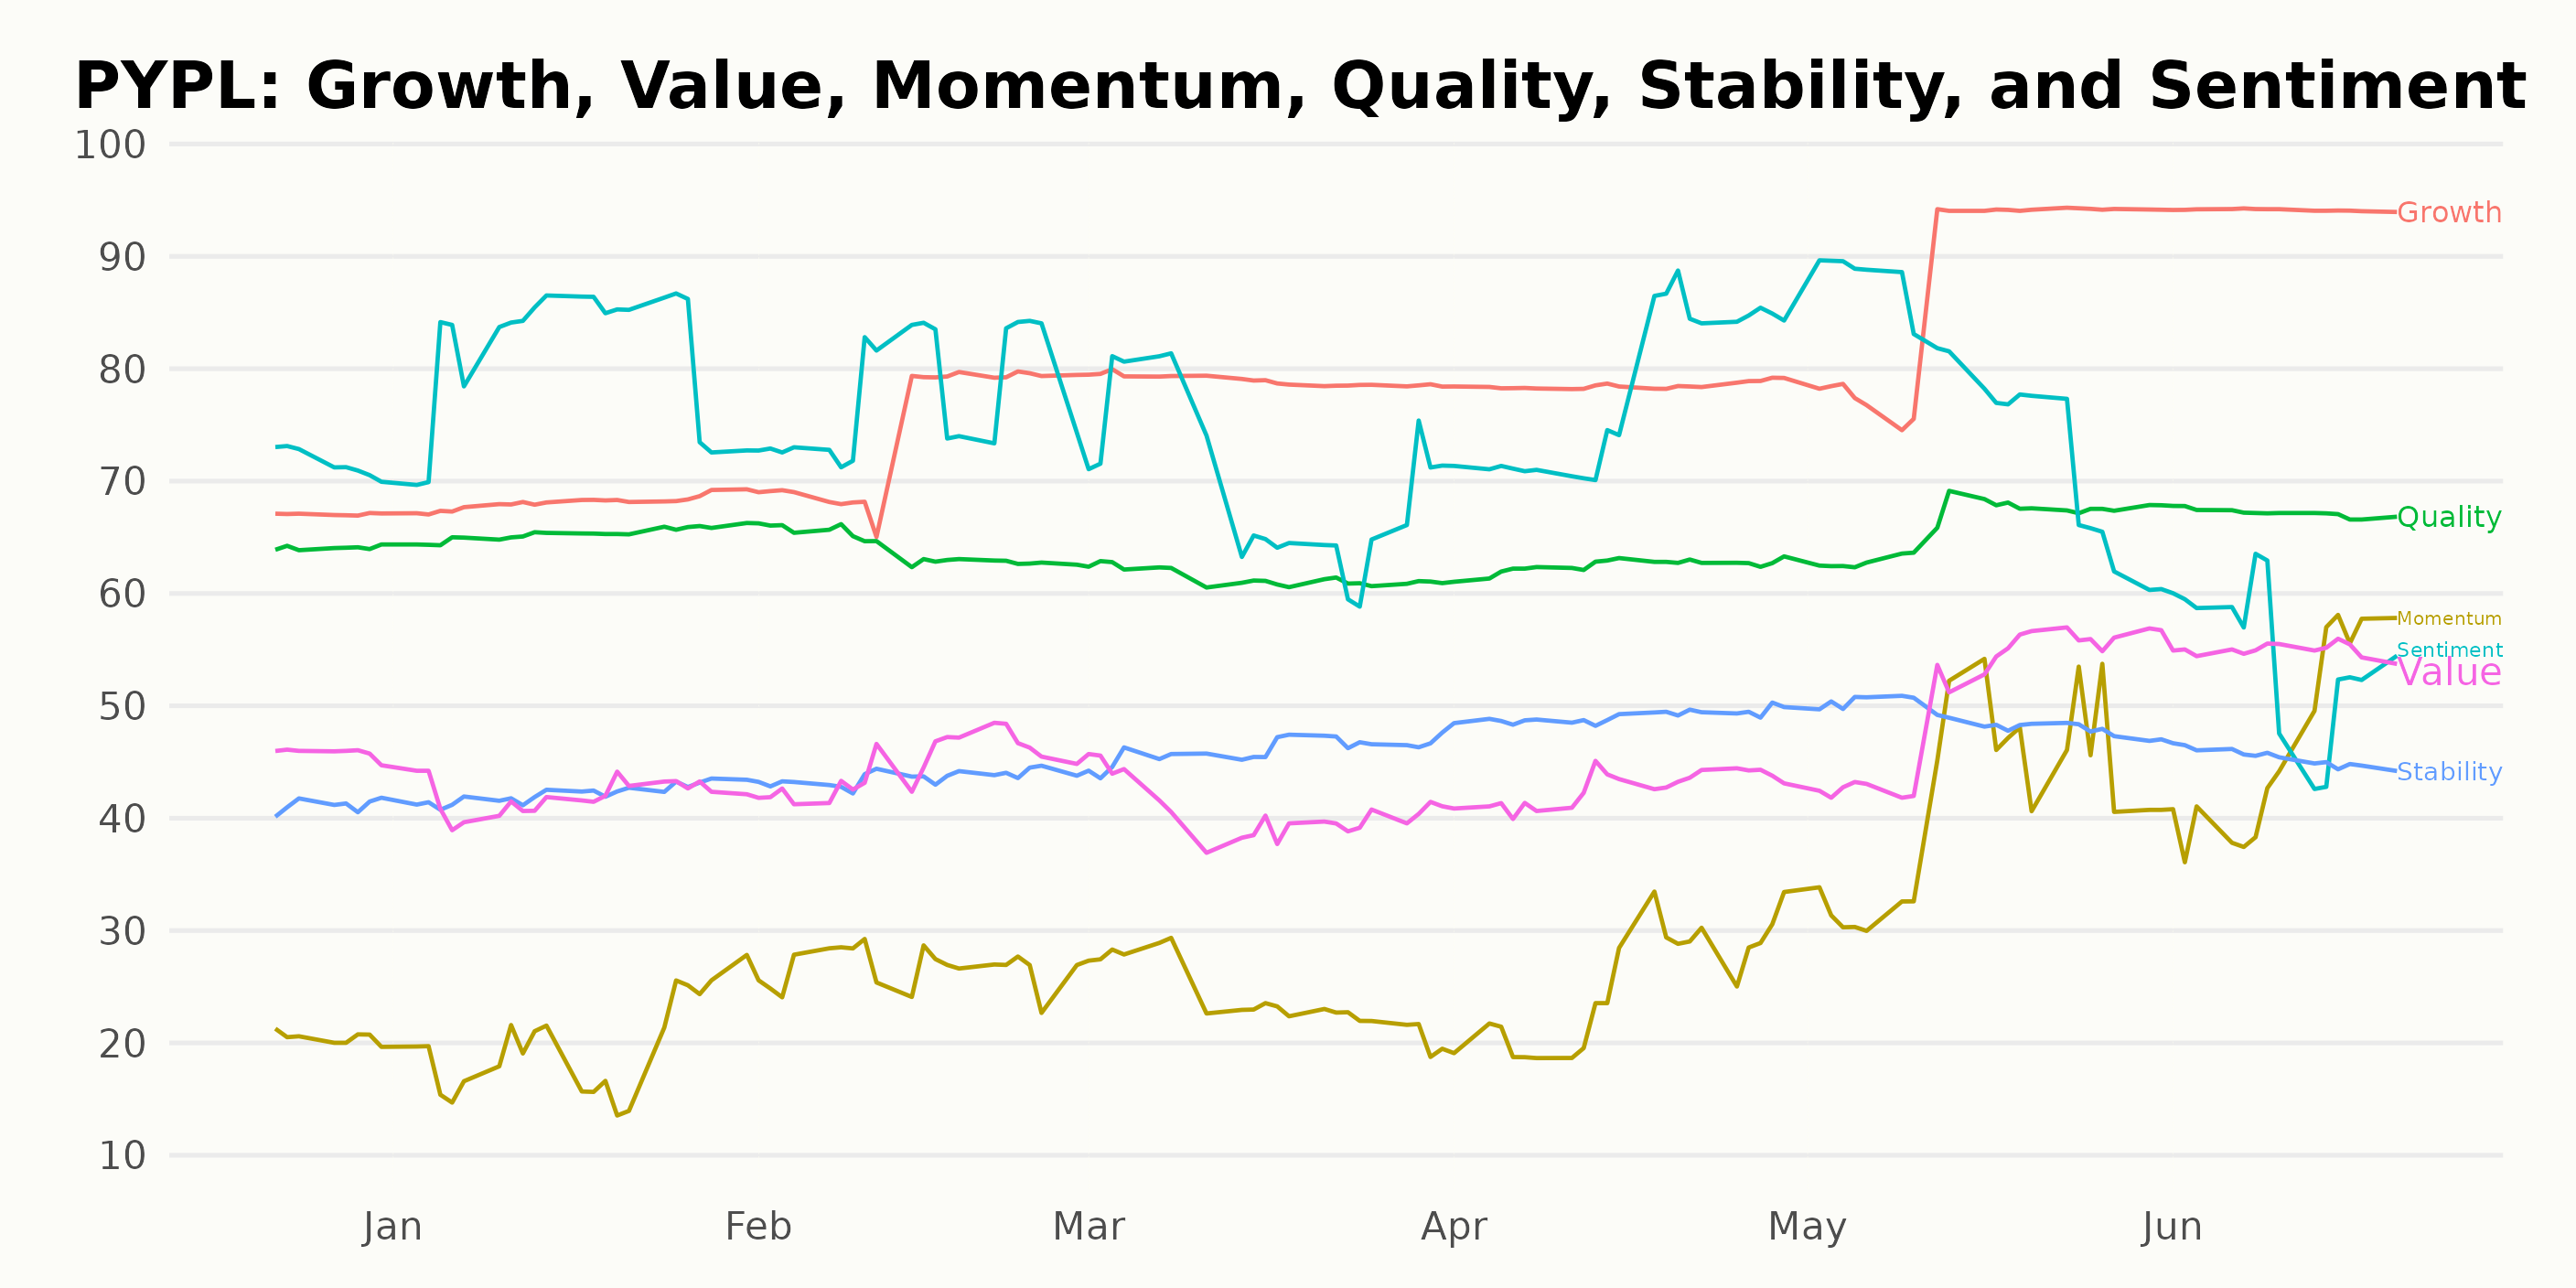
PYPL had some noteworthy trends in the POWR Ratings across three dimensions in 2023. The most significant dimensions to highlight are Growth, Momentum, and Sentiment.
- Growth: PayPal experienced a consistent increase in its growth rating throughout the year. It started with a score of 68 in January and reached a high of 94 by June 17. This demonstrates a strong upward trend in the company’s growth performance.
- Momentum: The momentum rating also followed an upward trend in 2023, indicating positive performance over time. Its score started at 20 in January and rose to 46 by June 17, reflecting improved market confidence in the stock’s performance.
- Sentiment: This dimension fluctuated but maintained a generally high rating during 2023. The sentiment score started at 82 in January, dipped to 69 in March, but recovered to 78 in April before settling at 55 by June 17. These ratings depict considerable analyst and investor optimism surrounding PYPL throughout the year.
In summary, Growth, Momentum, and Sentiment were the three most noteworthy dimensions for PYPL in 2023, with evident upward trends in Growth and Momentum ratings, while Sentiment remained consistently high with some fluctuations.
How does PayPal Holdings Inc. (PYPL) Stack Up Against its Peers?
Other stocks in the Consumer Financial Services sector that may be worth considering are Regional Management Corp. (RM), EZCORP Inc. (EZPW), and Visa Inc. (V). These stocks are rated A (Strong Buy) or B (Buy).
What To Do Next?
Get your hands on this special report with 3 low priced companies with tremendous upside potential even in today’s volatile markets:
3 Stocks to DOUBLE This Year >
Want More Great Investing Ideas?
PYPL shares were trading at $69.00 per share on Tuesday afternoon, up $2.57 (+3.87%). Year-to-date, PYPL has declined -3.12%, versus a 14.98% rise in the benchmark S&P 500 index during the same period.
About the Author: Subhasree Kar

Subhasree’s keen interest in financial instruments led her to pursue a career as an investment analyst. After earning a Master’s degree in Economics, she gained knowledge of equity research and portfolio management at Finlatics. More...
More Resources for the Stocks in this Article
| Ticker | POWR Rating | Industry Rank | Rank in Industry |
| PYPL | Get Rating | Get Rating | Get Rating |
| RM | Get Rating | Get Rating | Get Rating |
| EZPW | Get Rating | Get Rating | Get Rating |
| V | Get Rating | Get Rating | Get Rating |