
Leading specialty coffee retailer Starbucks Corporation (SBUX) is bringing in autumn with the highly-anticipated return of the Pumpkin Spice Latte and a variety of other fall-inspired menu items. The company’s primary target demographic comprises youthful consumers within the United States.
Moving forward, SBUX anticipates sustained strong demand from China, following a remarkable 46% upturn in comparable sales within that market during the third quarter. Furthermore, SBUX recently declared an elevation in its quarterly dividend from $0.53 to $0.57 per share, payable to shareholders on November 24, 2023.
This announcement escalated the annual dividend rate of Starbucks to $2.28 per share, resulting in a yield of 2.46% based on the current prices. Over the past three years, SBUX’s dividend payouts have amplified steadily, with an 8.9% CAGR and an even more impressive growth rate of 11% CAGR over the last five years.
With these factors in consideration, this article will delve into the key financial indicators of SBUX in a bid to comprehend why the company presents an offering worth investing in at present.
Analyzing Starbucks Corporation’s Financial Growth and Fluctuations From 2020 to 2023
The trailing-12-month net income trend for SBUX from September 27, 2020, to July 2, 2023, reveals a general growth in earnings, with some fluctuations.
- On September 27, 2020, the net income stood at $928 million.
- In the following quarter, on December 27, 2020, it decreased to $664.8 million.
- A rebound was noticeable by March 28, 2021, as it increased to $995.8 million.
- By June 27, 2021, SBUX’s net income made a substantial leap to $2.83 billion.
- Dramatic growth continued into October 3, 2021, where net income peaked at $4.2 billion.
Looking at more recent data:
- From October 3, 2021, to January 2, 2022, there was a slight increase in the corporation’s net income from $4.2 billion to $4.39 billion.
- This upward trajectory was sustained through April 3, 2022, when the net income reached its highest point at $4.41 billion.
- A minor drop was seen on July 3, 2022, with the net income declining to $4.17 billion.
- The decline continued into October 2, 2022, stepping back significantly to $3.28 billion.
- Minor recovery started on January 1, 2023, as it increased again to $3.32 billion.
- Recent data shows moderate progress throughout early 2023, reaching $3.78 billion on July 2, 2023.
Overall, the trend shows that SBUX’s net income grew by approximately 307% from the original $928 million in September 2020 to the last data point of $3.78 billion in July 2023, with some significant incremental increases and minor reductions along the way.

The Price/Earnings ratio (P/E) of SBUX demonstrated prominent fluctuations from September 2020 to July 2023.
- Starting at a P/E of 118.26 in September 2020, the value spiked to a high of 185.40 by December 2020.
- A significant drop was witnessed in the next quarter as the P/E fell sharply to 137.44 in March 2021.
- This downward trend continued drastically for the rest of 2021 and into 2022, hitting a low of 19.34 in April 2022.
- Notably, this was followed by an upward trajectory, with the P/E moderately increasing to 23.05 in July 2022 and peaking at 37.78 in January 2023.
- However, there was another decrease in the P/E in the following months, and it leveled at 30.66 in July 2023.
Upon comparing the first and last values, there has been a marked negative growth rate in the period observed. The P/E dropped from 118.26 in September 2020 to 30.66 in July 2023. The emphasis on recent data and the final value suggests a volatile history but a more stable outlook for SBUX’s P/E in the near future.

The reported trailing-12-month revenue of SBUX shows an overall positive trend from September 2020 to July 2023, despite some fluctuations. Here are the notable highlights:
- In September 2020, the revenue stood at $23.52 billion. However, there was a slight dip to $23.17 billion by December 2020.
- From December 2020 to March 2021, the revenue increased by roughly $0.7 billion, reaching $23.84 billion.
- A significant uptick was observed in June 2021 when it reached $27.12 billion, an impressive increase from March’s figures.
- This upward trajectory continued, reaching $29.06 billion in October 2021 and $30.36 billion in January 2022.
- The revenue experienced steady growth in the remainder of 2022. By October 2022, SBUX had a revenue of $32.25 billion.
- In 2023, the revenue maintained an upward trend. As of July 2023, the total revenue stood at $35.02 billion, a consistent growth from $32.91 billion in January 2023.
Comparing the first value ($23.52 billion in September 2020) with the last ($35.02 billion in July 2023), there is a significant growth of approximately $11.5 billion. This equates to a substantial growth rate over this period. The data from the most recent years indicate that SBUX operates in a favorable environment for its growth.

The data series presented represents the asset turnover of SBUX from September 27, 2020, to July 2, 2023. Here are some key takeaways on trends and fluctuations in the data:
- The asset turnover of SBUX shows an overall increasing trend during this period.
- From September 2020 to December 2020, the asset turnover decreased slightly from 0.83 to 0.80.
- Starting from December 2020, a consistent upward trend in asset turnover shows improved efficiency in using assets to generate sales. In March 2021, it came back to 0.82, in June 2021, it increased to 0.93 and continued increasing every quarter, reaching 1.23 by July 2023.
- By the end of the series in July 2023, the turnover had grown significantly, representing a round growth rate of approximately 49%.
- The most recent data point from July 2023 reports the highest asset turnover at 1.23, indicating continually improving efficiency.
In terms of absolute numerical growth, the data suggests that SBUX is increasingly becoming more successful in converting its assets into sales. The presence of continuous upward trends, with no significant downward fluctuations, reinforces the signs of financial health in the company.

An Overview of Starbucks Corporation’s Share Price Fluctuation for Six Months in 2023
The provided data tracks the weekly share price of SBUX over approximately a six-month period in 2023. Here’s an overview of the trend and growth rate:
- From March through April, the share price showed a steady incline. It started at $102.49 at the end of March and increased to its peak value of $111.18 by the end of April.
- In May, the trend shifted, and share prices fluctuated to a decreasing trend. The price peaked at the start of May at $109.02, lowering to the end of the month at $100.228.
- June saw a notable decline in the start and a slight recovery towards its end. Prices ranged from $98.08 to $100.55.
- In July, the share price showed a slightly increasing trend, starting from $97.53 and climaxing to $102.08 by the month’s end.
- The share price in August fluctuated between decreasing and slightly increasing trends, ending the month on a decline at $95.63.
- September revealed volatility, with prices ranging from $98.11 at the start of the month to a low of $92.74 by September 25.
Overall, the data reveals an undulating trend across these months, with periods of both growth and decline. Looking at the bigger picture, the data suggests a generally down-trending growth rate. Thus, the long-term trend indicates a downward motion. Here is a chart of SBUX’s price over the past 180 days.

Assessing Starbucks’ Market Performance: An Analysis of Quality, Momentum and Stability
The POWR Ratings grade of SBUX, which falls under the category of Restaurants stocks, which consists of a total of 44 stocks, is summarized below based on the provided weekly data:
- April 2023: The POWR grade started as a C (Neutral), where it stood on the #23 rank during the first week, then gradually dropped to #25 place by mid-April. However, by the end of April, the POWR grade improved to a B (Buy), and the rank in the category also improved, standing at place #19 out of 44.
- May 2023: The rank in the category made significant progress, reaching #12 place while maintaining a consistent POWR grade of B (Buy).
- June 2023: While the POWR grade remained a steady B (Buy), the rank oscillated between #12 and #20 throughout the month.
- July 2023: SBUX maintained the B (Buy) POWR grade throughout July, with ranks fluctuating between #12 to #16 in its category.
- August 2023: Strong performance was shown in this month as it reached the #10 place within the category while continuing with a B (Buy) grade.
- September 2023: The POWR grade stayed at B (Buy), but the rank in the category had minor ups and downs between #11 and #13 within the month.
In conclusion, the latest value for SBUX, as of September 26, 2023, is a POWR Grade of B (Buy) with a rank of #11 in the Restaurants stocks category.
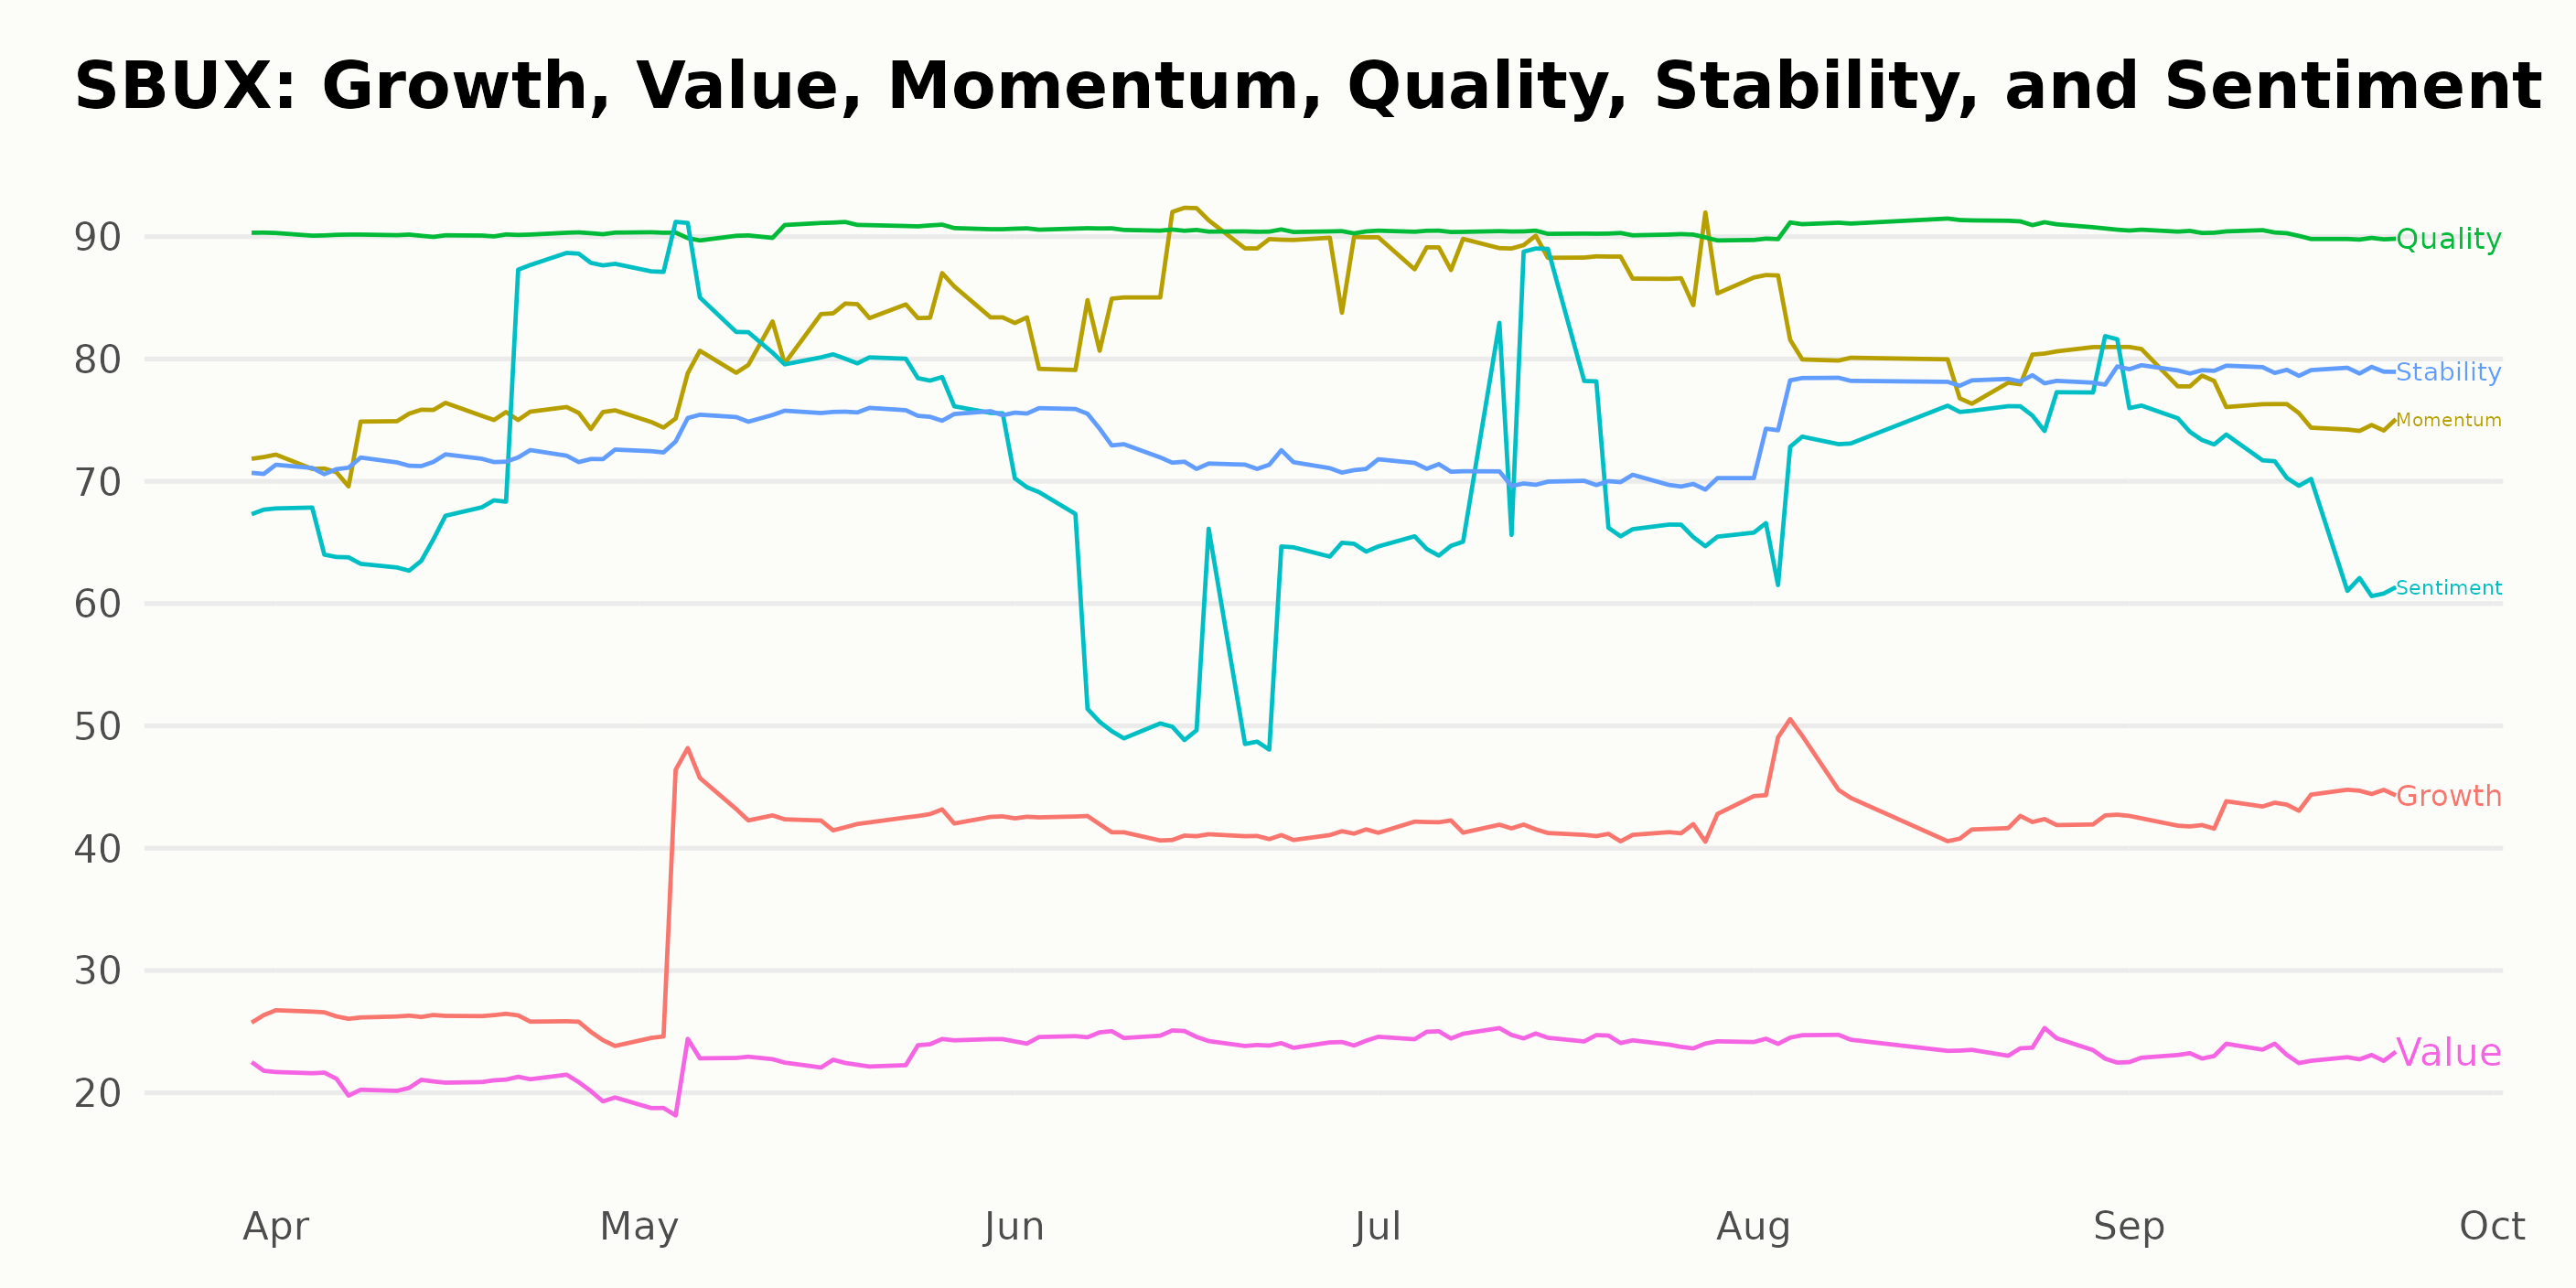
In assessing SBUX along six dimensions as per the POWR Ratings, we will focus on the three most noteworthy dimensions – Quality, Momentum, and Stability. The findings indicate vital trends and performance peaks.
- Quality: The Quality dimension consistently reports the highest ratings for SBUX across the analyzed period. With a high score of 91 reached in May 2023, this standing value continues to hold until August 2023. Although there’s a slight dip back to 90 in September 2023, this dimension maintains a commendable performance, indicative of the company’s solid business specifications.
- Momentum: Momentum emerges as another strong dimension for the corporation. Starting with a rating of 72 in March 2023, it rose steadily, peaking at 88 in July 2023. Despite a small decline to 77 by September 2023, the overall upward trend signals positive growth and escalating market enthusiasm toward SBUX within this timeframe.
- Stability: The Stability dimension also exhibits an interesting trend, although not as high as the previous two dimensions. From a score of 71 in March 2023, it sees a steady increase, reaching a high of 79 in September 2023. This consistent progression indicates growing stability in SBUX’s performance over this period and forms an integral part of the company’s robust market profile.
In summary, the Quality, Momentum, and Stability dimensions provide intensified insights into the SBUX’s considerable market performance within the POWR Ratings framework.
How does Starbucks Corporation (SBUX) Stack Up Against its Peers?
Other stocks in the Restaurants sector that may be worth considering are Rave Restaurant Group, Inc. (RAVE), Biglari Holdings Inc. (BH), and Nathan’s Famous, Inc. (NATH), with an A (Strong Buy) or B (Buy) overall rating. Click here to explore more stocks in the Restaurants sector.
43 Year Investment Pro Shares Top Picks
Steve Reitmeister is best known for his timely market outlooks & unique trading plans to stay on the right side of the market action. Click below to get his latest insights…
Steve Reitmeister’s Trading Plan & Top Picks >
Want More Great Investing Ideas?
SBUX shares were trading at $91.38 per share on Tuesday morning, down $1.36 (-1.47%). Year-to-date, SBUX has declined -6.46%, versus a 12.98% rise in the benchmark S&P 500 index during the same period.
About the Author: Anushka Dutta

Anushka is an analyst whose interest in understanding the impact of broader economic changes on financial markets motivated her to pursue a career in investment research. More...
More Resources for the Stocks in this Article
| Ticker | POWR Rating | Industry Rank | Rank in Industry |
| SBUX | Get Rating | Get Rating | Get Rating |
| RAVE | Get Rating | Get Rating | Get Rating |
| BH | Get Rating | Get Rating | Get Rating |
| NATH | Get Rating | Get Rating | Get Rating |


