
The stock market tends to overshoot on both the downside and upside. The way the indices came roaring back, the “Nasdaq 100 (QQQ)” hitting a new all-time high and the “S&P 500 (SPY)” on hopes of a “V” recovery, now looks increasingly-overly optimistic as a spike in COVID cases is causing a backpedaling of reopening the economy.
“Nike’s (NKE)” disappointing earnings report last night could be a harbinger that the upcoming earnings season will show Wall Street cannot continue to be disconnected from Main Street. I need to reiterate how the big five and high growth tech stocks have carried the headline indices over the two months; due to their huge market cap weightings, “Apple (AAPL),” “Microsoft (MSFT),” “Amazon (AMZN),” and “Alphabet (GOOGLE)” now represents 42% of the QQQ and 23% of the SPY.
As those big 5 are hitting all-time highs, they can push the indices up, masking the fact that the average stock is now 18% below its highs and over 65% of stocks remain below their 200 day -moving average — meaning they remain in a downtrend.
But can we count on these ‘generals’ to remain bulletproof and keep charging higher if none of the soldiers follow?
Analysts were recently upgrading their price targets for S&P 500 stocks at the fastest pace ever. Keep in mind that at the S&P’s bottom in March, analysts were downgrading at the fastest ever. Prior instances of analysts chasing the rally almost always led to an S&P 500 pullback/correction in the next 2-3 months.
While there are some businesses that have clearly benefited from the work-from-home phenomenon. I don’t think big tech in general can remain immune to a broad economic slowdown. If we look at the actual GAAP earnings for the S&P 500 Tech sector, we find a decline of 10% in the first quarter versus the prior year. This was considerably better than the S&P 500 as a whole (-66% YoY), but still down nonetheless.
Second-quarter earnings are expected to be lower once again, calling into question the notion of total immunity. But investors seem to be clinging to the narrative that this recession is bullish for tech as it accelerates existing trends such as online shopping and cloud computing. Tech stocks today are pricing in a fairy-tale outcome: a V-shaped recovery with no impact whatsoever from the deepest economic contraction and highest unemployment the world has seen since the Depression.
In addition to these macro concerns, there are multiple short-term technical indicators suggesting the market is in a very fragile state and vulnerable to a steeper pullback. The first item speaks to the above notion that the rally has come too far too fast. The Moving Average Convergence Divergence (MACD) is an indicator that shows the relationship between two moving averages of a security’s price. The MACD is calculated by subtracting the 26-period exponential moving average (EMA) from the 12-period EMA.
You can see this has hit a level indicating a major sell-signal.
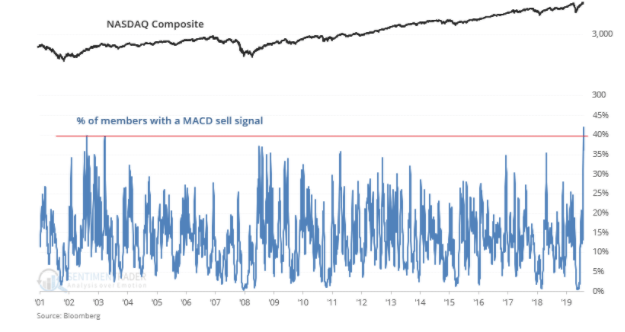
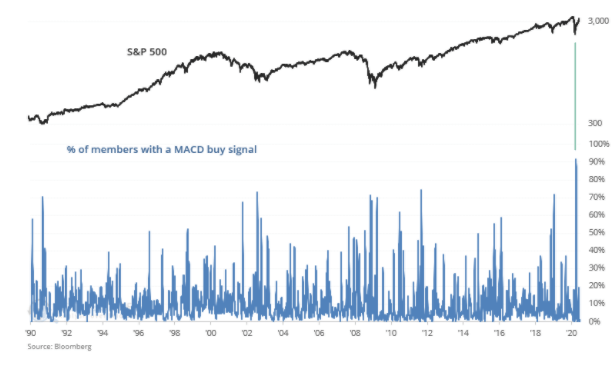
If you want to question the reliability of the MACD, please note it has also marked major lows. What we’re seeing right now is exactly the opposite of what we saw at the stock market’s bottom in late-March.
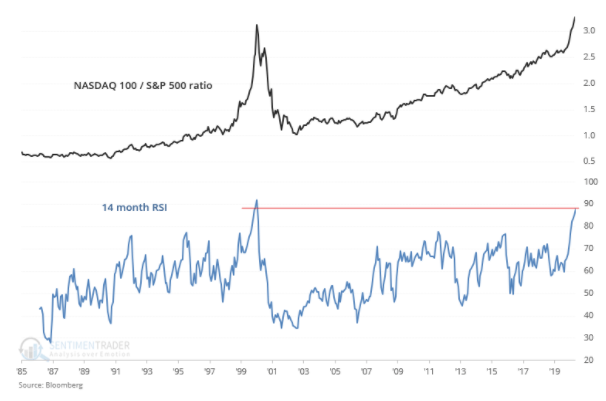
Another important technical reading is the Relative Strength Indicator or RSI, which hit the highest level since the peak of the dot-com bubble. Moreover, the ratio itself is higher than where it was during the dot-com bubble.
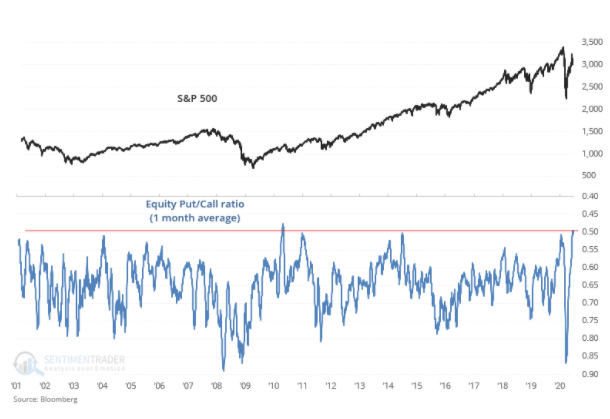
Lastly, we have the speculative frenzy that has been taking place among some retail traders. We’ve discussed the ‘Robinhood’ and Barstool effect that has caused the irrational price moves of everything from penny stocks, bankrupt entities to move up 500% plus, and the increasing use of options to gain upside leverage. The Equity Put/Call ratio 1-month average has reached a level, where historically, stocks almost always pulled back over the next 2-3 months.
At some point, the curtain will be drawn back on this magical thinking that all the bad news will simply disappear and will need to be borne out by the numbers. And I think the numbers will tell a more sobering tale.
To learn more about Steve Smith’s approach to trading and to access to his Option360 program, click here.
SPY shares were trading at $300.97 per share on Friday afternoon, down $6.38 (-2.08%). Year-to-date, SPY has declined -5.53%, versus a % rise in the benchmark S&P 500 index during the same period.
About the Author: Option Sensei

Steve has more than 30 years of investment experience with an expertise in options trading. He’s written for TheStreet.com, Minyanville and currently for Option Sensei. Learn more about Steve’s background, along with links to his most recent articles. More...
More Resources for the Stocks in this Article
| Ticker | POWR Rating | Industry Rank | Rank in Industry |
| SPY | Get Rating | Get Rating | Get Rating |
| QQQ | Get Rating | Get Rating | Get Rating |