

- Crude oil is consolidating just below the resistance level
- The XLE has not been keeping pace
- Oil services and the OIH are weak- is it a sign for the energy commodity?
The shares of companies that explore, produce, and provide services for the crude oil business underperformed both the WTI and Brent crude oil futures markets on the NYMEX and the Intercontinental Exchange in 2018, 2019, and into the early months of 2020. The performance of oil-related shares was a warning sign for the price of the energy commodity.
When crude oil rose to a high of $65.65 on nearby WTI futures and $71.99 per barrel on Brent futures in early January, oil-related shares did not follow. At the same time, the stock market was making new highs. The oil stocks turned a blind eye to supply fears in the Middle East as tensions between the US and Iran rose at the start of 2020.
While the stocks did not follow crude oil higher, they tanked when the price was moving to the downside in February and March. As the global pandemic spread around the world, the demand for crude oil evaporated. The price of the energy commodity fell off the edge of a cliff, and oil-related shares followed.
August crude oil futures reached a low of $20.28 per barrel on April 22. Most of the energy-related shares hit bottom one month earlier in March during the stock market risk-off period. Meanwhile, crude oil has made a significant comeback, doubling in price since the late April low on the August futures on NYMEX. The energy shares have lagged the price of the energy commodity over the past months as the price of oil recovered. However, they have outperformed the overall stock market. The United States Oil Fund (USO - Get Rating) attempts to replicate the price action of a portfolio of contracts in the NYMEX crude oil futures market. The Energy Select SPDR Fund (XLE - Get Rating) holds shares in many of the leading oil companies. The VanEck Vectors Oil Services ETF (OIH - Get Rating) owns a portfolio of stocks in the oil services sector. The XLE and OIH continued to underperform the crude oil market’s price action as of the end of last week.
Crude oil is consolidating just below the resistance level
After reaching a low of just over $20 per barrel in April, the price of crude oil climbed steadily and at the most recent high of $41.63 in late June, more than doubled in value.
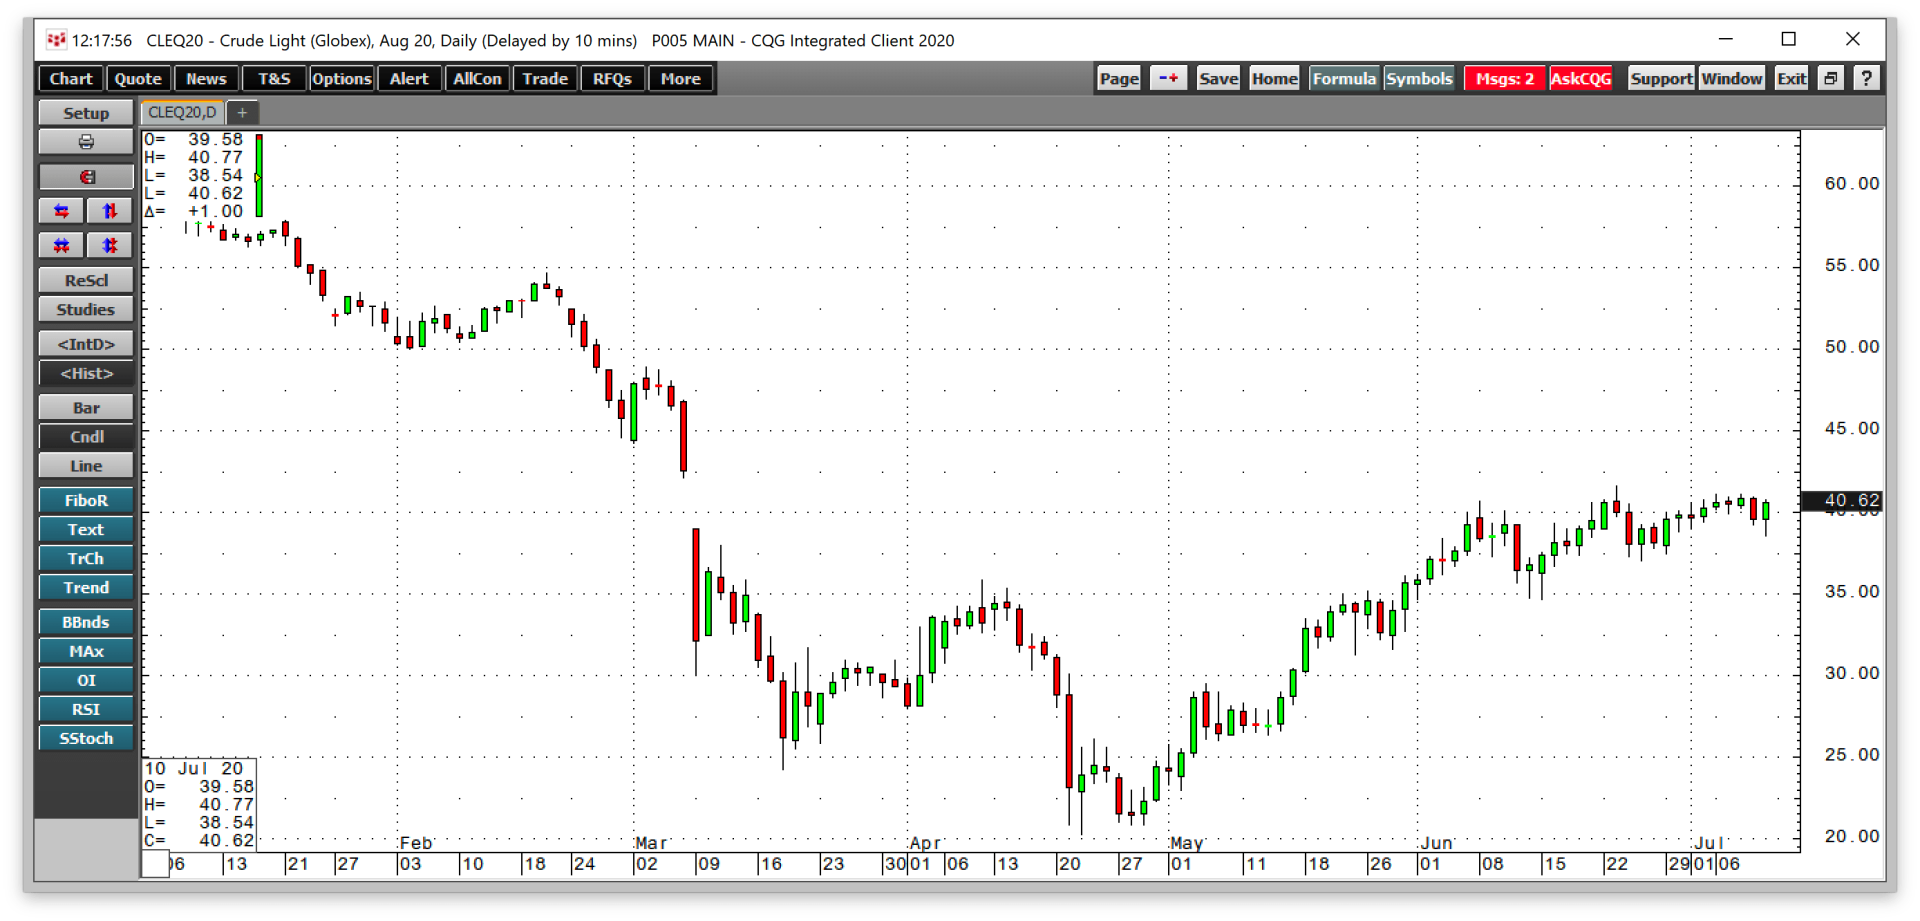
(Source: CQG)
At the end of last week, the price was sitting at just over the $40 per barrel level. Since making the high at $41.63 on June 23, August crude oil has traded in a range from $37.08 to a high of $41.08. There is a short-term double top at the $41.08 level from July 6 and July 8, as the nearby futures have been consolidating around a $40 per barrel pivot point.
Production cuts by OPEC, Russia, and other world producers, which currently run through the end of July and falling US output, have lifted the price of crude oil as the market continues to struggle with the demand side of the fundamental equation. While crude oil made a significant recovery, the shares of oil-related companies continue to lag the price action in the energy commodity. However, they outperformed the overall stock market since the March low. As of Friday, July 10, the S&P 500 index recovered by more than 45.3% at the end of last week.
The XLE has not been keeping pace
XLE holds shares in many of the leading oil-related companies and has an over 45% exposure to Chevron (CVX) and Exxon (XOM), the two leading US energy companies.
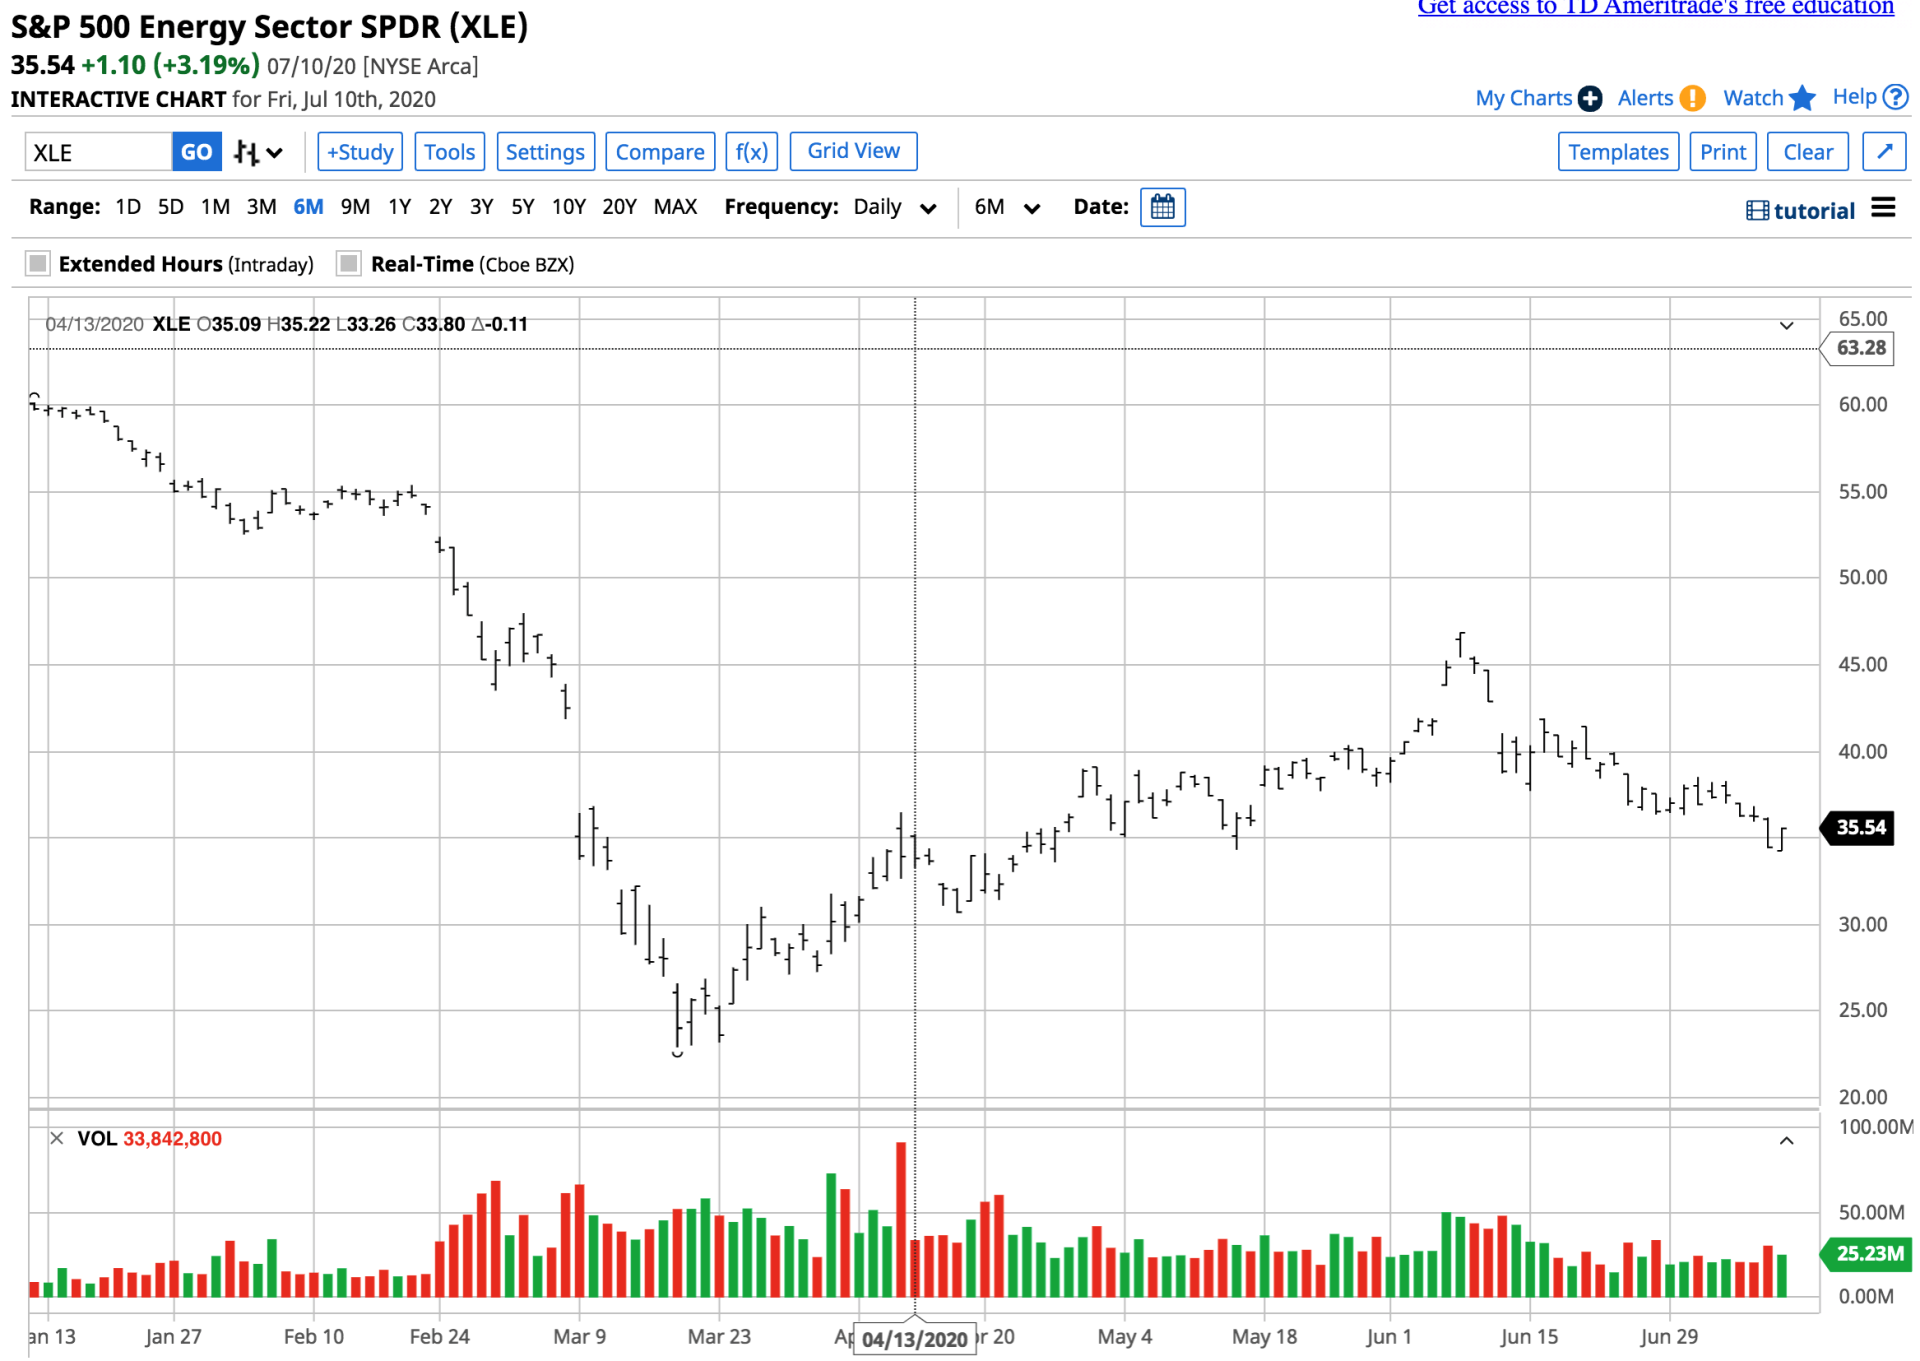
(Source: Barchart)
The chart of the XLE shows that it recovered from a low of $22.88 in mid-March, the lowest level since 2003, to $35.54 per share at the end of last week. The XLE rose by 55.3% since the March low.
The ETF product has net assets of $10.4 billion and trades over 31 million shares each day. It charges holders a 0.13% expense ratio, but the latest blended dividend yield of 10.6% more than offsets the cost of the product.
The XLE has not kept pace with the recovery in the oil market, which is a pattern that has been in place over the past years. Meanwhile, its outperformance compared to the S&P 500 is a promising sign for the sector.
Oil services and the OIH are weak- is it a sign for the energy commodity?
OIH holds a portfolio of shares in the leading companies that service the oil-producing business. The OIH has just over a 37% exposure to Schlumberger (SLB), Halliburton (HAL), and Baker Hughes (BKR), the top service companies.
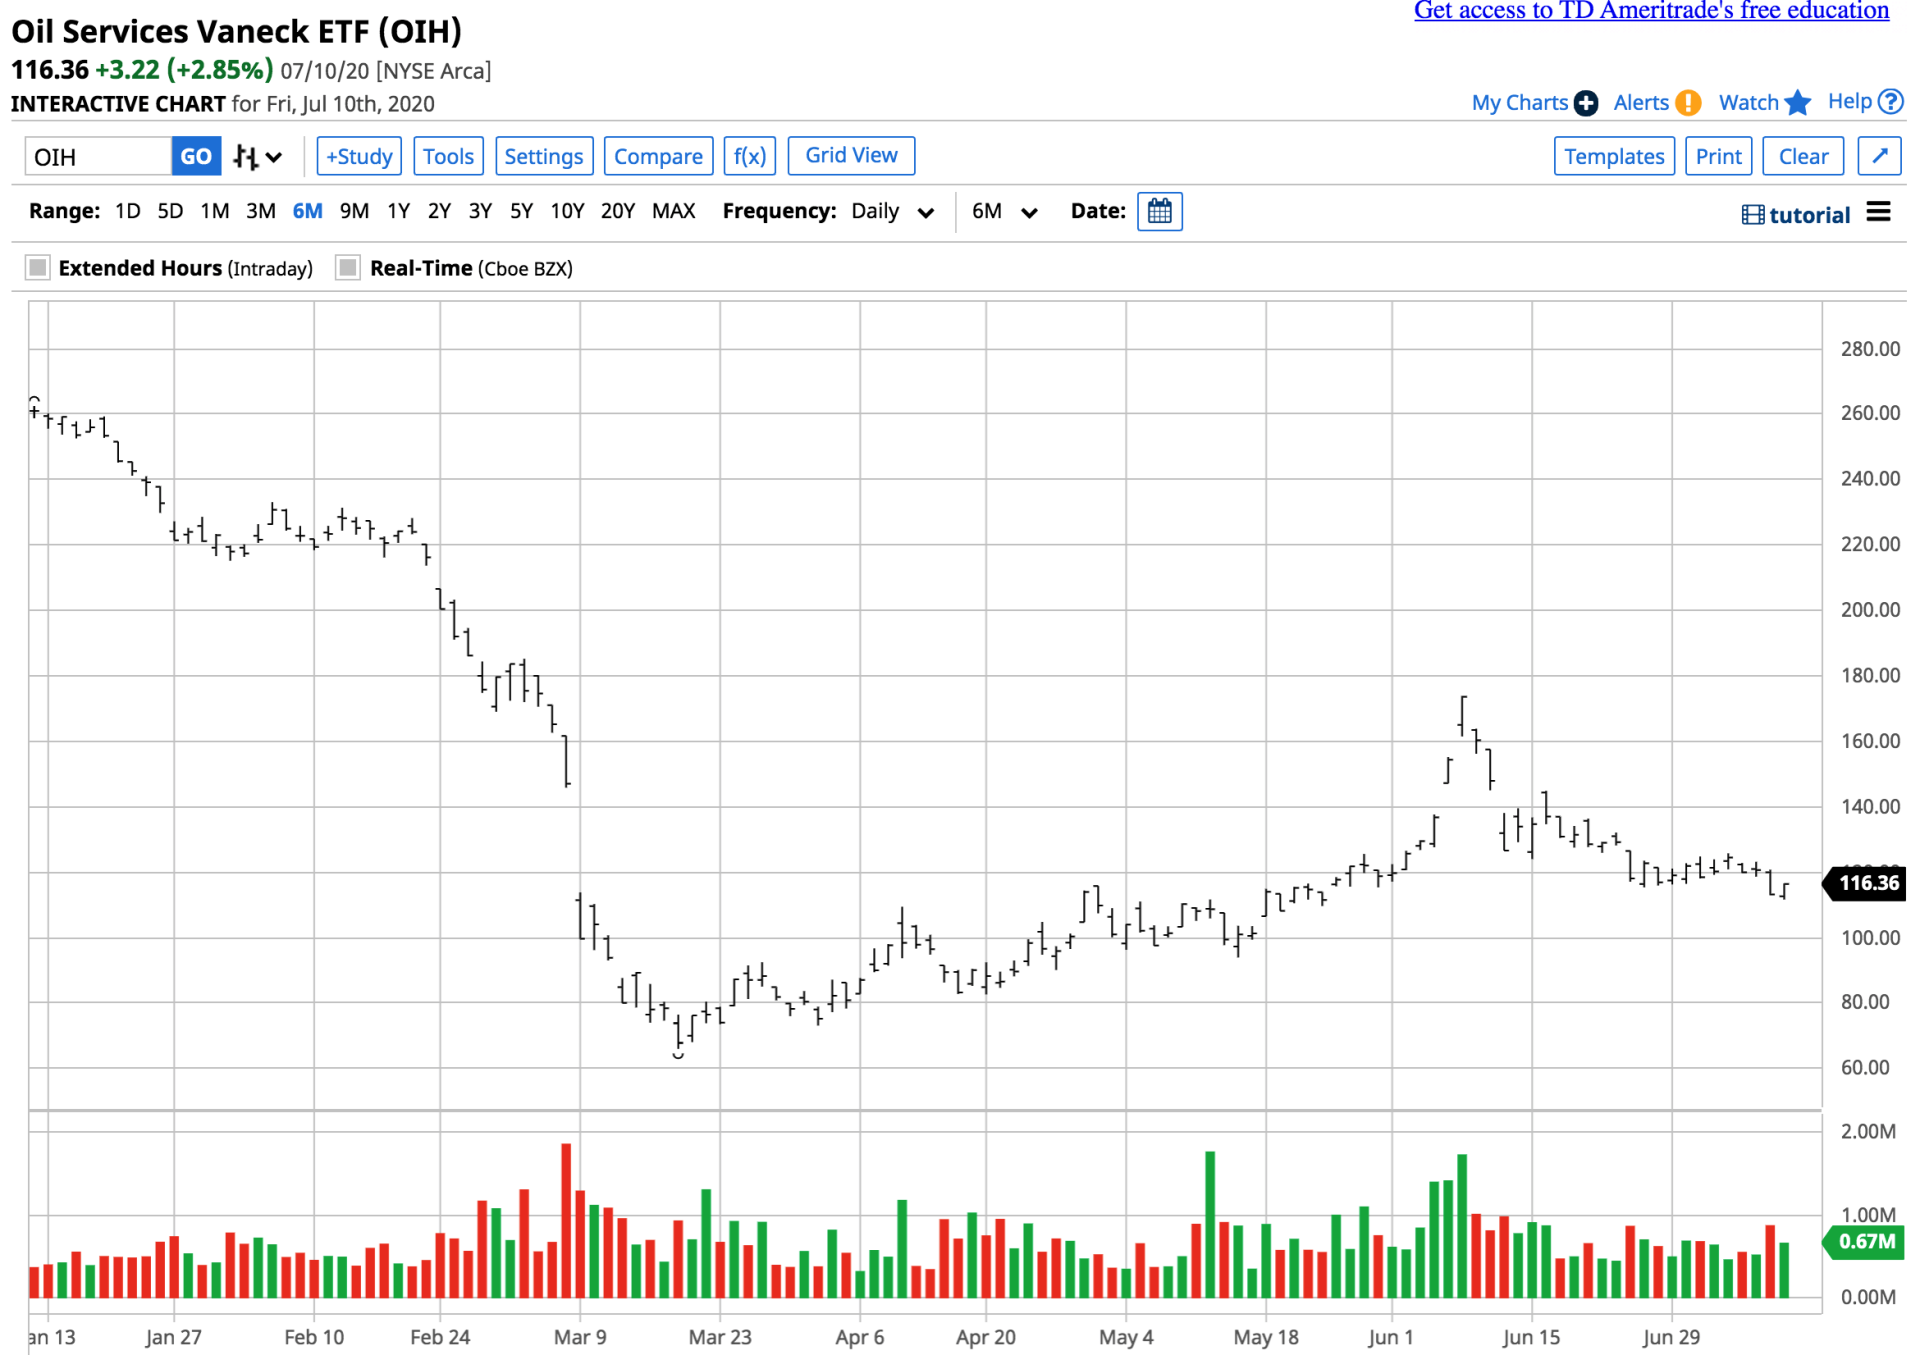
(Source: Barchart)
As the chart shows, OIH fell to an all-time low of $66 per share in March and was trading at around the $116.36 level at the end of last week, a recovery of over 76% from the low.
OIH has net assets of $475.06 million, trades an average of over 841,000 shares each day, and charges a 0.35% expense ratio. The blended dividend yield of 4.77% more than compensates for the expense ratio for holders of the EFT product.
The price of crude oil remained stuck at the $40 per barrel level at the end of last week. The XLE and OIH products have done better than the overall stock market, which could be a promising sign that when crude oil finally decides to move away from the $40 pivot point, the move could take the price higher.
Want More Great Investing Ideas?
9 “BUY THE DIP” Growth Stocks for 2020
Top 5 WINNING Stock Chart Patterns
7 “Safe-Haven” Dividend Stocks for Turbulent Times
USO shares fell $0.13 (-0.45%) in premarket trading Monday. Year-to-date, USO has declined -71.92%, versus a 0.42% rise in the benchmark S&P 500 index during the same period.
About the Author: Andrew Hecht

Andy spent nearly 35 years on Wall Street and is a sought-after commodity and futures trader, an options expert and analyst. In addition to working with StockNews, he is a top ranked author on Seeking Alpha. Learn more about Andy’s background, along with links to his most recent articles. More...
More Resources for the Stocks in this Article
| Ticker | POWR Rating | Industry Rank | Rank in Industry |
| USO | Get Rating | Get Rating | Get Rating |
| OIH | Get Rating | Get Rating | Get Rating |
| XLE | Get Rating | Get Rating | Get Rating |


