
Hewlett Packard Enterprise Company (HPE): Price and Financial Metrics
HPE Price/Volume Stats
| Current price | $19.76 | 52-week high | $22.82 |
| Prev. close | $19.45 | 52-week low | $14.47 |
| Day low | $19.54 | Volume | 7,954,713 |
| Day high | $19.91 | Avg. volume | 15,644,929 |
| 50-day MA | $20.04 | Dividend yield | 2.53% |
| 200-day MA | $17.36 | Market Cap | 25.68B |
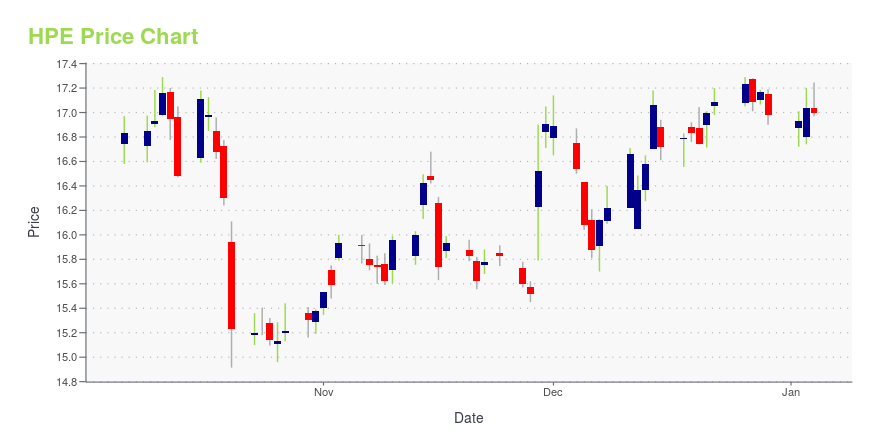
HPE Stock Price Chart Interactive Chart >
Hewlett Packard Enterprise Company (HPE) Company Bio
Hewlett-Packard Enterprise Co was formed on November 1, 2015, following its separation from the Hewlett-Packard Company and began trading on the NYSE on November 2, 2015. The firm is a communication equipment company that provides servers, storage, networking, and technology services. Its business segments are Enterprise Group, Software, Enterprise Services, Financial Services and Corporate Investments. Hewlett-Packard’s main competitors include companies such as Dell Technologies, Inc., International Business Machines Corporation (IBM), NetApp, Inc., and Lenovo Group Limited. As of 2020, the company had approximately 60,000 employees worldwide and had just under $27 billion U.S. dollars in annual net revenue. Antonio Neri serves as the company's Chief Executive Officer and has been with the firm for over 25 years.
Latest HPE News From Around the Web
Below are the latest news stories about HEWLETT PACKARD ENTERPRISE CO that investors may wish to consider to help them evaluate HPE as an investment opportunity.
Why Is Hewlett Packard Enterprise (HPE) Up 3.5% Since Last Earnings Report?Hewlett Packard Enterprise (HPE) reported earnings 30 days ago. What's next for the stock? We take a look at earnings estimates for some clues. |
Decoding Hewlett Packard Enterprise Co (HPE): A Strategic SWOT InsightInsightful Analysis of HPE's Financial Health and Strategic Position |
3 Warren Buffett-Approved Dividend StocksThese dividend stocks offer more than just attractive yields. |
With EPS Growth And More, Hewlett Packard Enterprise (NYSE:HPE) Makes An Interesting CaseInvestors are often guided by the idea of discovering 'the next big thing', even if that means buying 'story stocks... |
Hewlett Packard (HPE) to Build Hunter & Herder SupercomputersHewlett Packard (HPE) partners with the University of Stuttgart to build two supercomputers, named Hunter and Herder, for the latter's High-Performance Computing Center. |
HPE Price Returns
| 1-mo | -5.54% |
| 3-mo | 15.78% |
| 6-mo | 26.42% |
| 1-year | 17.08% |
| 3-year | 51.07% |
| 5-year | 59.57% |
| YTD | 17.93% |
| 2023 | 9.72% |
| 2022 | 4.49% |
| 2021 | 37.37% |
| 2020 | -21.94% |
| 2019 | 23.72% |
HPE Dividends
| Ex-Dividend Date | Type | Payout Amount | Change | ||||||
|---|---|---|---|---|---|---|---|---|---|
| Loading, please wait... | |||||||||
Continue Researching HPE
Want to see what other sources are saying about Hewlett Packard Enterprise Co's financials and stock price? Try the links below:Hewlett Packard Enterprise Co (HPE) Stock Price | Nasdaq
Hewlett Packard Enterprise Co (HPE) Stock Quote, History and News - Yahoo Finance
Hewlett Packard Enterprise Co (HPE) Stock Price and Basic Information | MarketWatch
Loading social stream, please wait...