If you thought December’s stock market plunge was unusually painful you’re absolutely right. At the December 24th lows the S&P 500 (SPY) was having its worst December in history (worse than the Great Depression) and the 11th worst month of all time. And while the official 19.8% closing peak decline that day didn’t officially kill the bull market, the Nasdaq (QQQ) officially closed down 23% (bear market), as did 66% of S&P 500 companies (Apple ultimately fell 40% from its recent peak).
But market volatility can work both ways. The crazed selling we saw in December has been followed by a very strong rally that has helped the market wipe out about half its peak losses. So naturally, still skittish investors, aware of all the risks we’re still facing, want to know whether this rally can last, and more importantly whether 2019 can be a strong year for stocks after 2018’s disappointing results (worst returns since 2008).
So let’s take a look at both questions, to help you understand what you can expect from the market in 2019.
Can This Current Rally Last?
Ken Fischer of Fisher Investments has an interesting idea about what might have contributed to the massive sell of in December. Mr. Fischer thinks that hedge funds, expecting large scale redemption requests in early January (most hedge funds only allow investors to withdraw money in short periods twice a year) sold in order to have the cash to fill those requests. Another source of selling might have been mass liquidations of hedge funds that were so far underwater (20% performance is based on the funds last all-time high) that some asset managers chose to close down these funds and start over with a new one (to earn that 20% profit bonus off a reset benchmark).
According to Fischer, that might explain the V-shaped nature of both the market’s decline as well as the recent rally. It’s impossible to know how much such hedge fund selling played in the stock market’s performance over the last few months, but what history does tell us is that large scale declines are indeed typically followed by sharp recoveries over the following year.
For example, since 1926 whenever the market has a down year the average gain for the next year is 13%. What’s more since 1926 the average 12-month rally off correction lows is 34% (not counting dividends which for the S&P 500 would add another 2%). Off a bear market low the average 12-month rally is 47% (49% with dividends).
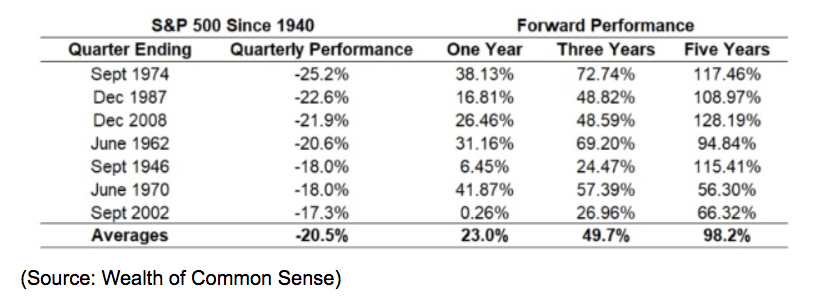
And if we look at quarterly historical data we see something even more important. Whenever the market has an especially terrible quarter (this time the peak decline was 20% making it the 5th worst quarter for the S&P 500 since WWII), stocks tend to an average of 23% over the following year. But more importantly post very strong three and five year gains as well.
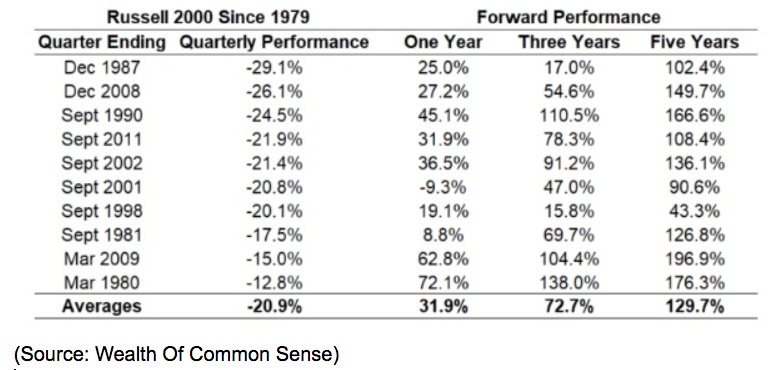
And it’s not just large caps like those in the S&P 500 that do well. Small caps stocks, as tracked by the Russell 2000, tend to fall harder but recover faster, with average 12-month rallies of 32% and even better three and five-year returns.
Analyst expectations for the S&P 500 at the start of the year were for the market to rally 20% to end the year at about 3,000. Those expectations are pure guesses of course but are indeed supported by the historical data.
But as the saying goes “hope is a poor investing strategy”. So let’s take a look at whether or not the fundamentals (primarily earnings) support such an optimistic outlook (of a 20+% rally in 2019).
Why Investors Can Likely Expect Good Returns In 2019
Two things ultimately determine stock market total returns over all but the shortest of time periods, valuations (such as PE ratio) and fundamentals (earnings, cash flow, dividends, and the next year’s outlook).
When the market apparently bottomed on December 24th the stock market had transformed from one that was historically highly overvalued (forward pe of 18.2 at the end of 2017) to one that was historically undervalued (13.7). The below table is based on the data that includes the 5% post-Christmas rally (biggest in history).
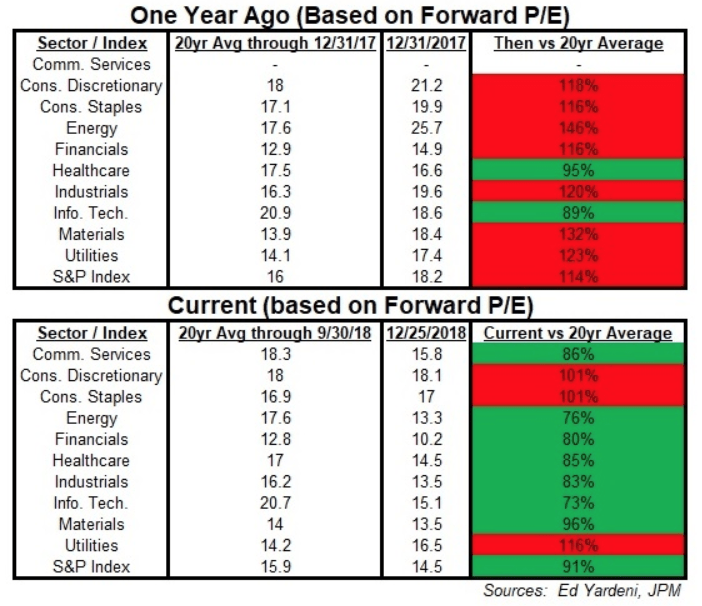
As you can see, at the end of 2017 (the second lowest volatility ever), a 20% market rally meant that nearly every sector was overvalued and the market itself was 14% above its 20-year average forward PE of 16.0. At the bottom of the most severe correction in a decade, nearly every sector was undervalued, with energy, courtesy of a 45% 2-month oil crash, being 24% undervalued.
Buying at such low valuations has historically been a great way to generate strong returns, both over the next year and the next five years.
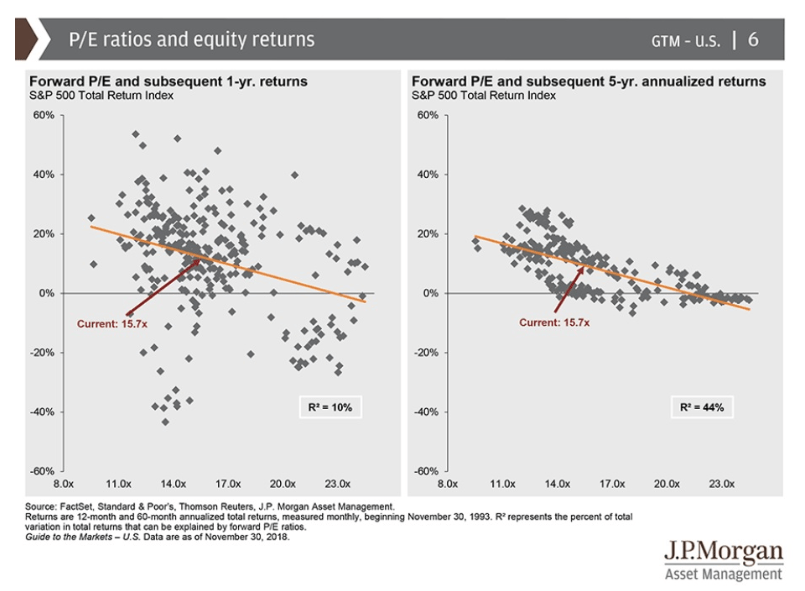
According to research from JPMorgan Asset Management, buying when the market’s forward PE was 13.7 has usually meant total returns of about 18% over the next 12 months, roughly in line with what analysts expect for 2019. More importantly, while one-year returns are far from assured (due to short-term sentiment dominating fundamentals) the valuations we saw in December are typically associated with 5-year annualized forward returns of about 17%.
In other words, based on valuations alone it appears that December’s panic selling (including forced selling from both mutual funds and hedge funds) was a major overshoot that justifies stocks now rallying strongly and sustainably for the next year. BUT valuations alone don’t move stocks. After all, a PE ratio involves both the price, but also earnings (the fundamentals).
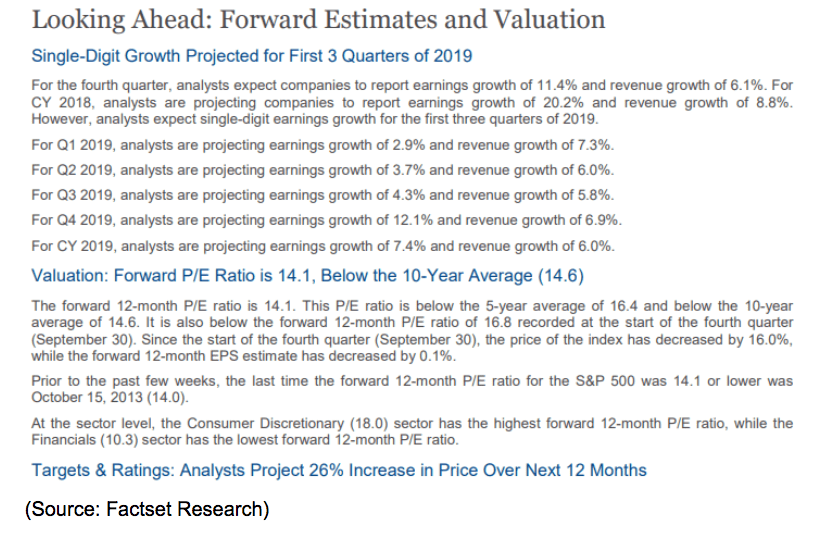
Fortunately, while analysts are expecting far slower earnings growth in 2019 (the same with economic growth of just 2.3% to 2.7% vs 3% in 2018), positive growth is still expected. Over the past 20 years in non-recessionary years analysts typically end up being 3.5% too bullish one earnings growth however in this case that might not prove to be the case. That’s because 2019’s EPS forecast has fallen by 3% over the past few months, both due to a trade war and overall economic concerns, but also because crude prices plunged by 45%. Thus energy company earnings were expected to weigh heavily on 2019’s EPS growth but oil prices recently rallied nearly 20%. With expectations extremely low for the first half of the year, it’s very possible that companies will beat these low hurdles (over the past five-years 71% of companies beat earnings expectations which are not usually this depressed).
Now, of course, the trade war is going to be a major wildcard. But given how well negotiations appear to be going (China has already started rolling back retaliatory tariffs and Bloomberg is reporting Trump is eager for a deal to boost stock prices), we could be in for good news on this front. Should we get a deal in the next six months or so, it’s very possible that EPS growth in 2019 does indeed come in at 7% to 8% (2020 estimates are for 8% to 9%).
With the S&P 500’s forward PE now at 14.5 (taking into account the 2.5% rally in the first half of this week) that implies that stocks could rally 18% in 2019 and merely return to their 20-year average historical multiple. And if we use the $173 estimated 2019 EPS for the S&P 500 (per Factset) and apply the historical 20.2 (40-year average) trailing PE ratio, then the S&P 500 could potentially reach 3,495 by the end of Q1 2020 (when we’ll know 2019’s full-year earnings). That would represent a 35% rally from the current levels as I write this (2,592).
Now that might seem outlandish but remember that the historical 12-month post-correction rally (since 1926) is 36%. Now I’m personally not expecting anything so grand from the market, however, a 20% 2019 rally certainly appears to be supported by both current valuations and fundamental trends. And if we get an end to the trade war that now hangs like a sword of Damocles over multinational earnings as most economists/analysts expect? Well, then a strong rally of even 36% over the next 15 months becomes more likely. But just because stocks are likely to finish strongly higher in 2019 (based on current fundamentals and trends) doesn’t mean that investors are necessarily in for smooth sailing.
Good Returns Likely Ahead…BUT With Plenty Of Volatility
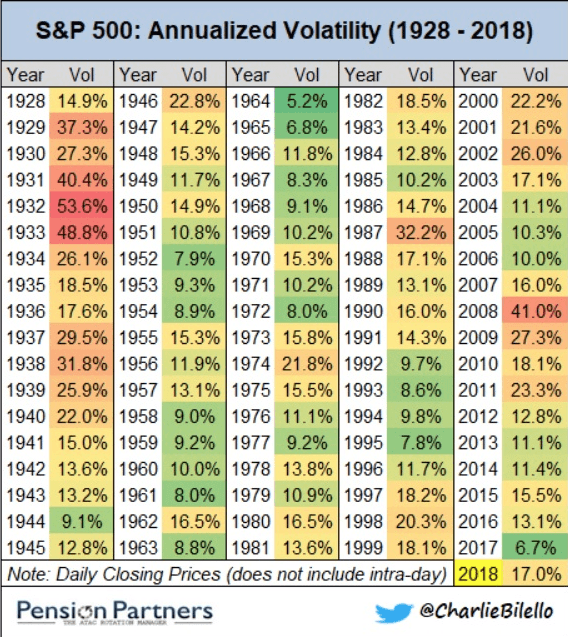
Since 1928 the average annualized volatility in the market was 16.3%. 2018’s “crazy” high volatility was just 4% above the historical norm though the highest in seven years. But 2017’s “golden age for stocks” was not normal and in fact, the second least volatile year since accurate data started being recorded.
In essence, this means that investors should expect roughly the same amount of volatility in 2018 in addition to likely stronger than average gains. What might that entail in the coming months? Well, the bad news is that as CNBC recently pointed out the recent 20% market decline (including intra-day low on Dec 24th) occurred within three months. That meets one technical definition of a stock crash. The last three such crashes (1987, 1998 and 2008) each saw stocks spike higher strongly off that 20% decline but then retrace to retest the lows within four to five weeks.
Given a large amount of uncertainty we face over the next few weeks (what’s likely to become the longest government shutdown in history reducing GDP growth by 0.05% per week is just one example), such a historical pattern could very well play out again. And let’s not forget that the Mueller report (pertaining to Russian meddling in the 2016 election which has resulted in 34 indictments already) is expected in mid-February. That would roughly coincide with a historical crash retracement and depending on the findings might cause our Tweet-happy and already unpredictable President to become even more volatile.
March 1st is the deadline for trade talks. If they are not extended then 10% tariffs on $200 billion in Chinese imports automatically jump to 25%. And if President Trump feels caged in by either a hostile Democrat-controlled House or political pressure from the Mueller report, then talks might potentially break down.
And March 1st is also the day the debt-ceiling, suspended since February 2018, returns. That ceiling is currently at $22 trillion and as of January 9th, 2019 the US national debt stands at $21.927 trillion. The Congressional Budget Office is projecting our annual deficit will be about $1 trillion in 2019 meaning we’re adding about $80 billion per month to the national debt. This means that as soon as the debt ceiling returns the US will be exceeding it and the US Treasury will have to start shuffling money around to avoid the US defaulting on either interest payments or maturing bonds.
Goldman Sachs estimates that Treasury can play this shell game at least until August but by no later than October the debt ceiling will need to be raised to avoid what Goldman calls a potentially “seismic shock” to the global credit markets. The debt ceiling was originally put into place in 1917 and has been raised 89 times including 15 times since 2001.
No matter what party was in charge (or who was president) Congress has always voted to raise the ceiling to ensure that US Treasuries remain the ultimate “risk-free” investment (a fact upon which the entire global economy is now based). While it’s highly unlikely that we even come close to defaulting on our debt, since 2011 each time the debt ceiling has reached its cap, there has been a showdown in Congress with deficit hawks in the GOP demanding major spending cuts. Typically they demand $2 in lower forward 10-year spending for each $1 the ceiling is raised as a prerequisite for the increase. With Congress now divided and squabbling like children over a mere $5.7 billion for a border wall, investors need to be prepared for not just a potential crash retracement to December 24th’s lows in the next few months, but a potential correction (or at least a pullback) surrounding a potential debt ceiling showdown as well
Basically, while the likely fundamentals (based on current estimates and trends) and current valuations support the market ending 2019 much higher, the path to those solid gains is likely to be fraught with high volatility and plenty of fear, uncertainty, and doubt. But it’s also likely to mean fantastic buying opportunities for anyone who knows what to buy, which is why I maintain no less than five watchlists of the best dividend stocks to buy at any given time that I track publicly each week.
Bottom Line: Stocks Are Likely To Have A Strong Year BUT Be Prepared For More Volatility Like In 2018
Predicting with precision what stocks will do in any given year is impossible, given that short-term prices are always at the whims of fickle and volatile investor sentiment. However, by looking at history, as well as valuations and fundamentals, we can get a rough, probabilistic estimate of what to expect from stocks in 2019.
The good news is that the worst correction in a decade left stocks highly undervalued, historically speaking. And while true that we’re facing slower economic growth in 2019, a recession isn’t likely, and the Federal Reserve is probably done hiking rates. That means that if we can get an end to the trade war with China, and avoid some other disaster (like a debt default or a year-long government shutdown), then stocks are likely to have a good year.
However, that doesn’t mean that we’re likely to see a repeat of 2017’s freakishly low volatility year. 2018’s volatility was just 4% above the long-term historical average and with many risks still facing us, including the most important earnings season in years, the market in general, and individual companies, in particular, are likely to see some crazy swings. Fortunately, wild short-term price swings are actually a smart investors’ greatest ally because embracing volatility is one of the three easiest ways to get rich in stocks.
About the Author: Adam Galas

Adam has spent years as a writer for The Motley Fool, Simply Safe Dividends, Seeking Alpha, and Dividend Sensei. His goal is to help people learn how to harness the power of dividend growth investing. Learn more about Adam’s background, along with links to his most recent articles. More...
9 "Must Own" Growth Stocks For 2019
Get Free Updates
Join thousands of investors who get the latest news, insights and top rated picks from StockNews.com!
Top Stories on StockNews.com

Verizon (VZ) vs. T-Mobile (TMUS) Earnings Analysis - Which Telecom Stock Should Investors Buy?
With escalating consumer demand for high-speed data connectivity and technological advancements, the telecom industry is well-positioned for long-term growth. So, let’s analyze Verizon Communications (VZ) and T-Mobile (TMUS) to determine which of these telecom stocks investors should buy post-earnings release. Read more to find out...
Top 3 Auto Stocks to Buy and Hold for Long-Term Gains
Auto sales are projected to rise due to improved inventories, strong demand, robust consumer confidence, and technological advancements. Therefore, investors could consider buying and holding fundamentally strong auto stocks Stellantis (STLA), Bayerische Motoren Werke (BMWYY), and DENSO (DNZOY) for long-term gains. Read on...
3 Tech Stocks Offering Long-Term Investment Opportunities
In today's tech-driven world, businesses are digitizing their operations and adopting cutting-edge technologies, thereby driving the tech industry's growth. Against this backdrop, fundamentally strong tech stocks Motorola Solutions (MSI), Dolby Laboratories (DLB), and TaskUs (TASK) could be ideal long-term additions to one’s portfolio. Read more...
3 Energy Stocks Poised for Rapid Growth in May
Oil and gas prices have been surging lately due to an improving demand outlook and persistent supply risks amid geopolitical tensions, creating tailwinds for the energy sector. Thus, it could be wise to invest in fundamentally sound energy stocks Cenovus Energy (CVE), Weatherford International (WFRD), and Gulf Island Fabrication (GIFI) for rapid growth in May. Read on…