
F5 Networks, Inc. (FFIV) reported better-than-expected fourth-quarter fiscal 2023 results. The non-GAAP EPS of the company stood at $3.50, surpassing the consensus estimate of $3.21, marking an impressive 33.6% surge from $2.62 in the prior-year quarter. This performance significantly exceeds management’s forecast range of $3.15 – $3.27 per share.
The revenue during this quarter also experienced significant growth, reaching $706.97 million, topping the consensus estimate of $702.25 million. Despite the prevalent macroeconomic uncertainties and constrained customer budgets, revenues rose by 1% year-over-year, aligning with the management’s guidance range of between $690 million to $710 million.
While FFIV expects some customer caution to persist into fiscal year 2024, it remains focused on delivering earnings growth and returning cash to its shareholders. For fiscal year 2024, FFIV expects to remain committed to its profitability commitment and deliver non-GAAP EPS growth of 5% to 7% year-over-year.
Since these positive earnings announcements, the company’s shares have seen significant growth and could see further upside. Hence, a prospective investor might consider FFIV a promising buy. Supporting this bullish outlook are a number of key metrics outlining FFIV’s stable financial performance.
F5 Networks Inc: Analysis of Net Income, Revenue, Gross Margin, and Key Metrics from 2020 to 2023
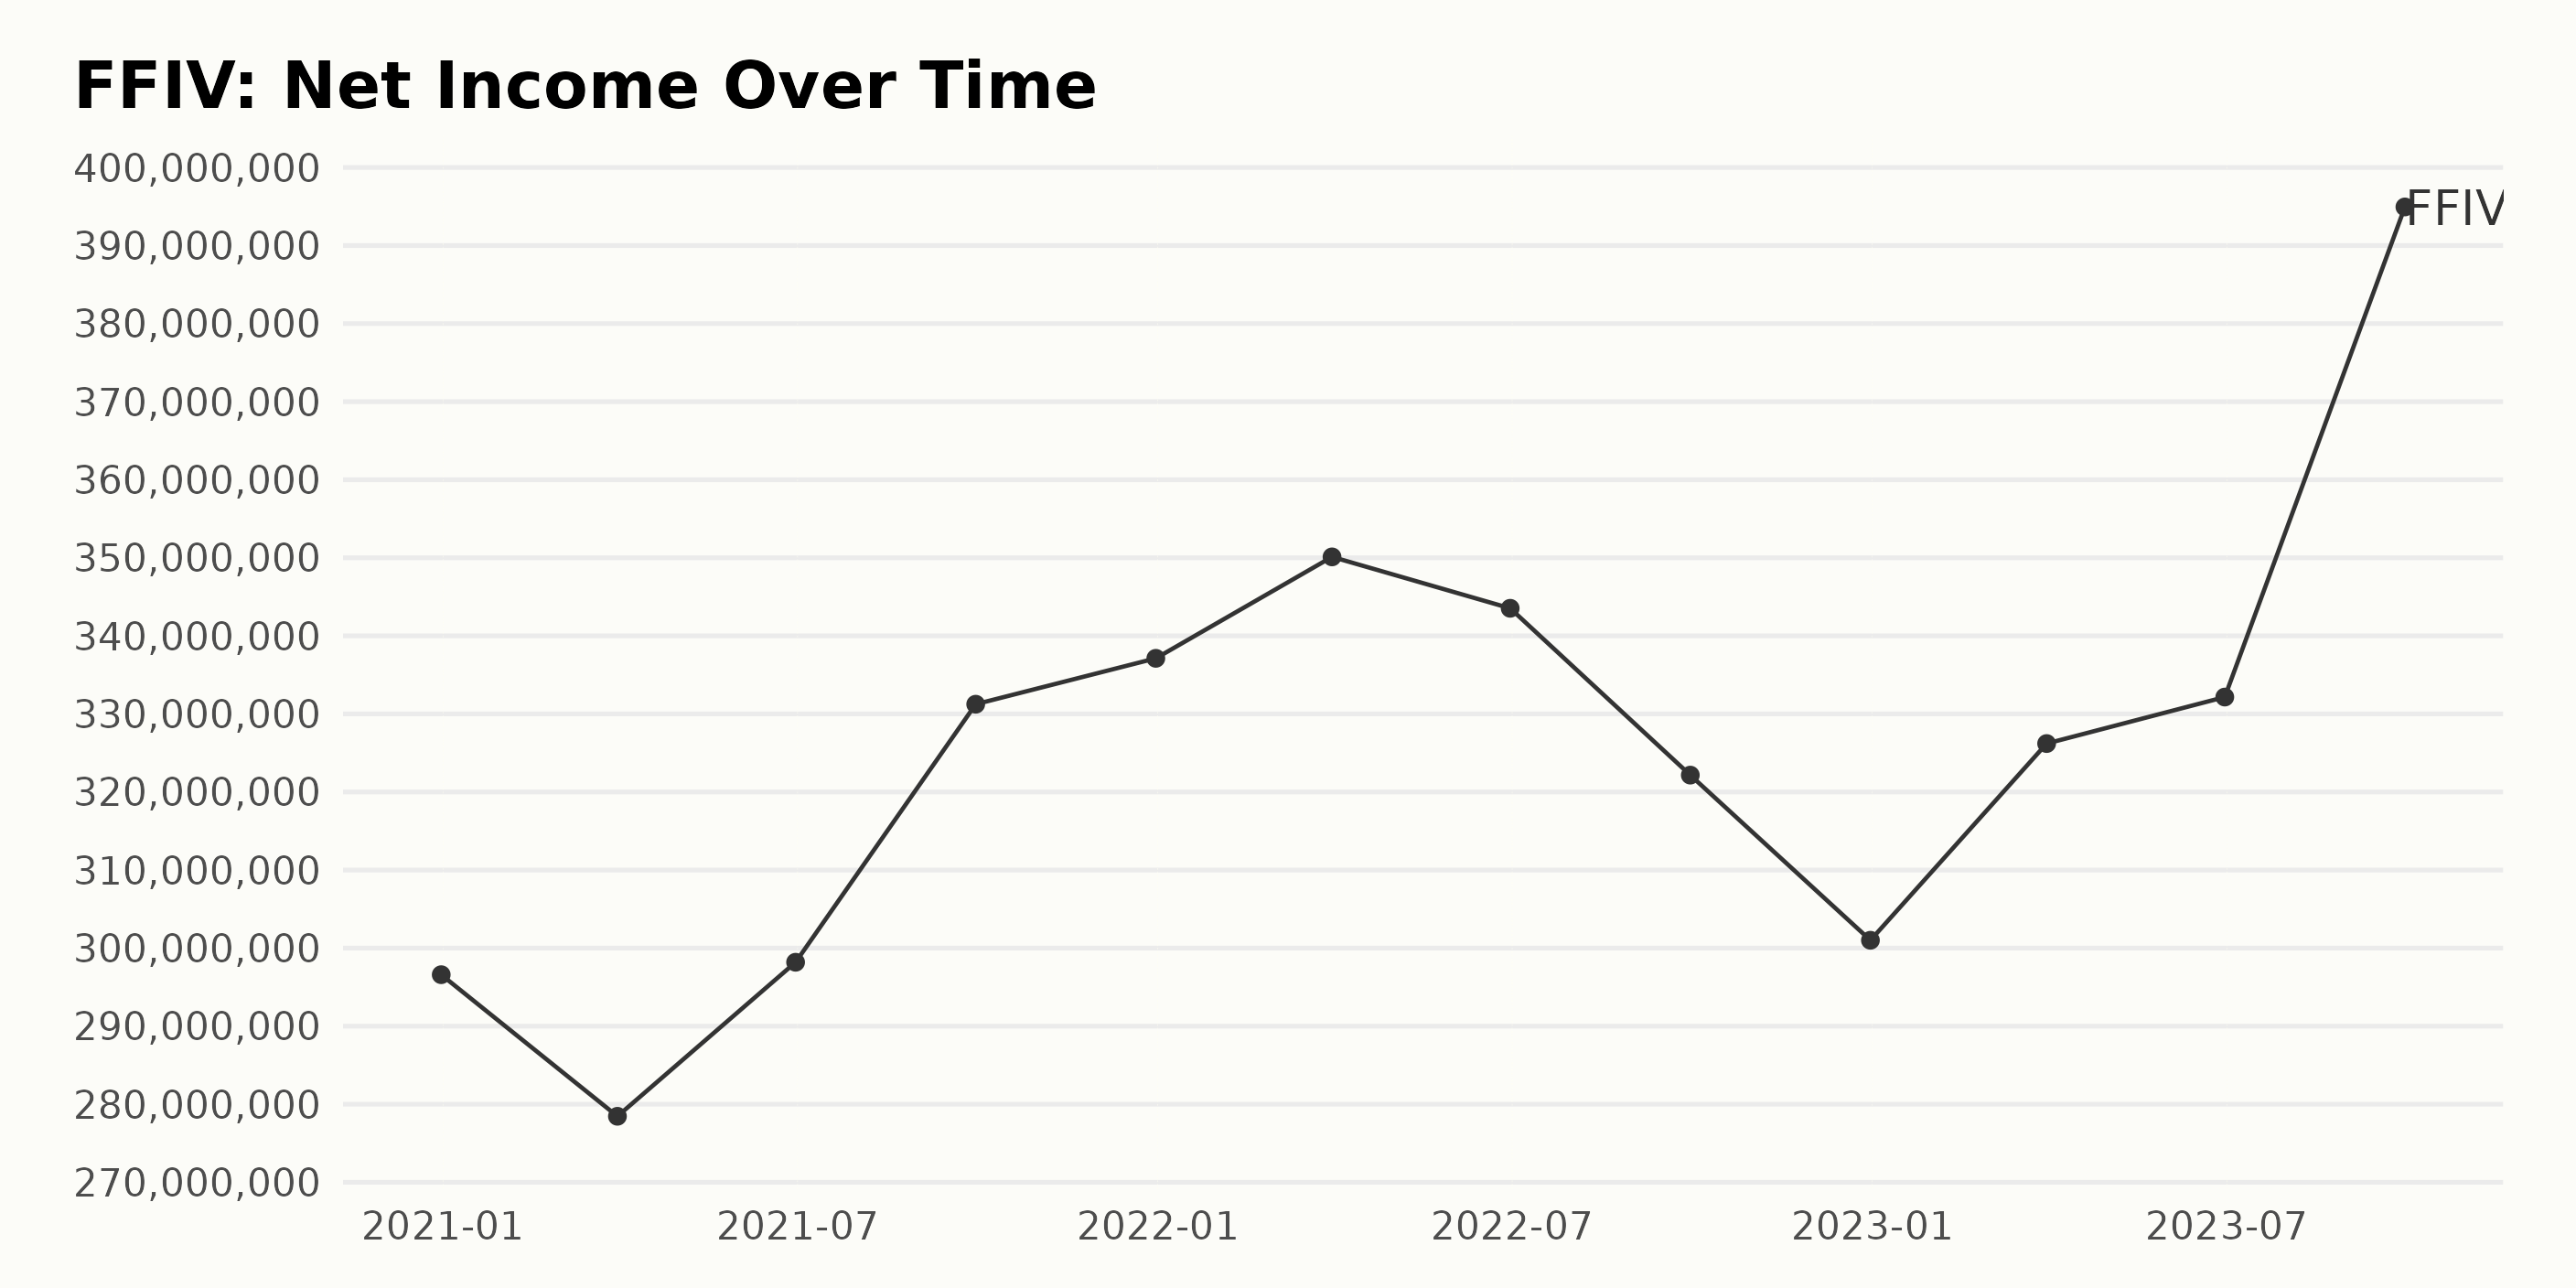
The trailing-12-month net income of F5 Networks Inc. (FFIV) displays a trend of moderate fluctuation and occasional growth from 2020 to 2023.
- On December 31, 2020, the net income was $296.59 million.
- The first quarter of 2021 witnessed a slight decrease to $278.45 million by the end of March.
- This was followed by another rise in the second quarter to $298.19 million by June 30, 2021.
- There was a noticeable increase by the end of the third quarter, with a value of $331.24 million by September 30, 2021.
By the end of 2021, F5 Networks’ net income rose to $337.12 million on December 31. The company saw further growth into the next year, with net income reaching its peak of $350.12 million in March 2022, but this growth was not sustained.
- There was a small decrease to $343.53 million by June 2022, followed by a more significant drop to $322.16 million by the end of September 2022.
- By the end of 2022, the company’s net income had further decreased to $301 million by December 31.
- However, the beginning of 2023 showed signs of recovery, with an increase to $326.2 million by March.
- There was continued growth, with F5 Networks having a reported net income of $332.16 million by the end of June.
Further, there was a significant bounce back, with the net income jumping to $394.95 million by September 30 – this was the highest figure in the reported period. Overall, the F5 Networks advanced from a net income of $296.59 million at the beginning of the series to $394.95 million by the end, indicating a percentage growth rate of approximately 33.17% over this period.
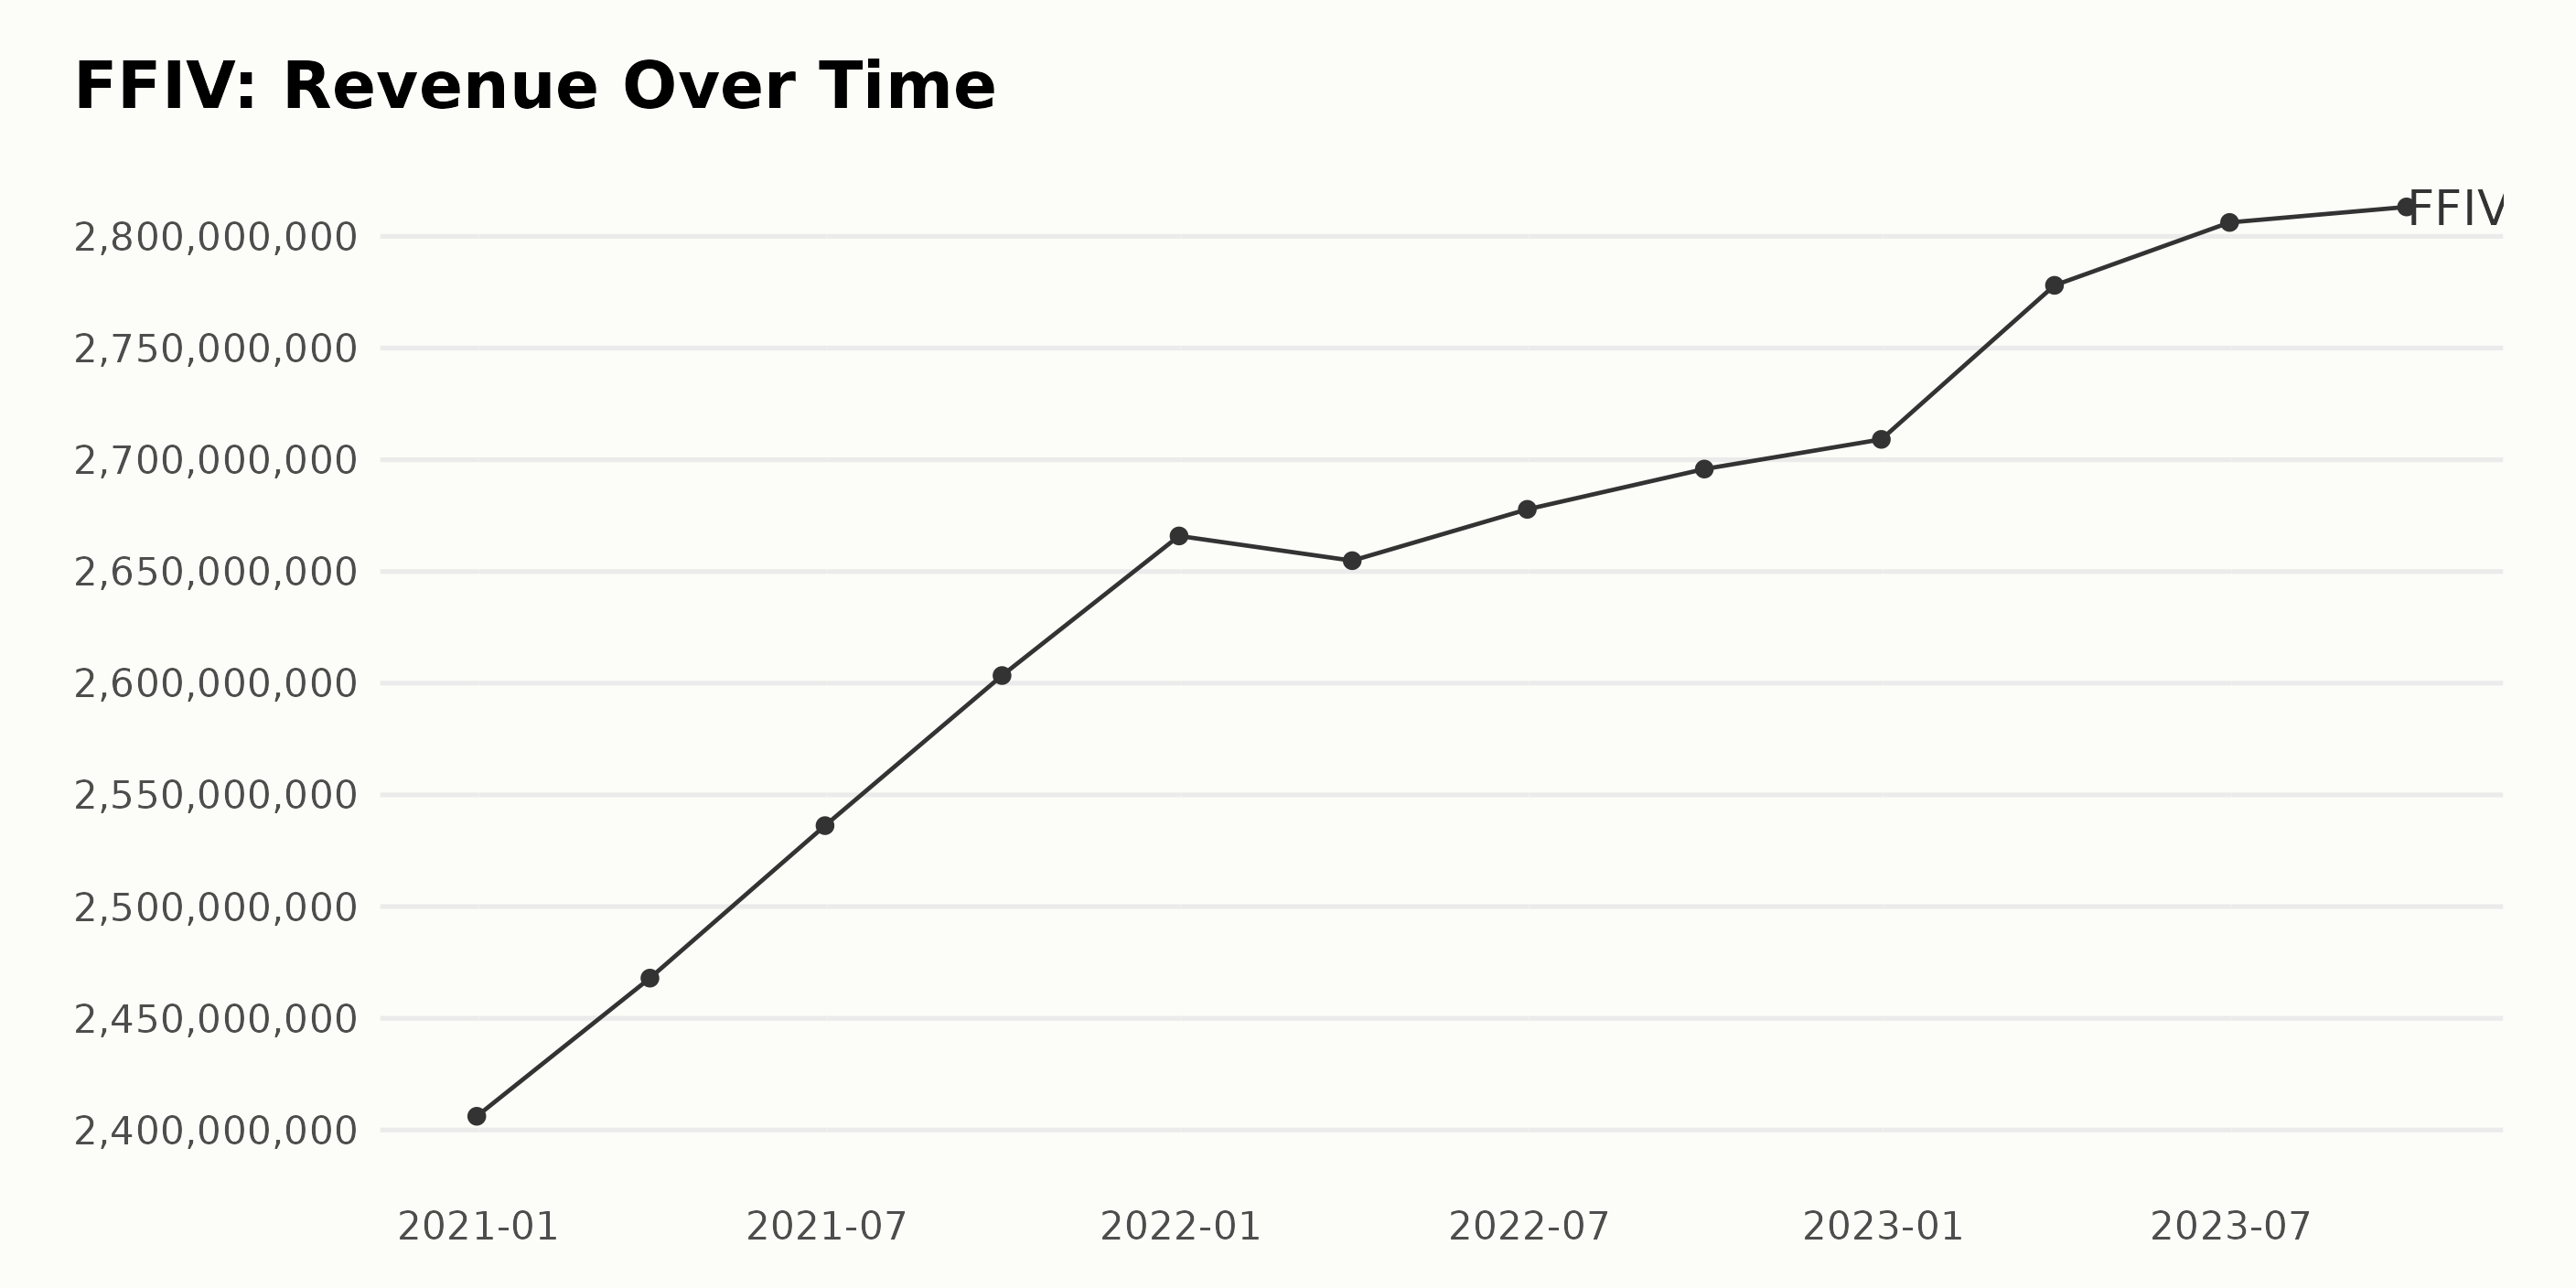
The trailing-12-month revenue of F5 Networks Inc. (FFIV) has seen a steady upward trend with occasional fluctuations over the given period.
- On December 31, 2020, the Revenue was $2.41 billion.
- The first quarter of 2021 saw an increase to $2.47 billion as of March 31, 2021.
- By the end of the second quarter of 2021, the Revenue had grown to $2.54 billion as of June 30, 2021.
- There seems to be regular quarterly growth, with the Revenue reported at $2.6 billion by September 30, 2021.
- For the year-end on December 31, 2022, the Revenue was $2.71 billion. This marked a slight increase from the $2.7 billion reported in September 2022.
- However, it’s worth mentioning that there was a minor dip in Revenue in the first quarter of the year (to $2.65 billion on March 31, 2022) before rebounding back up slightly mid-year.
- The trend continued to rise into 2023, with the company reporting revenues of $2.78 billion (March), $2.81 billion (June), and $2.81 billion (September), respectively.
The growth rate as measured from the first value ($2.41 billion as of December 2020) to the last ($2.81 billion as of September 2023) indicates an upward trend of approximately 16.6% for F5 Networks Inc. Revenue in the given period. This suggests a stable, though not necessarily rapid, growth scenario for the firm. Despite this, the emphasis should be given to more recent data, such as the slight stagnation of Revenue at $2.81 billion between June and September 2023. While the reasons for this are not within the data provided, such details could inform the company strategizing for future Revenue growth.
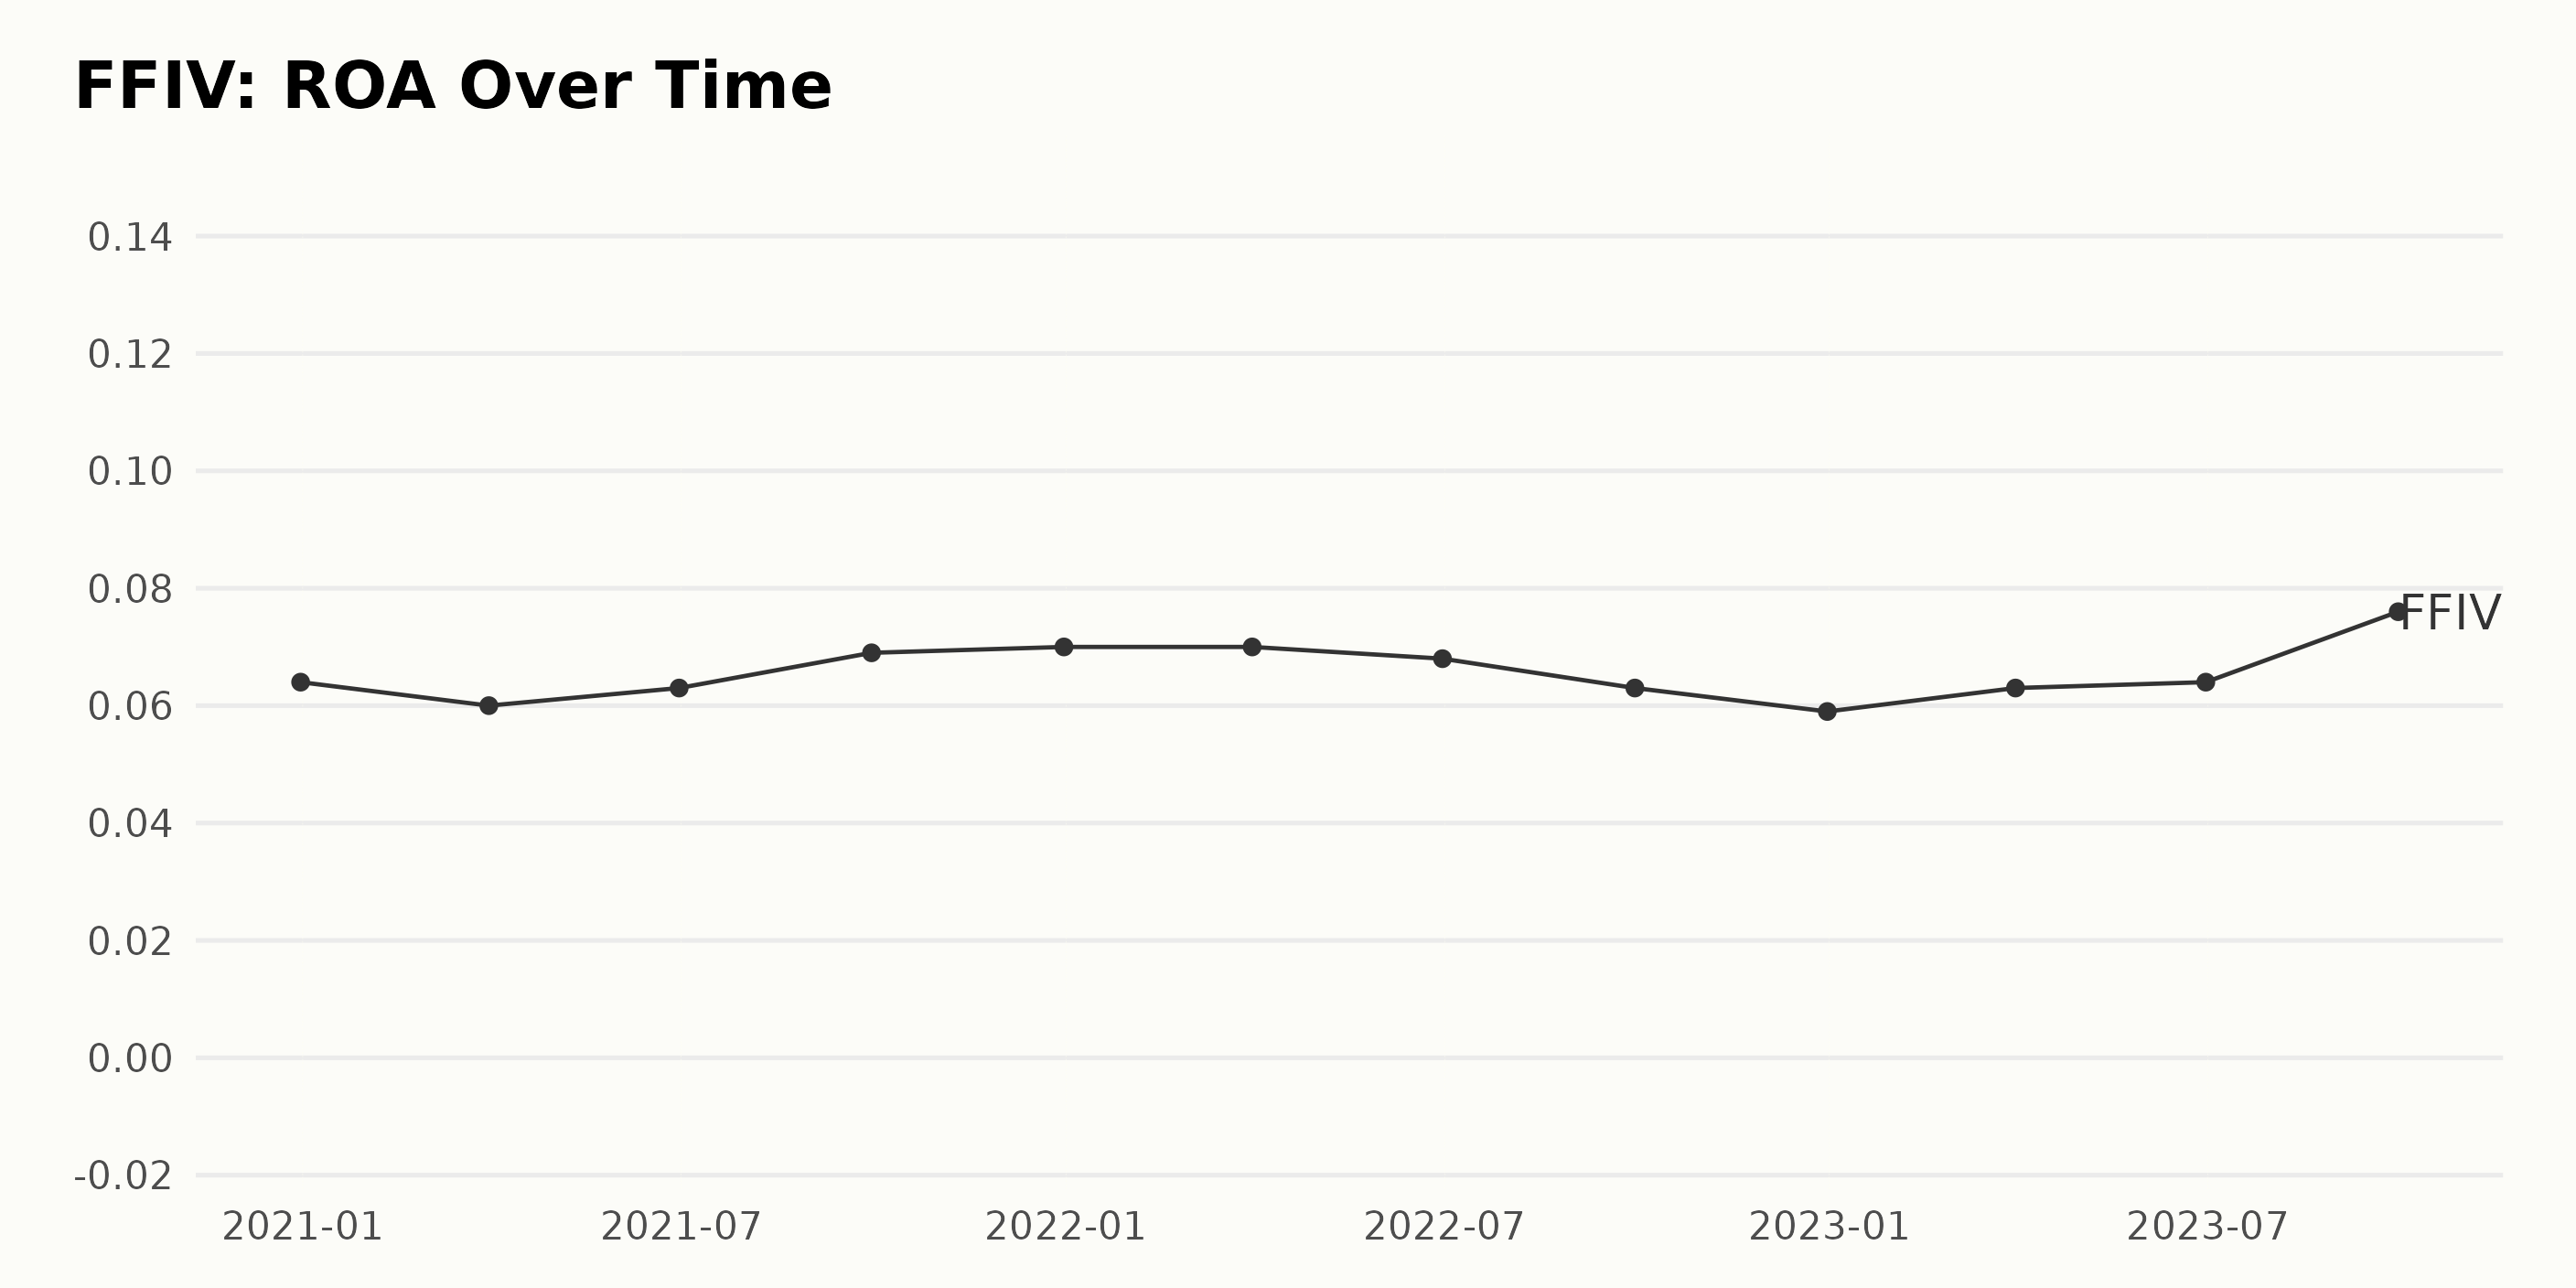
The ROA (Return on Assets) of F5 Networks Inc. (FFIV) has experienced some fluctuations over the period from December 2020 to September 2023 based on the provided data series.
- In December 2020, the ROA started at a figure of 6.4%.
- The lowest reported value occurred in December 2022, at 5.9%.
- The highest reached value was observed in September 2023, with a ROA of 7.6%, marking a growth by approximately 19% from the first value in December 2020.
- A noticeable trend is that the ROA appears to have minor dips in about every three quarters before bouncing back and exceeding previous peaks. This pattern can be seen in June 2021, March and December 2022, and finally, September 2023.
- In terms of recent values, since the significant dip in December 2022 (5.9%), the ROA recovered and increased moderately. As of September 2023, the ROA reached 7.6%, surpassing all previous values within this period.
Please note that these points represent broad trends and can change with the addition of new data or adjustments to existing figures.
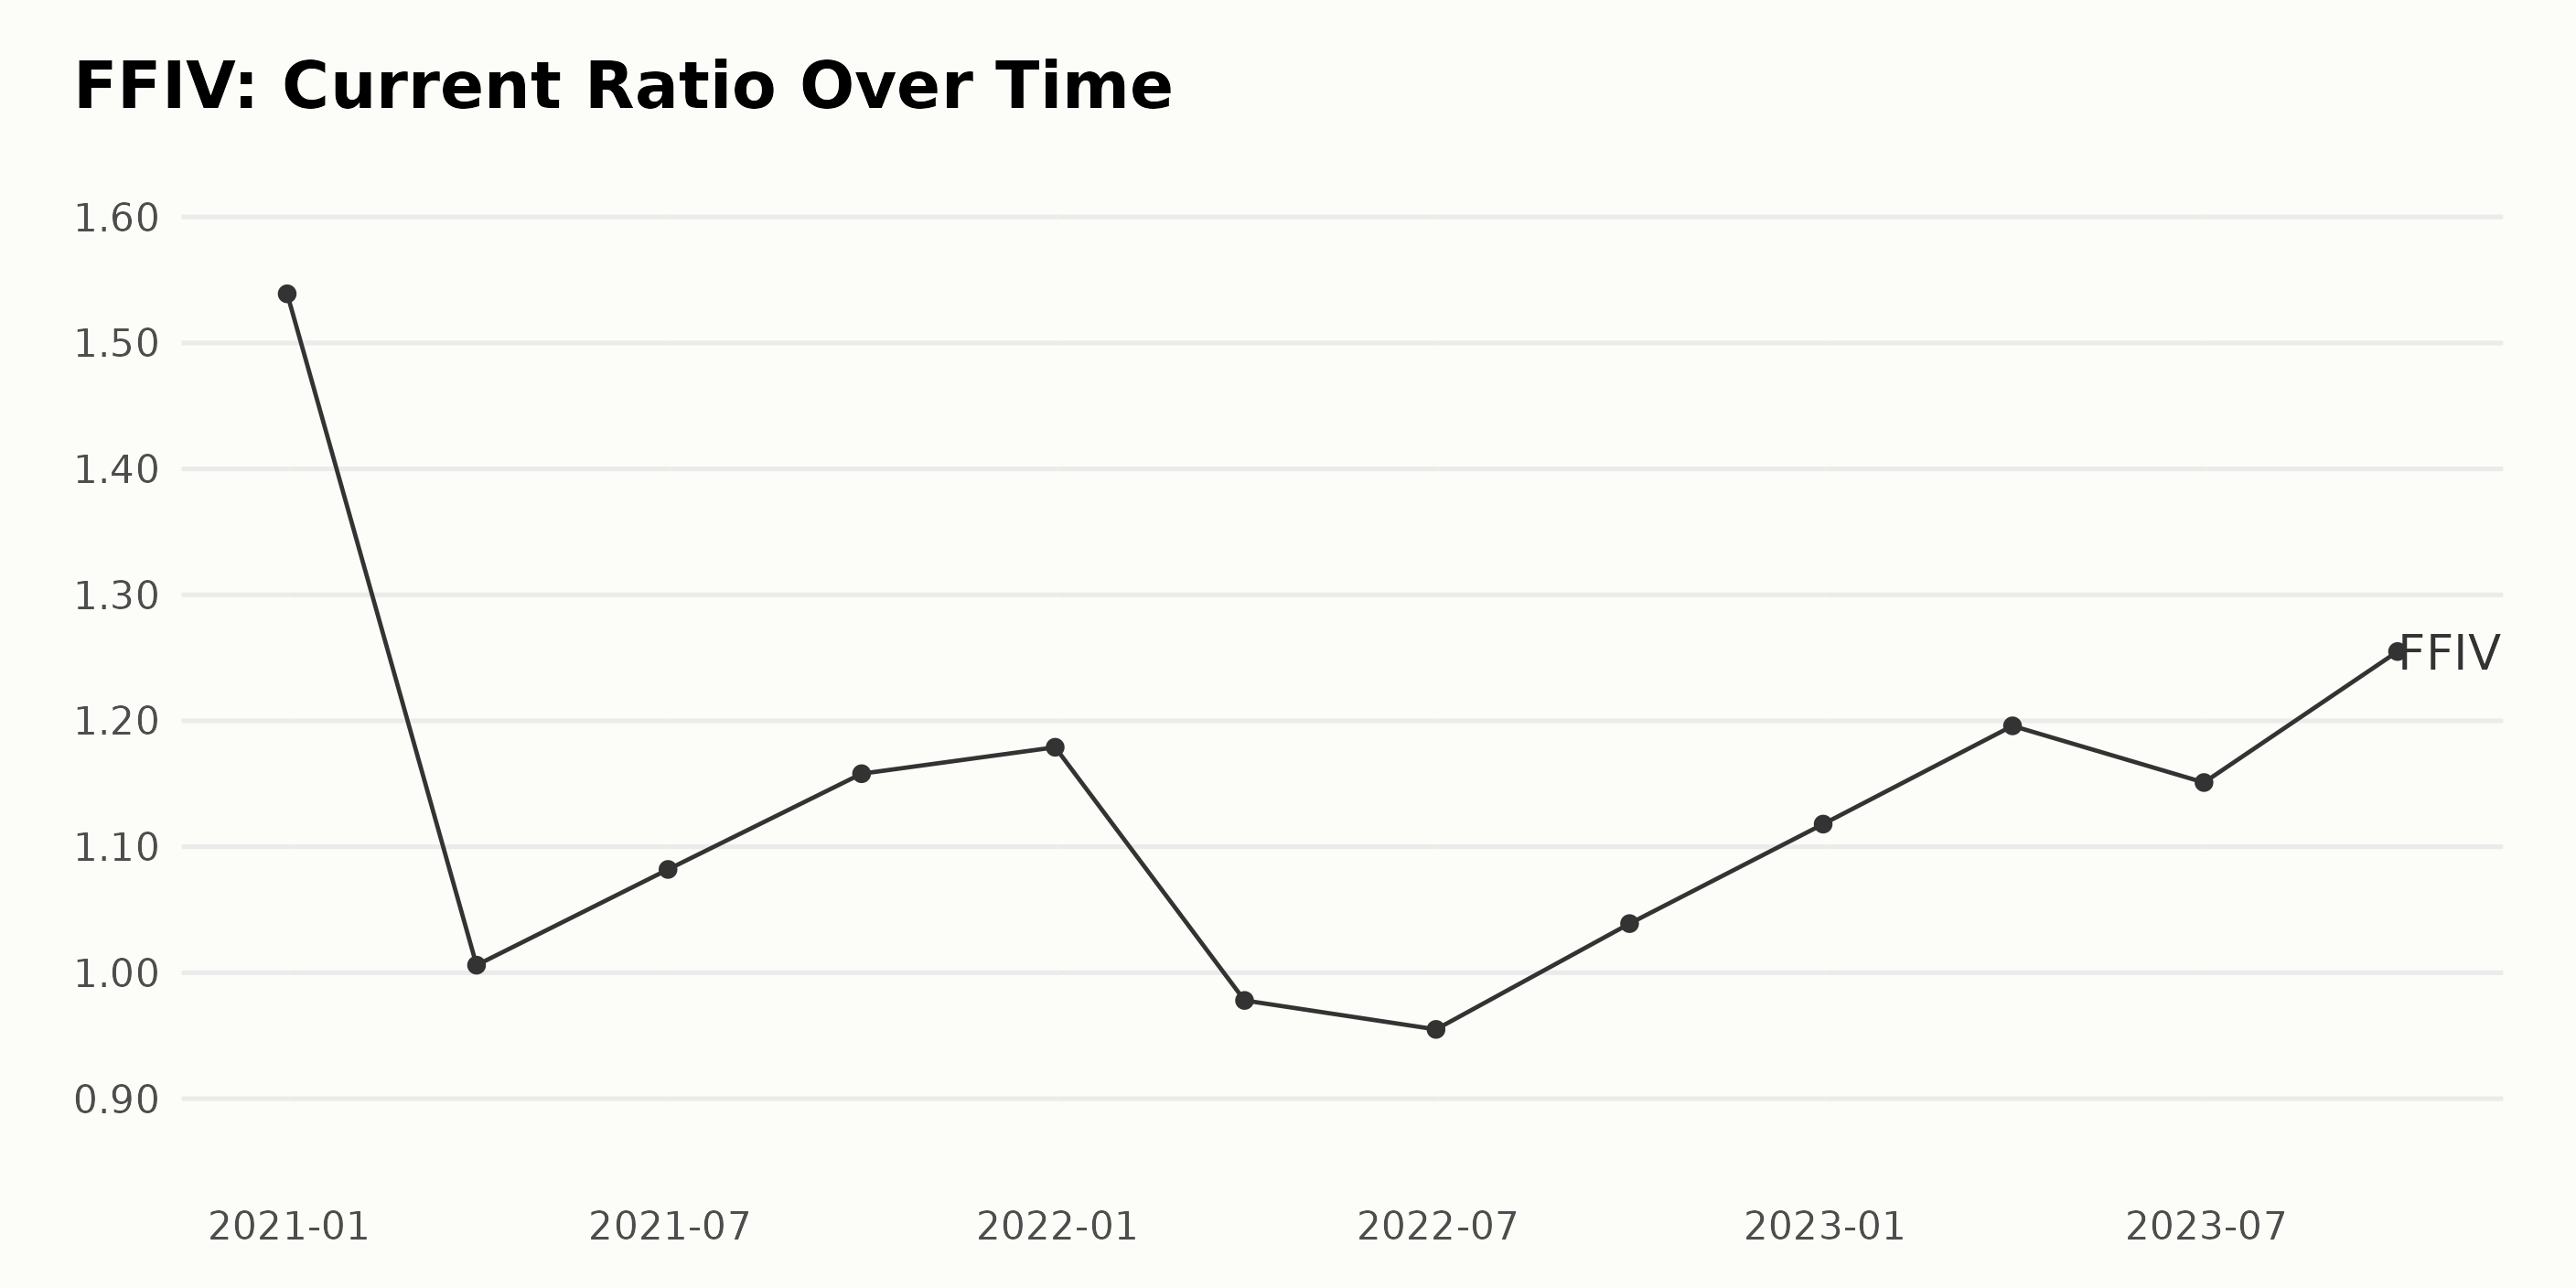
The data series shows the Current Ratio of F5 Networks Inc. (FFIV) over several periods from the end of 2020 to the third quarter of 2023. Here is a summary of notable trends and fluctuations:
- The Current Ratio of F5 Networks Inc. began at 1.54 in December 2020.
- There was a noticeable drop in the first quarter of 2021 to 1.01, after which the Current Ratio gradually increased, reaching a value of 1.18 by the end of 2021.
- In the first quarter of 2022, the Current Ratio slightly dipped to 0.98 before reducing further to its lowest point of 0.95 in the second quarter.
- However, this downturn was short-lived as it quickly rebounded and grew consistently in subsequent quarters, hitting 1.04, 1.12, and then peaking to a high of 1.20 by the first quarter of 2023.
- In the second quarter of 2023, the ratio experienced a slight decline to 1.15 yet surged back to its highest value in the series at 1.26 by the end of the third quarter.
Overall, there has been a general increase in the Current Ratio of F5 Networks from the first captured data point to the most recent one, despite a few intermittent drops. The growth rate from December 2020 to September 2023, calculated by measuring the last value from the first, stands at approximately -19%. Emphasizing more recent data, the last value in the series as of September 2023 is 1.255, showing that F5 Networks has a slightly over 1:1 ratio of current assets to current liabilities.
Analyzing F5 Networks’ Share Prices: A Five-Month Upward Trend from June to November 2023
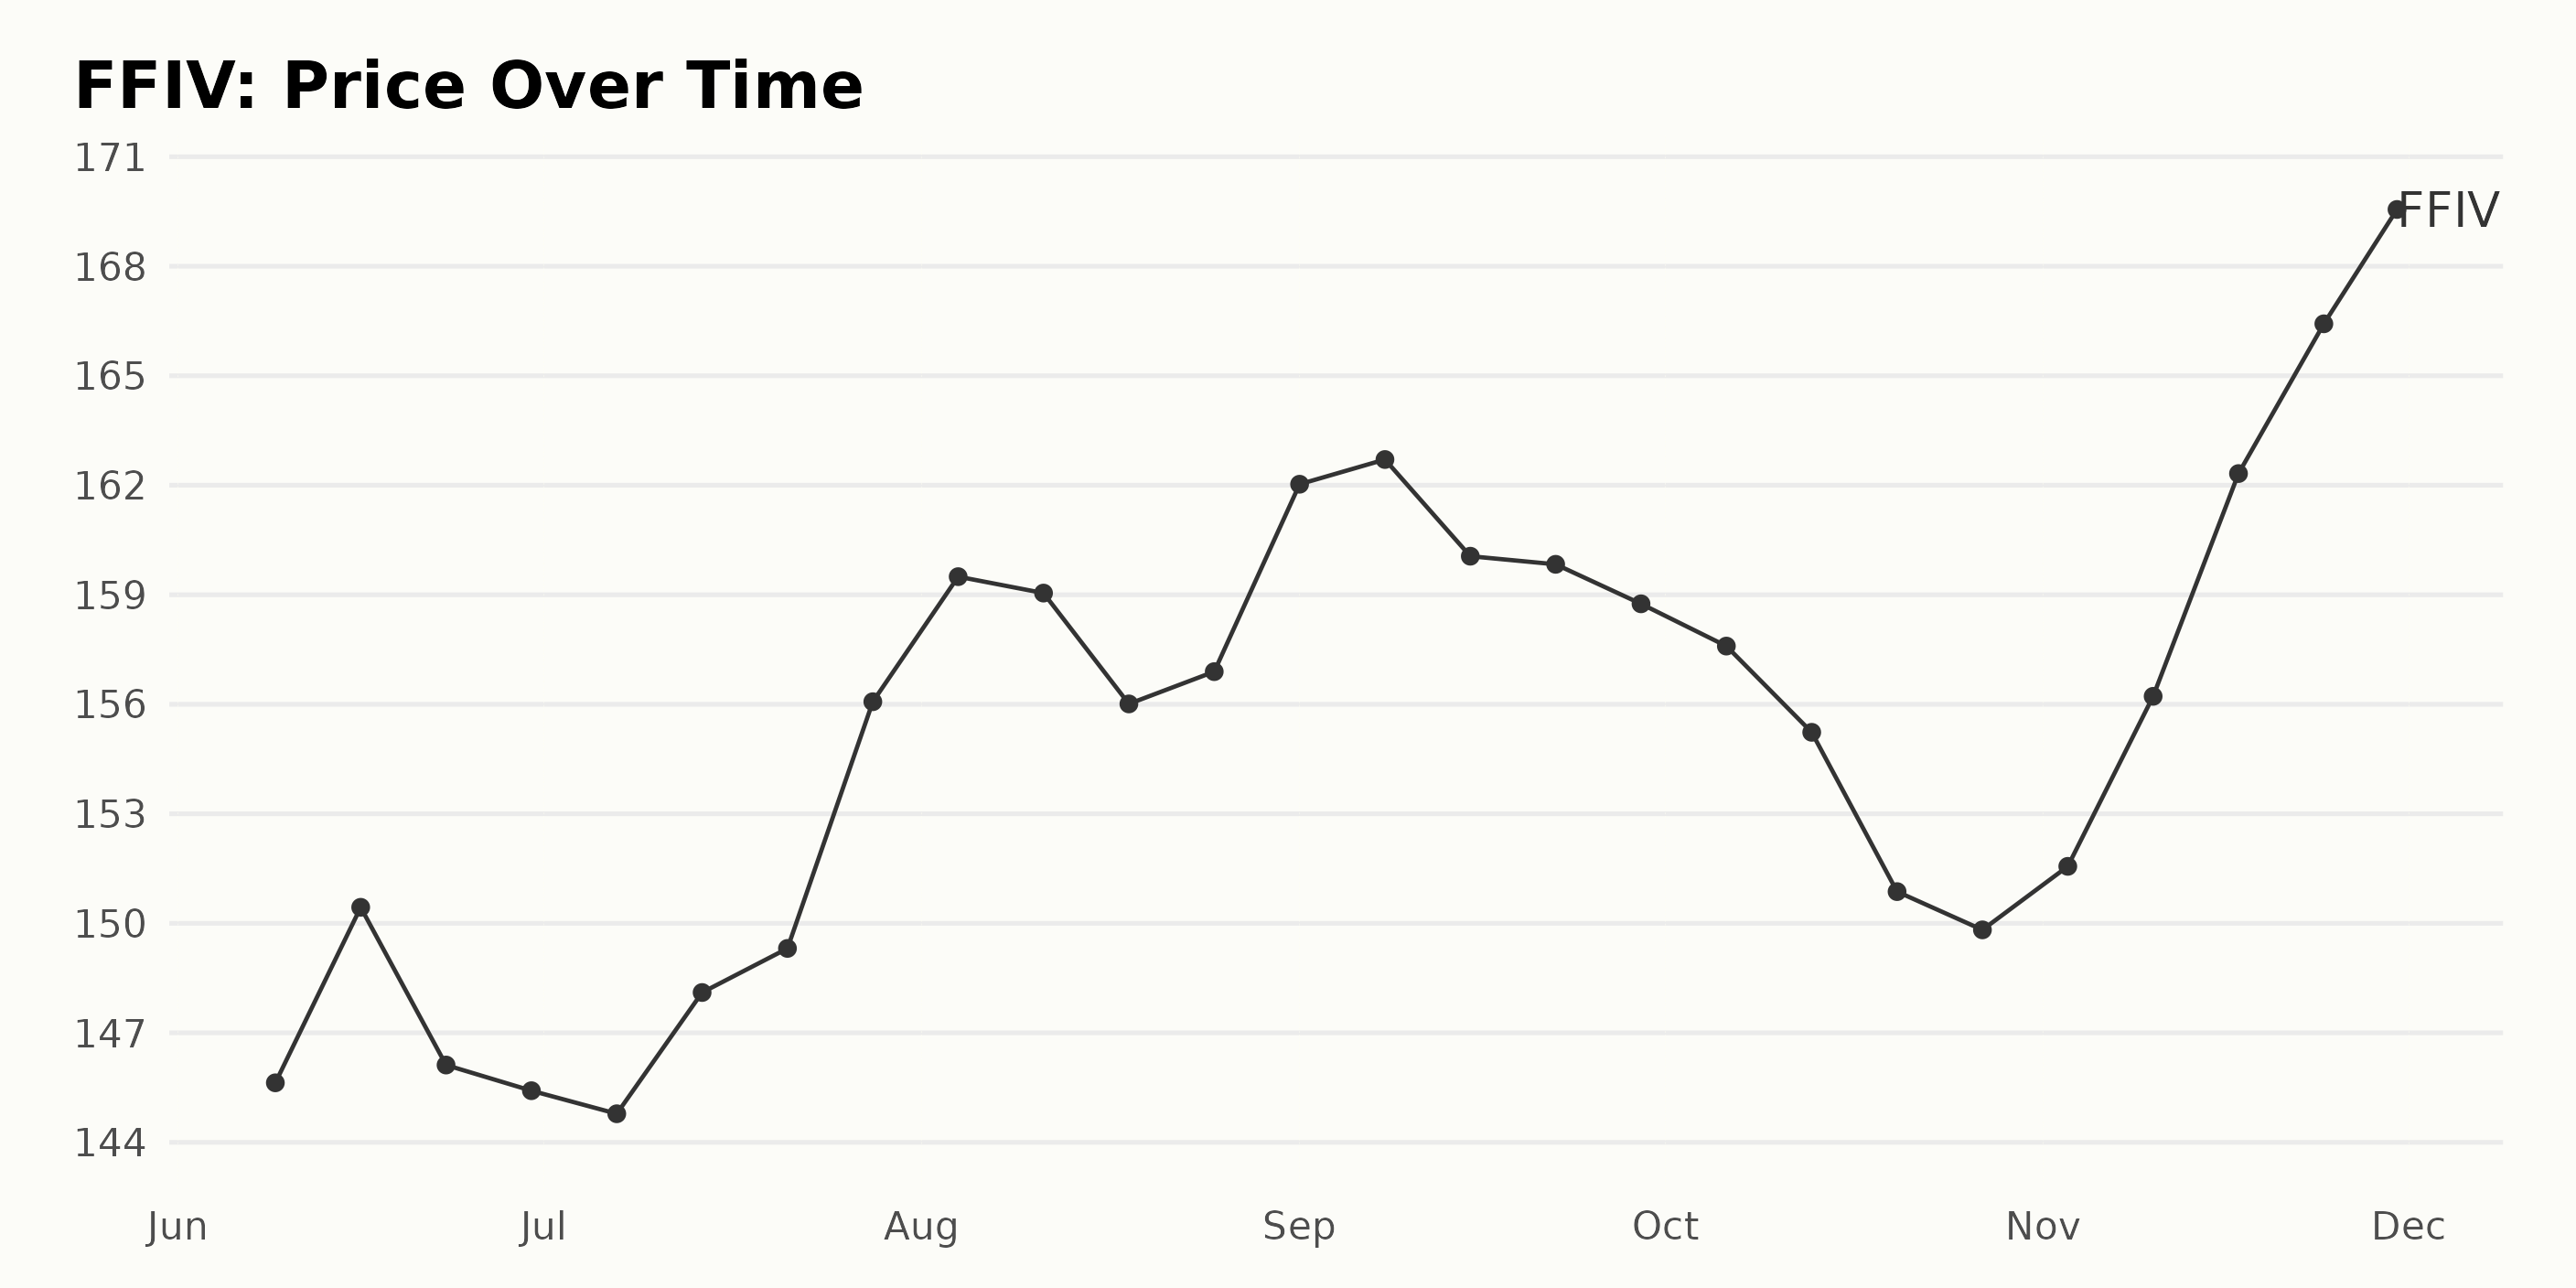
The data shows the weekly trend of share prices for F5 Networks Inc. (FFIV) from June 2023 to November 2023.
- On June 9, 2023, the share price was $145.63.
- It experienced a slight increase, peaking at $150.44 on June 16, but then generally about $146 through the end of June.
- In July, the price dipped to as low as $144.78 (July 7), but ended strongly at $156.07 by July 28.
- Prices in August peaked at $159.50 (August 4) then oscillated around $156 for the rest of the month.
- September saw a small increase, starting at $162.03 (September 1) and nearly maintaining that level throughout the month.
- Starting October, a gradual decline is noticeable, starting at $157.59 (October 6) all the way down to $149.82 by the end of the month.
- In November, a significant upward trend can be observed, with prices rising from $151.56 (November 3) to $169.56 (November 30).
In general, though there are variances, there seems to be an overall upward trend in the share prices of FFIV over these five months. Initial price in June ($145.63) compared to the final price in November ($169.56), indicates a growth rate of approximately 16.45%, which suggest that the company’s share prices are gaining value. Please note that such trends do not guarantee future performances and should be considered alongside other market indicators. Here is a chart of FFIV’s price over the past 180 days.
Analyzing Key POWR Rating Trends for F5 Networks Inc. in 2023
FFIV has an overall A rating, translating to a Strong Buy in our POWR Ratings system. It is ranked #1 out of the 44 stocks in the Software – Business category.
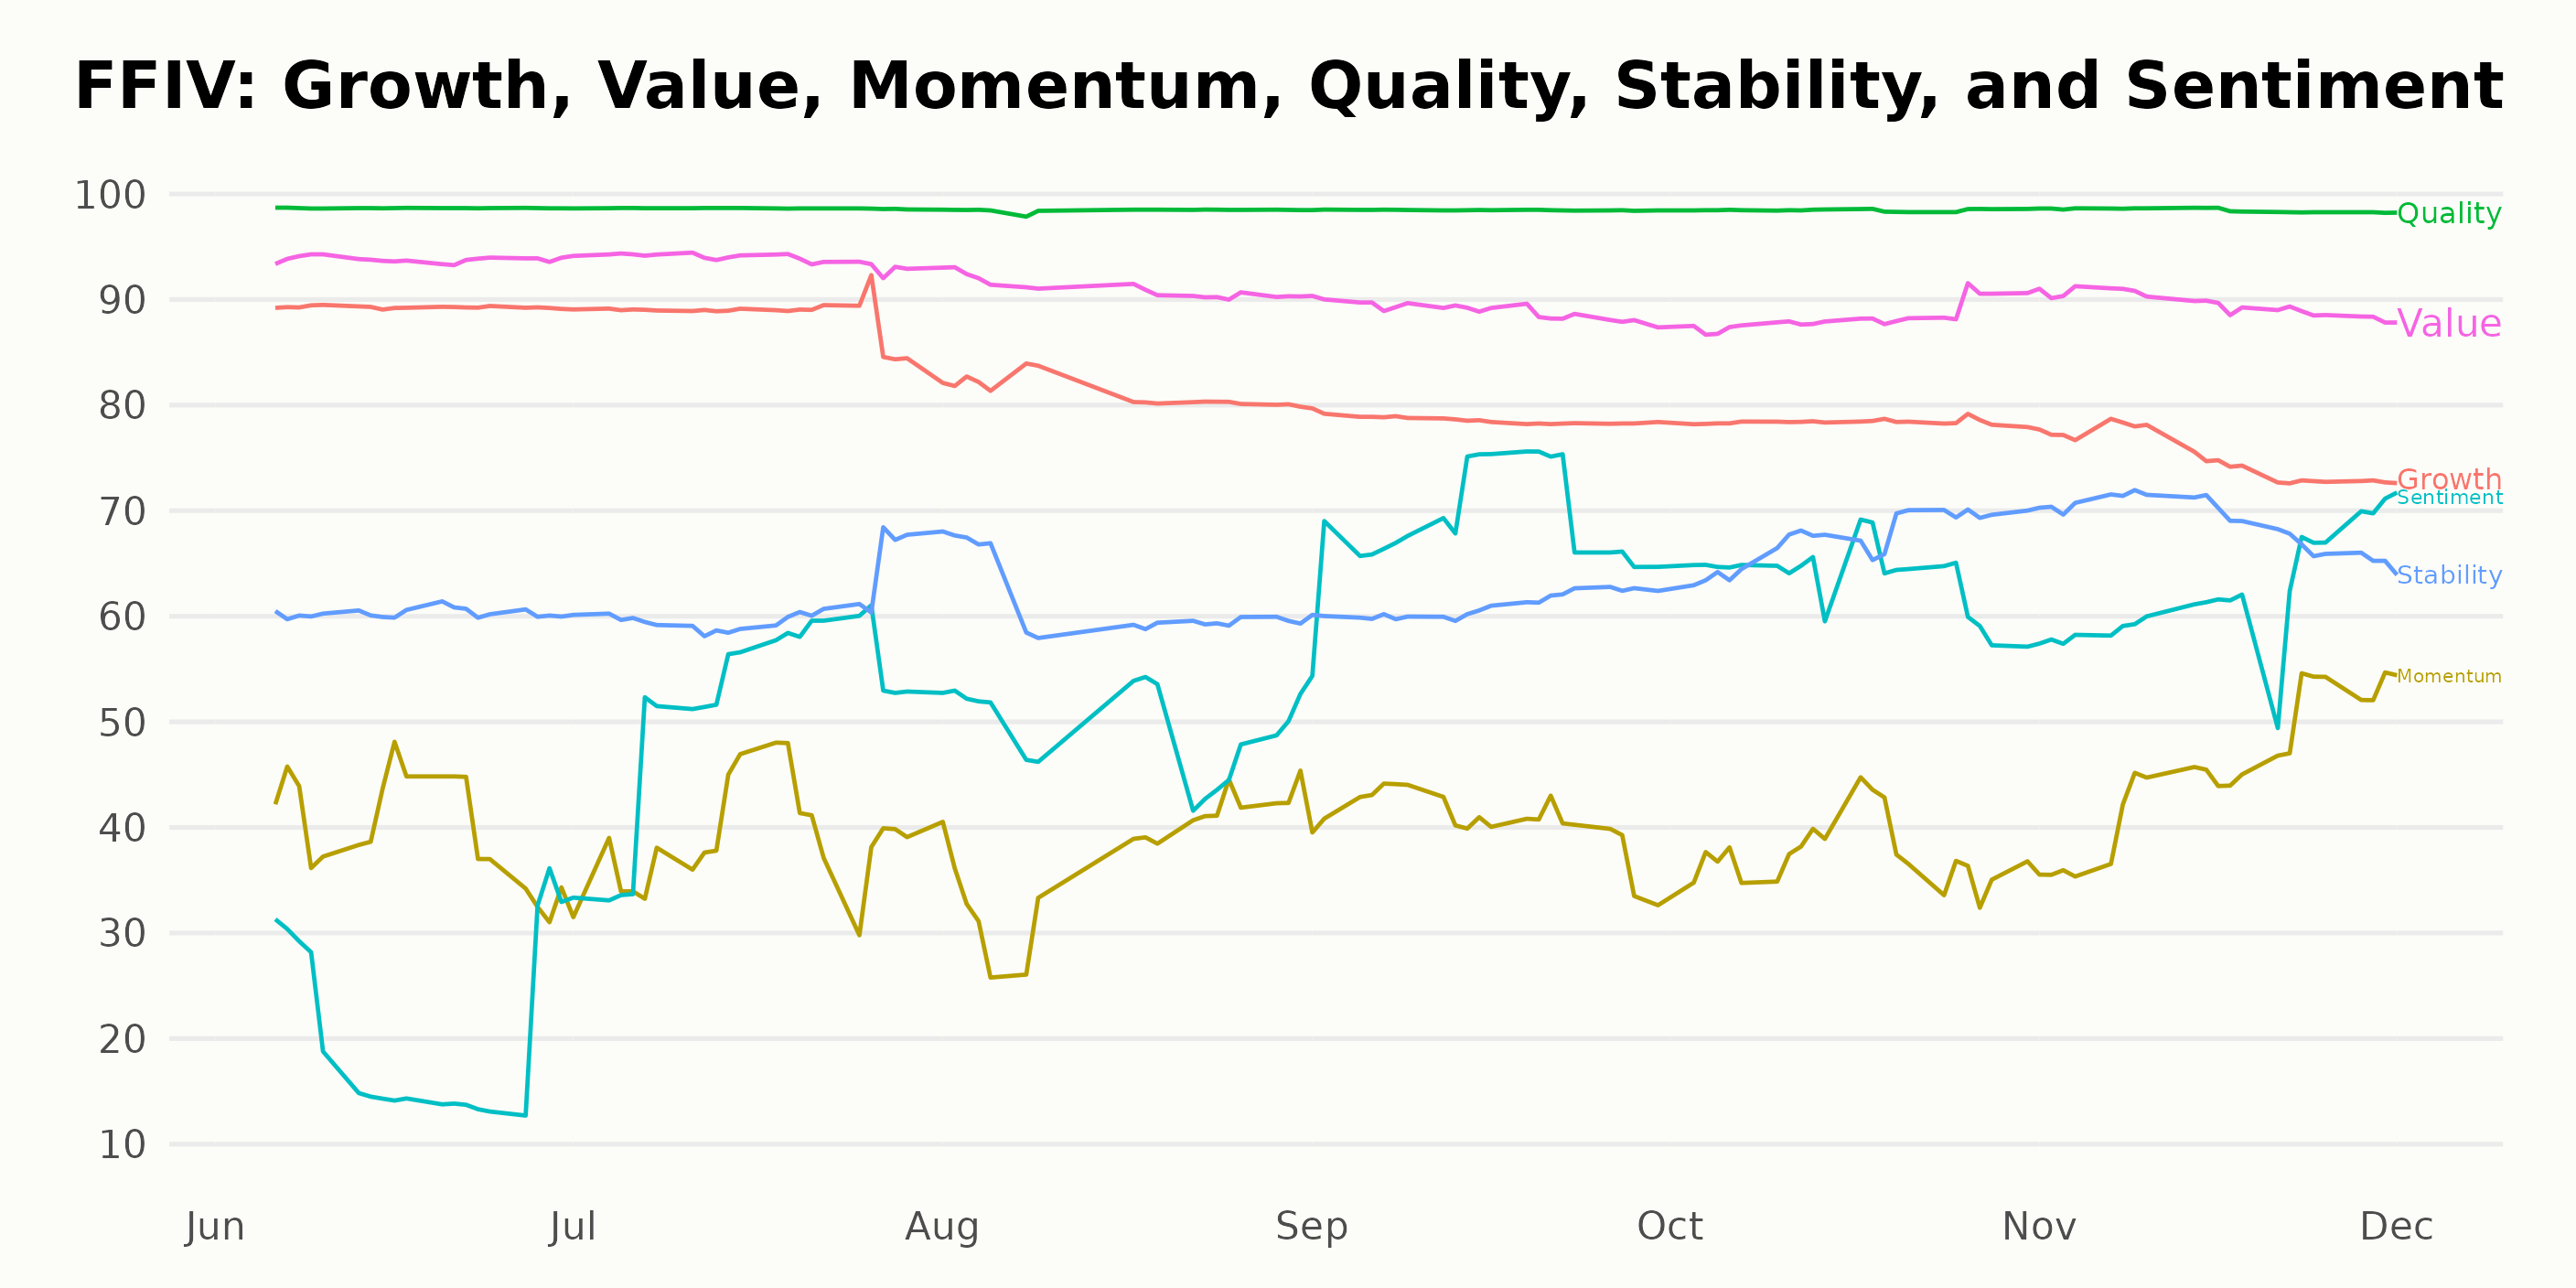
The POWR Ratings for F5 Networks Inc. (FFIV) spans along six dimensions, however, upon careful scrutiny of the trends and numbers, the three most noteworthy dimensions are Quality, Value, and Growth.
Quality: This dimension consistently leads the rating chart with the highest ratings. The Quality of F5 Networks Inc. remains remarkably high from June to December 2023, starting at 99 in June and July but dropping slightly to 98 between August and December 2023.
Value: The Value dimension is the second-highest scoring category for F5 Networks Inc. It starts at 94 in June and July, drops to 91 in August, slips further to 89 in September, drops to 88 in October and essentially stays in the high 80s till December 2023.
Growth: The Growth dimension displays a clear decreasing trend over the course of the year. Starting from a preeminent position of 89 in June and July 2023, it decreases consistently nearly every month, moving from 81 in August, to 79 in September, 78 in October, 75 in November, ending at 73 in December 2023.
These values reflect the likely significant aspects to keep in mind for potential investors and stakeholders in F5 Networks Inc.’s operations.
How does F5 Networks Inc. (FFIV) Stack Up Against its Peers?
Other stocks in the Software – Business sector that may be worth considering are Sapiens International Corporation N.V. (SPNS), SolarWinds, Inc. (SWI), and Yext Inc. (YEXT) — they have better POWR Ratings.
What To Do Next?
43 year investment veteran, Steve Reitmeister, has just released his 2024 market outlook along with trading plan and top 11 picks for the year ahead.
Want More Great Investing Ideas?
FFIV shares were trading at $171.22 per share on Friday afternoon, up $0.03 (+0.02%). Year-to-date, FFIV has gained 19.31%, versus a 21.29% rise in the benchmark S&P 500 index during the same period.
About the Author: Subhasree Kar

Subhasree’s keen interest in financial instruments led her to pursue a career as an investment analyst. After earning a Master’s degree in Economics, she gained knowledge of equity research and portfolio management at Finlatics. More...
More Resources for the Stocks in this Article
| Ticker | POWR Rating | Industry Rank | Rank in Industry |
| FFIV | Get Rating | Get Rating | Get Rating |
| SPNS | Get Rating | Get Rating | Get Rating |
| SWI | Get Rating | Get Rating | Get Rating |
| YEXT | Get Rating | Get Rating | Get Rating |


