
ServiceNow, Inc. (NOW) is experiencing substantial growth due to the rising adoption of cloud computing solutions and digital transformation across various industries. The company surpassed its first quarter 2023 revenue and profitability guidance. It also raised its subscription revenue guidance for the year.
For the quarter ending March 31, 2023, subscription revenues reached $2.02 billion, a 24% increase from the same period last year. Additionally, NOW reported over 7,700 customers in the previous year, featuring 85% of the Fortune 500 companies.
Furthermore, NOW is committed to enhancing its artificial intelligence (AI) capabilities to stimulate business expansion. CEO Bill McDermott stated, “We are engineering even more intelligence into our Now platform with the power of generative A.I. to unleash the combination of machine speed and human judgement.”
In a recent collaboration, NOW partnered with leading chipmaker NVIDIA Corporation (NVDA) to develop advanced, enterprise-grade generative AI capabilities designed to transform business processes through faster, more intelligent workflow automation. The company also launched a new generative AI solution, Now Assist for Virtual Agent, to facilitate more intelligent self-service.
ServiceNow has demonstrated rapid progress in this intelligence-driven era. With its exceptional market reach and strategic position, the company appears well-prepared for sustained growth. As such, NOW presents an attractive investment opportunity.
Below are some of its key metrics that support my bullish stance on the stock.
Analyzing NOW’s Financial Performance: Net Income, Revenue, and Gross Margin
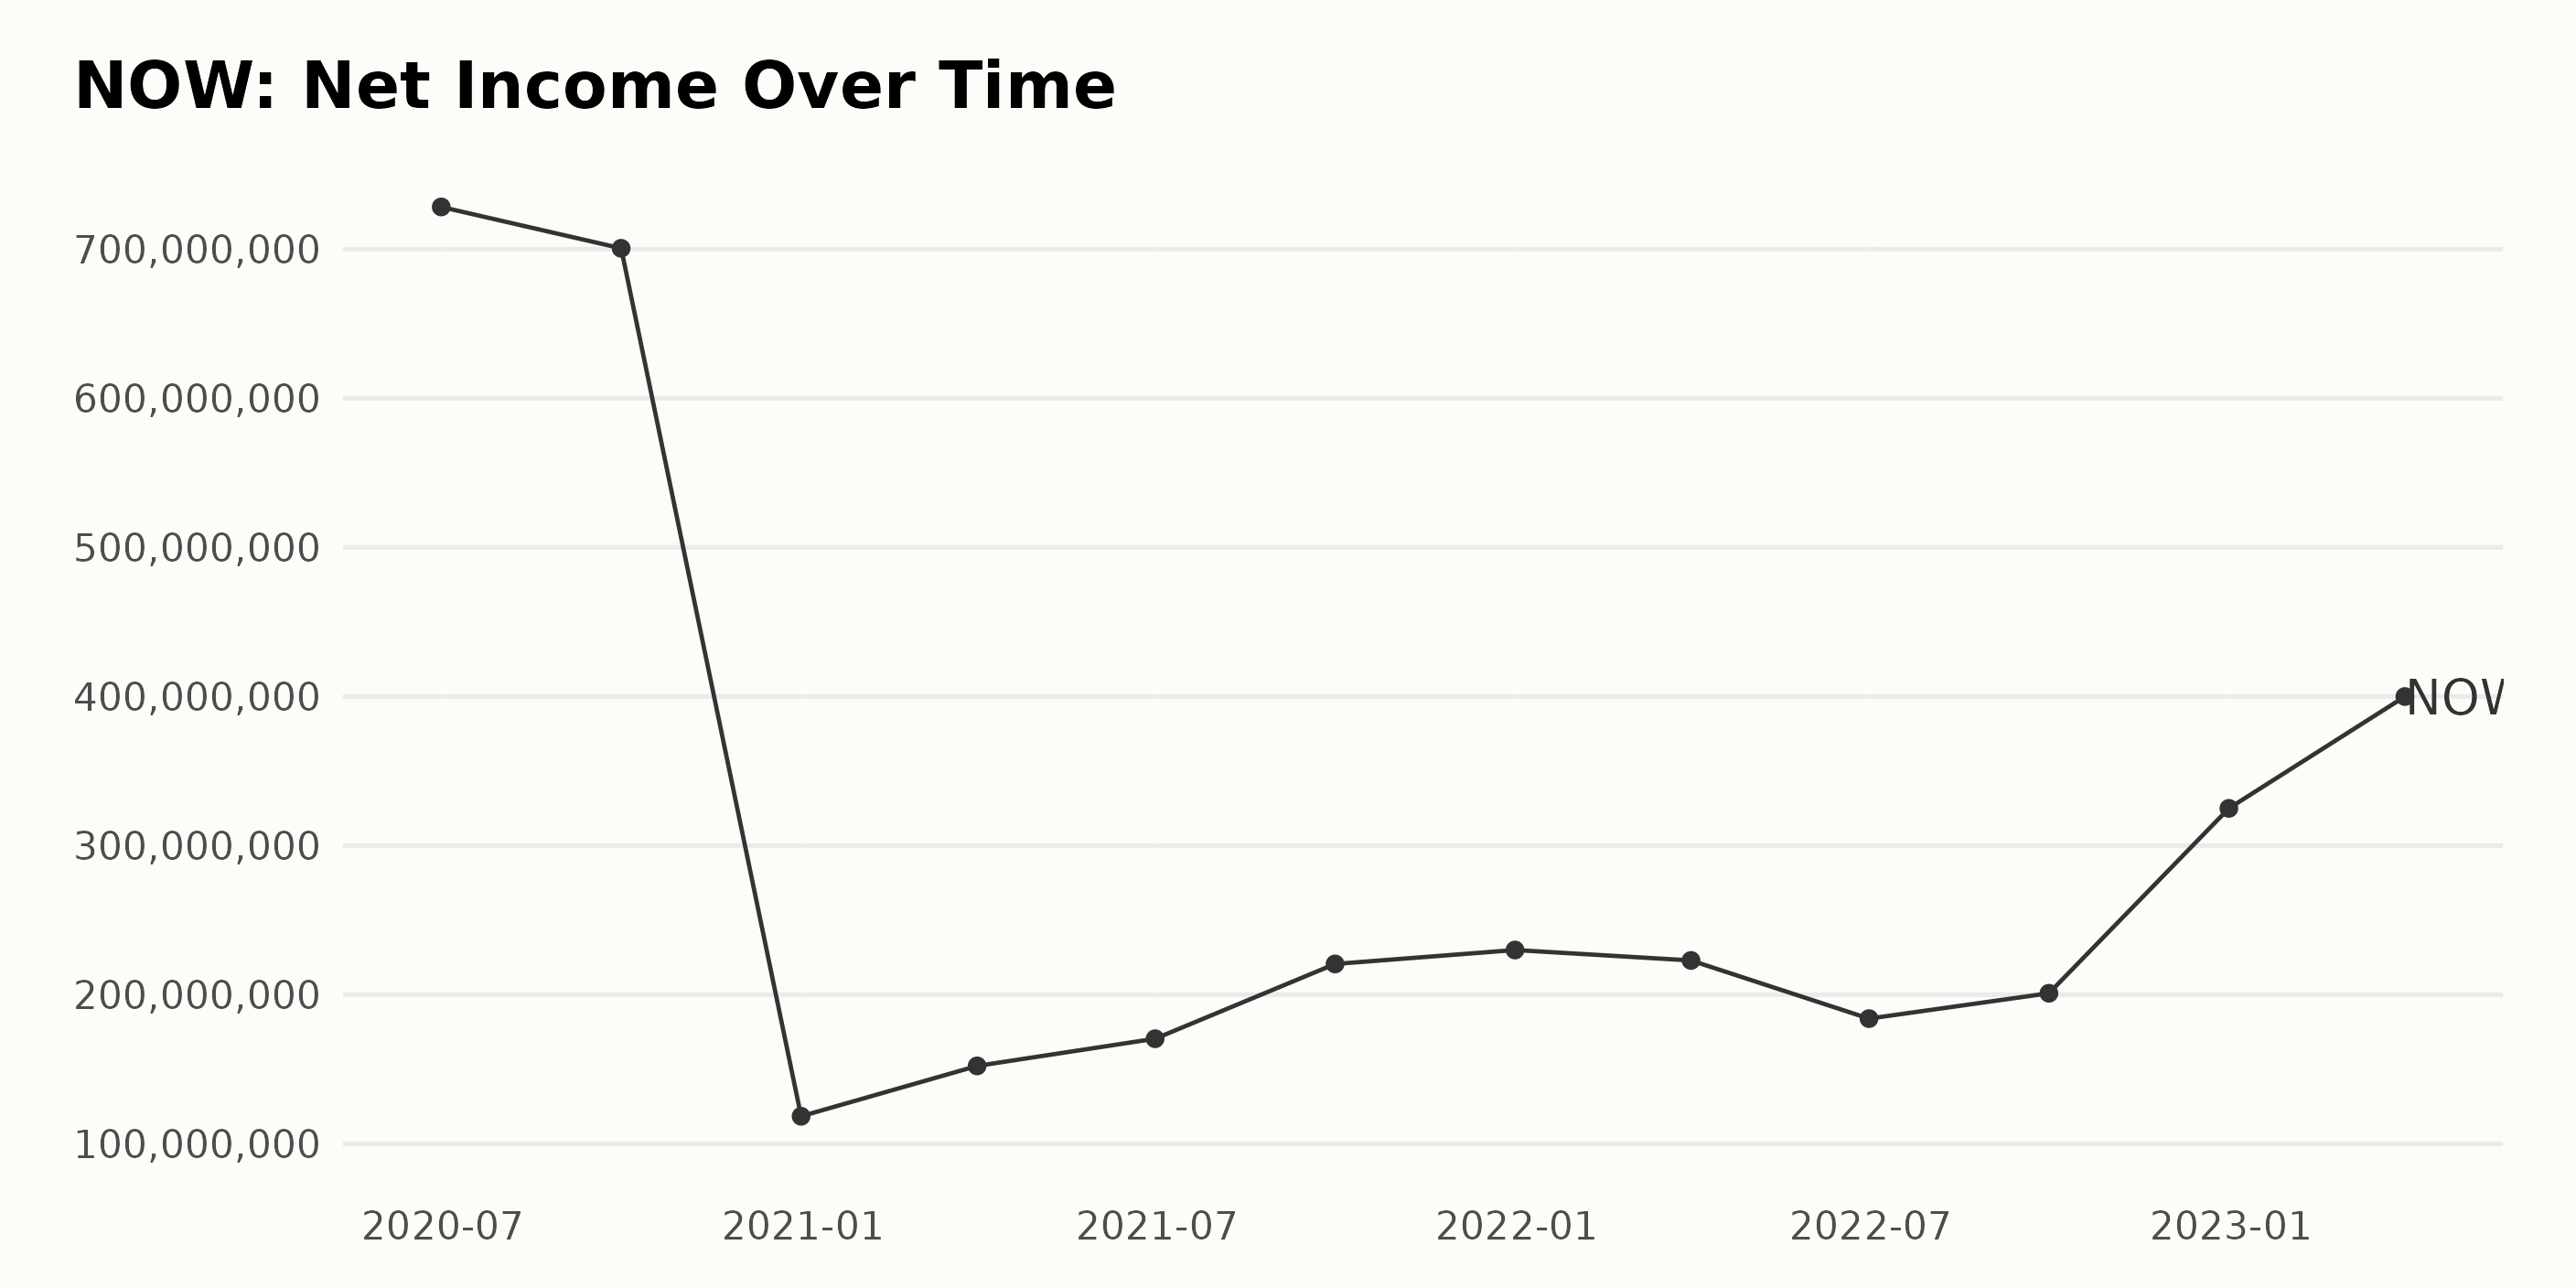
The trend and fluctuations in the trailing-12-month net income of NOW are summarized as follows:
- June 2020: $728.32 million
- September 2020: $700.58 million
- December 2020: $118.5 million
- March 2021: $152.27 million
- June 2021: $170.51 million
- September 2021: $220.65 million
- December 2021: $230 million
- March 2022: $223 million
- June 2022: $184 million
- September 2022: $201 million
- December 2022: $325 million
- March 2023: $400 million
Notably, there was a sharp drop in net income from September 2020 ($700.58 million) to December 2020 ($118.5 million). Net income gradually increased from March 2021 onward, peaking at $400 million in March 2023.
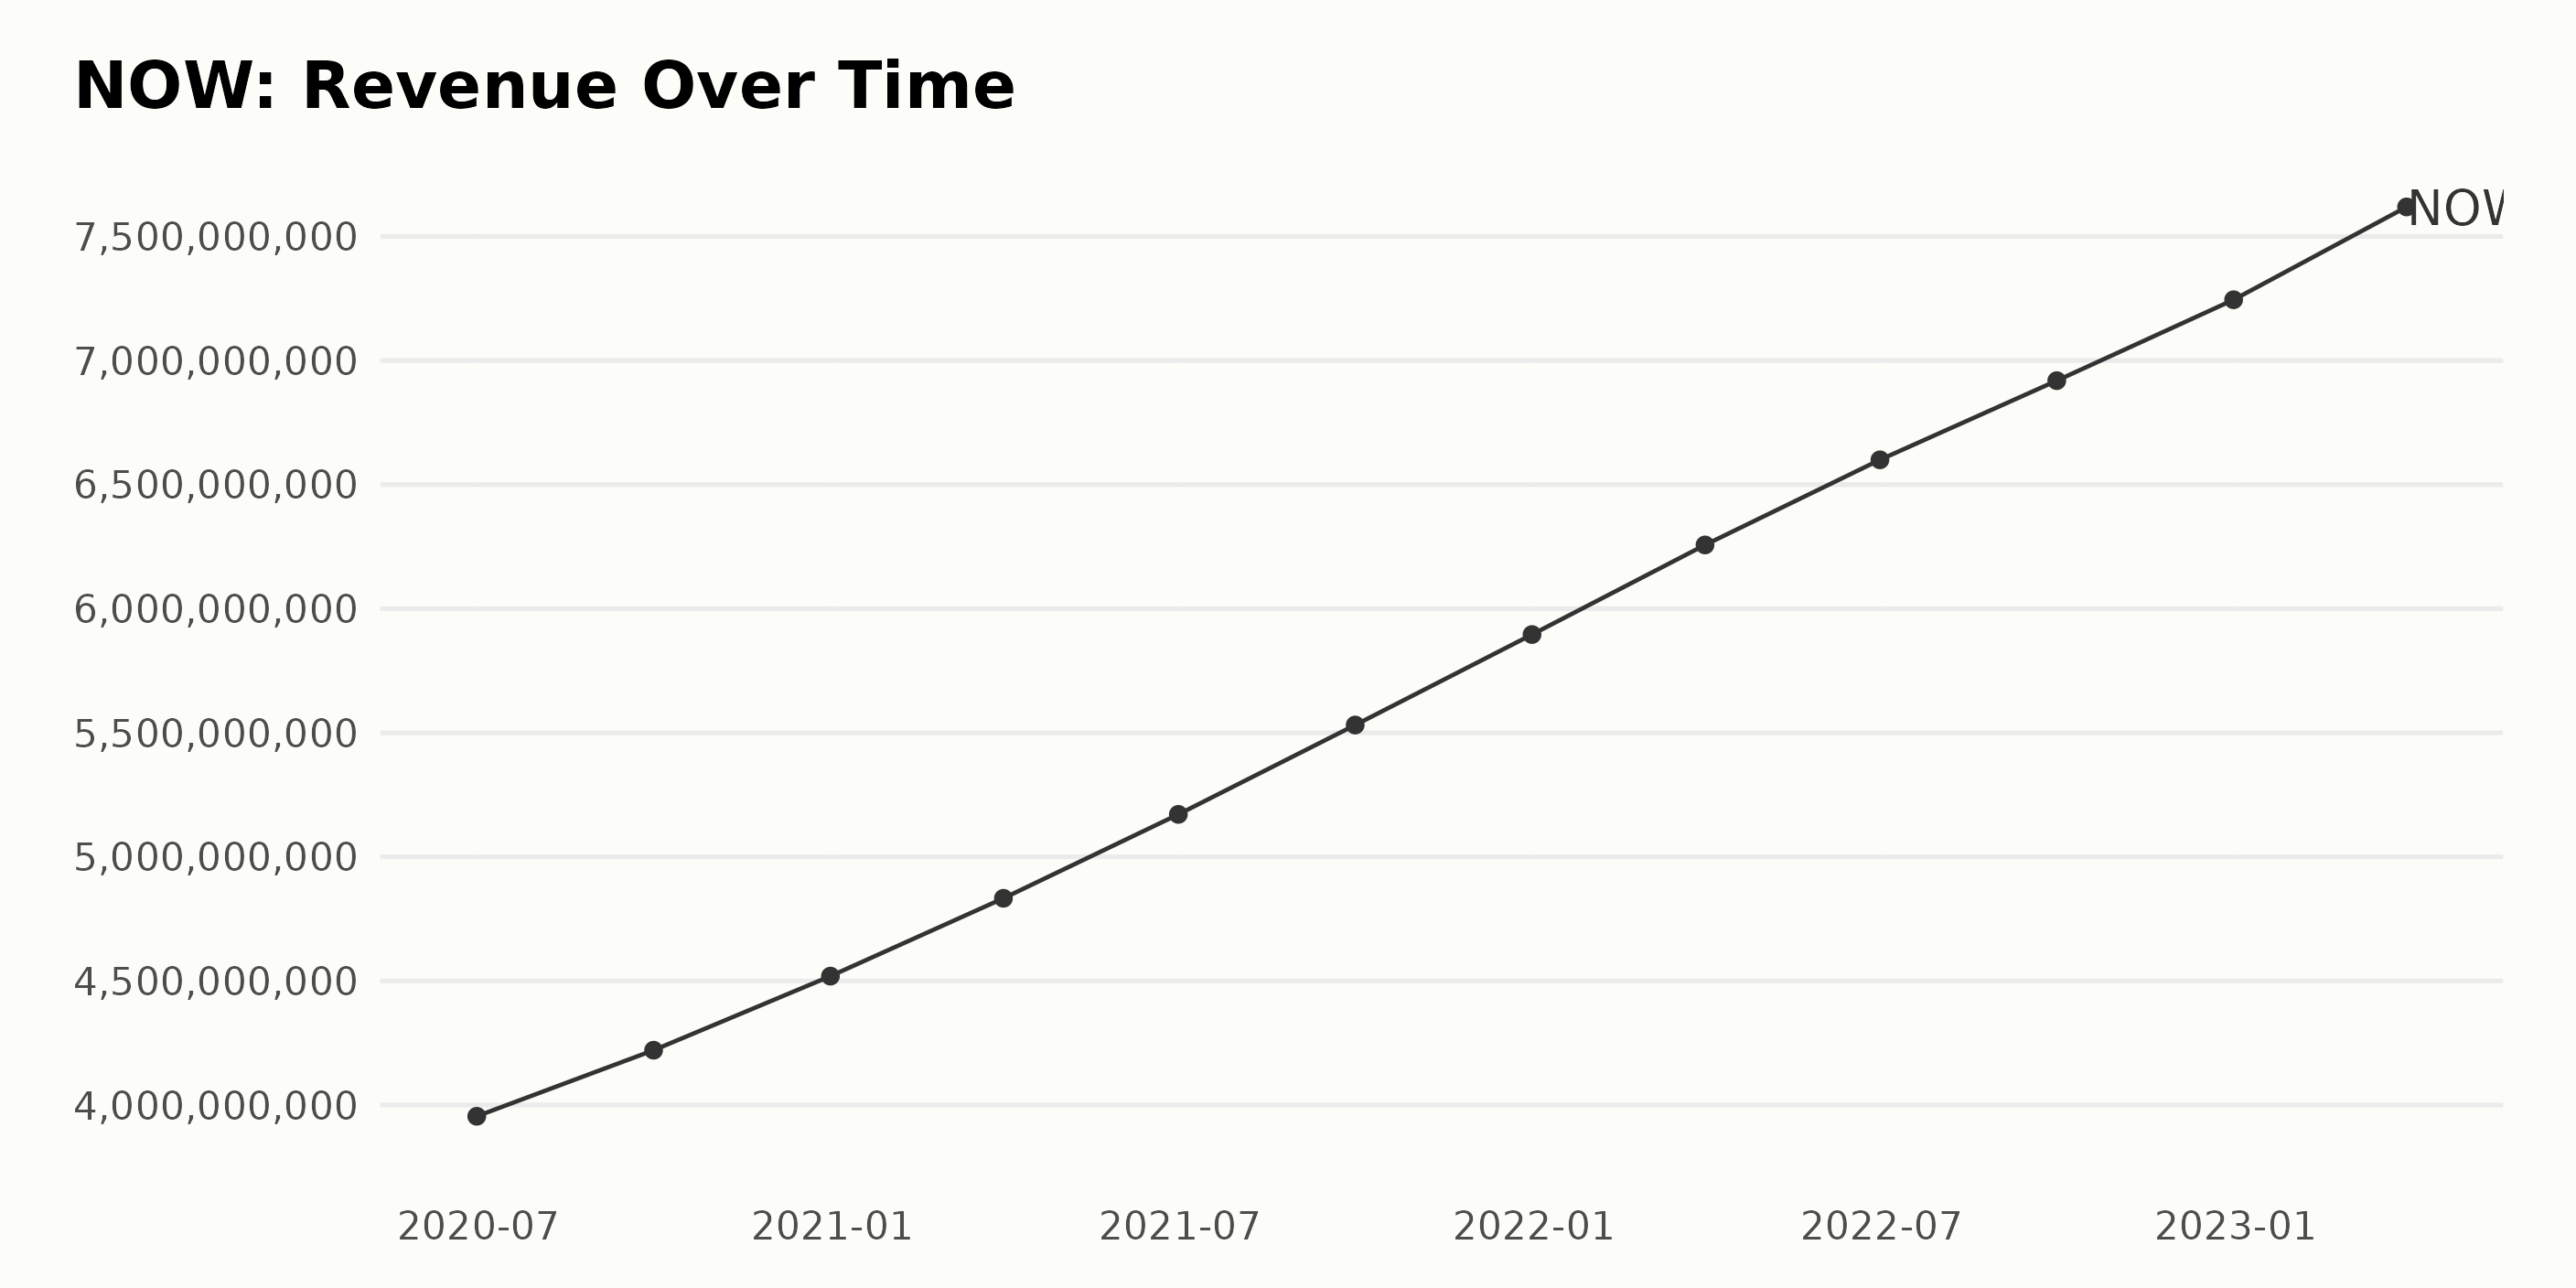
NOW’s trailing-12-month revenues have been consistently increasing over the observed time period, with notable growth and occasional fluctuations. Key highlights include:
- In June 2020, the revenue was $3.95 billion.
- By September 2020, NOW’s revenue increased to $4.22 billion, demonstrating an upward trend in just a few months.
- At the close of 2020, NOW’s revenue reached $4.52 billion in December.
- The growth continued into 2021, with the revenue peaking at $5.89 billion in December.
- The upward trend persisted in 2022, with revenue reaching $6.6 billion in June and later $6.92 billion in September.
- By the end of 2022, NOW’s revenue increased further to $7.25 billion in December.
- From December 2022 to March 2023, the growth rate accelerated, with revenue reaching $7.62 billion.
Overall, the most recent data highlights the increased revenue for NOW since June 2020. Comparing the first value of $3.95 billion in June 2020 to the last value of $7.62 billion in March 2023, the growth rate is approximately 93%.
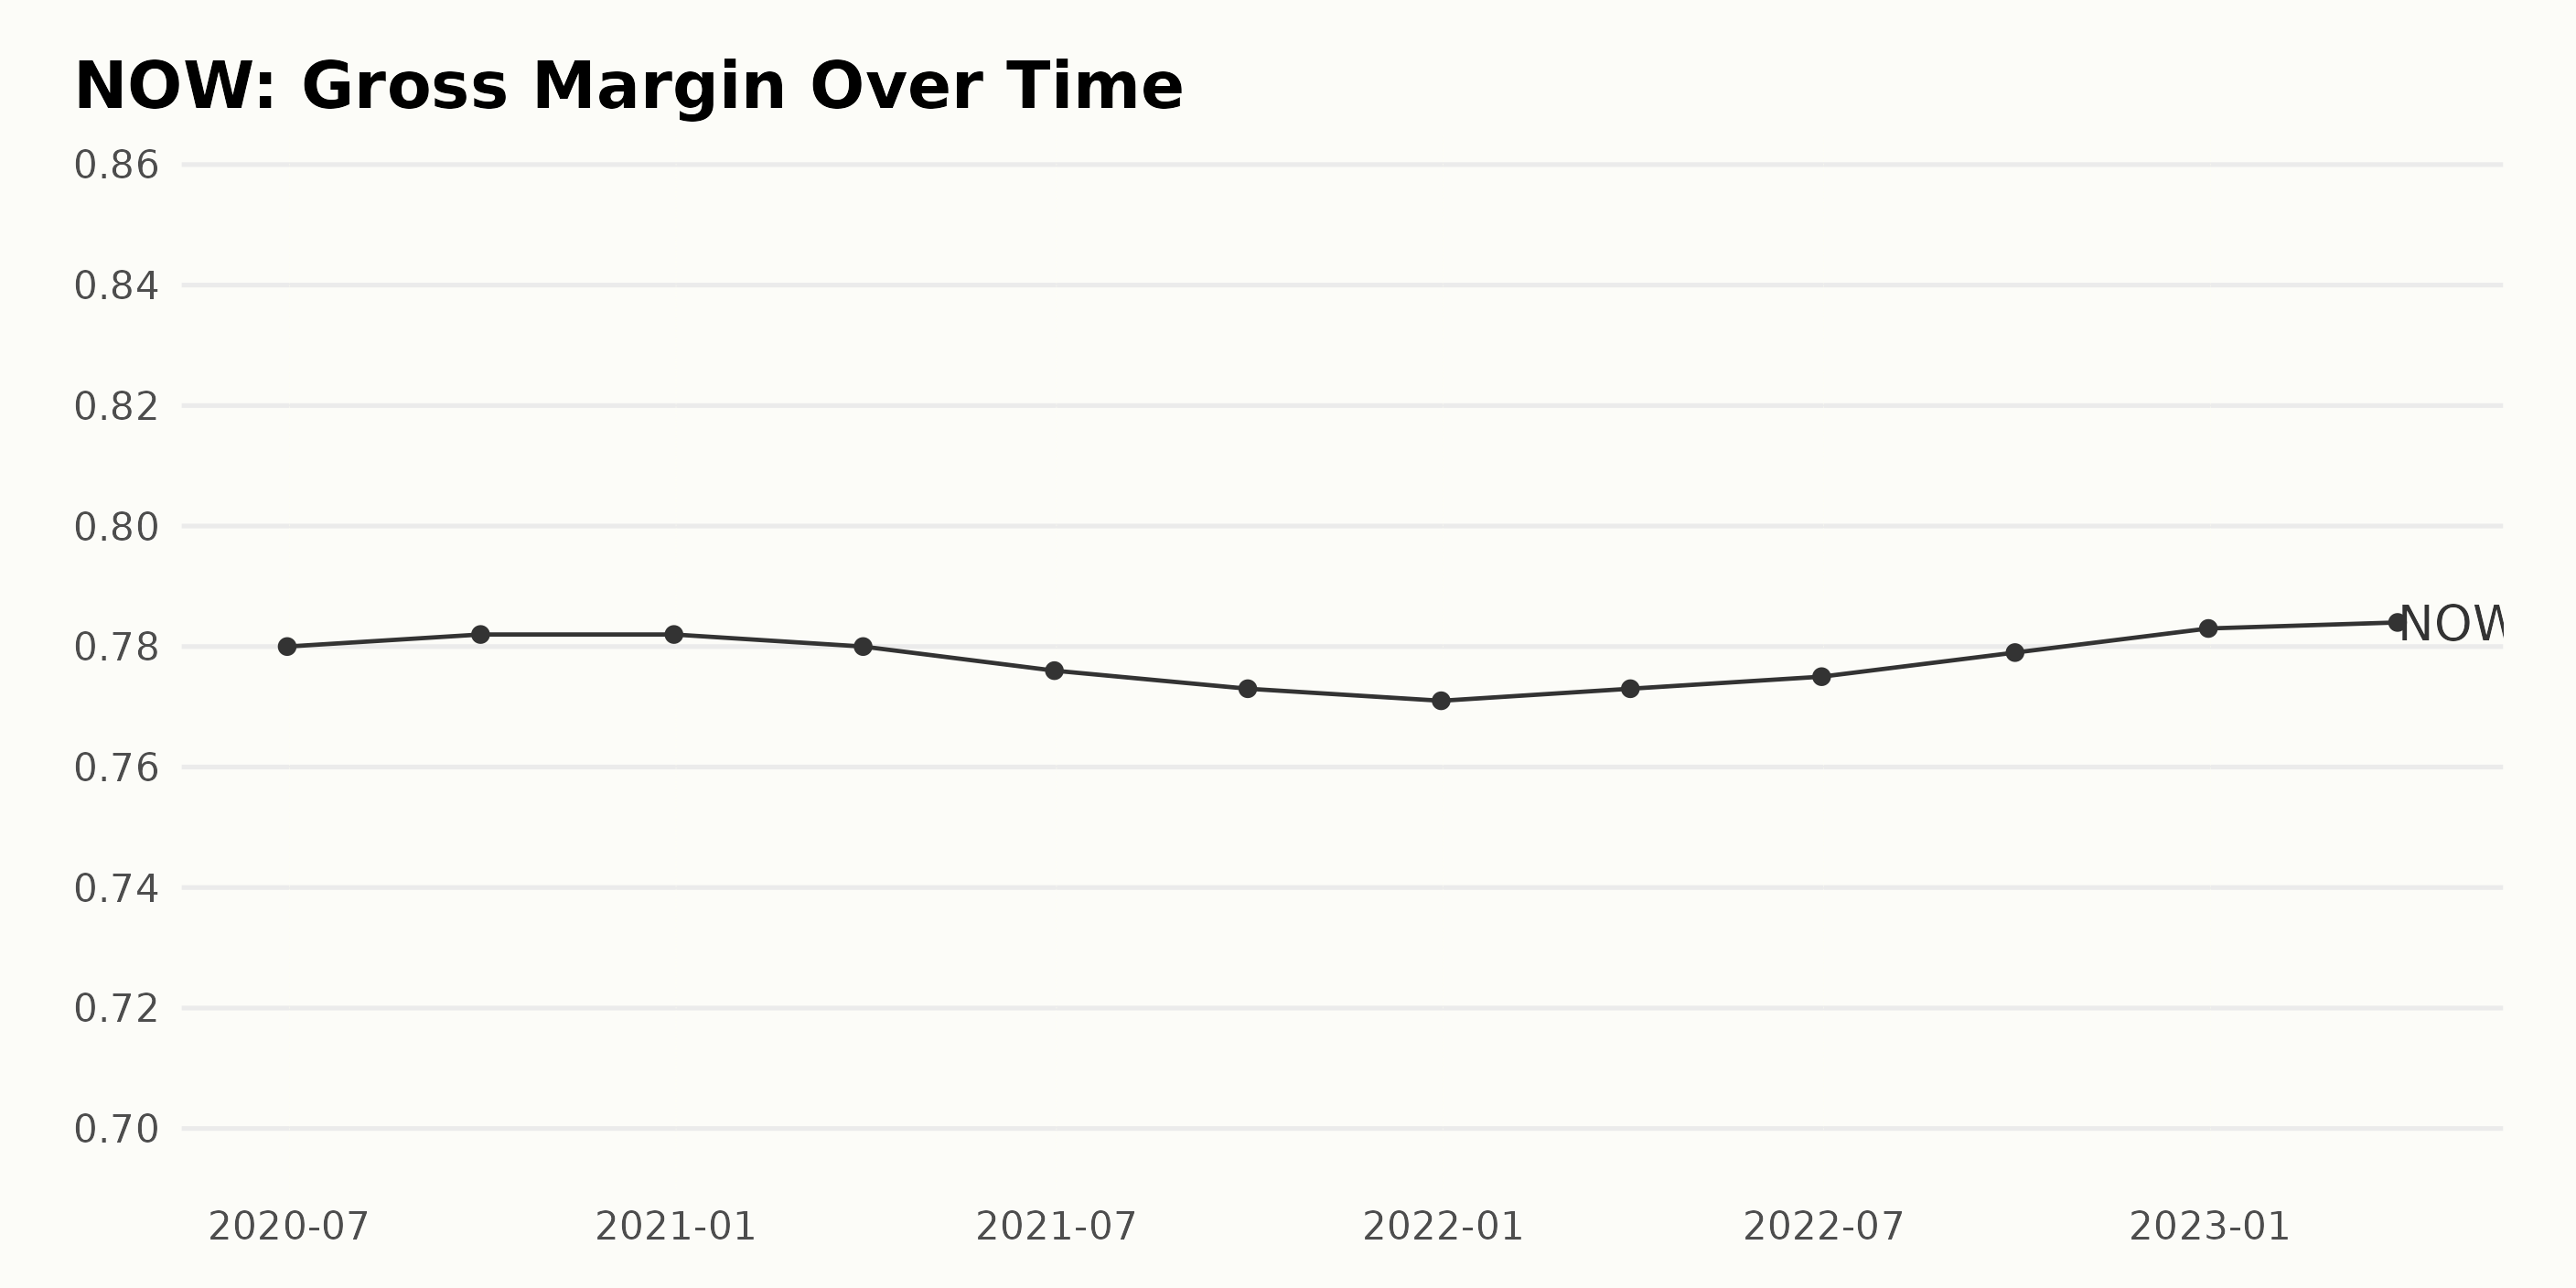
NOW has experienced fluctuations in its gross margin over the years, from June 2020 to March 2023. Here are the key points:
- June 2020: 78.00%
- September 2020: 78.20%
- December 2020: 78.20%
- March 2021: 78.00%
- June 2021: 77.60%
- September 2021: 77.30%
- December 2021: 77.10%
- March 2022: 77.30%
- June 2022: 77.50%
- September 2022: 77.90%
- December 2022: 78.30%
- March 2023: 78.40%
In recent times, the gross margin dipped to 77.10% in December 2021 and has been gradually improving since then, reaching 78.40% in March 2023. The growth rate from June 2020 (78.00%) to March 2023 (78.40%) is 0.51%.
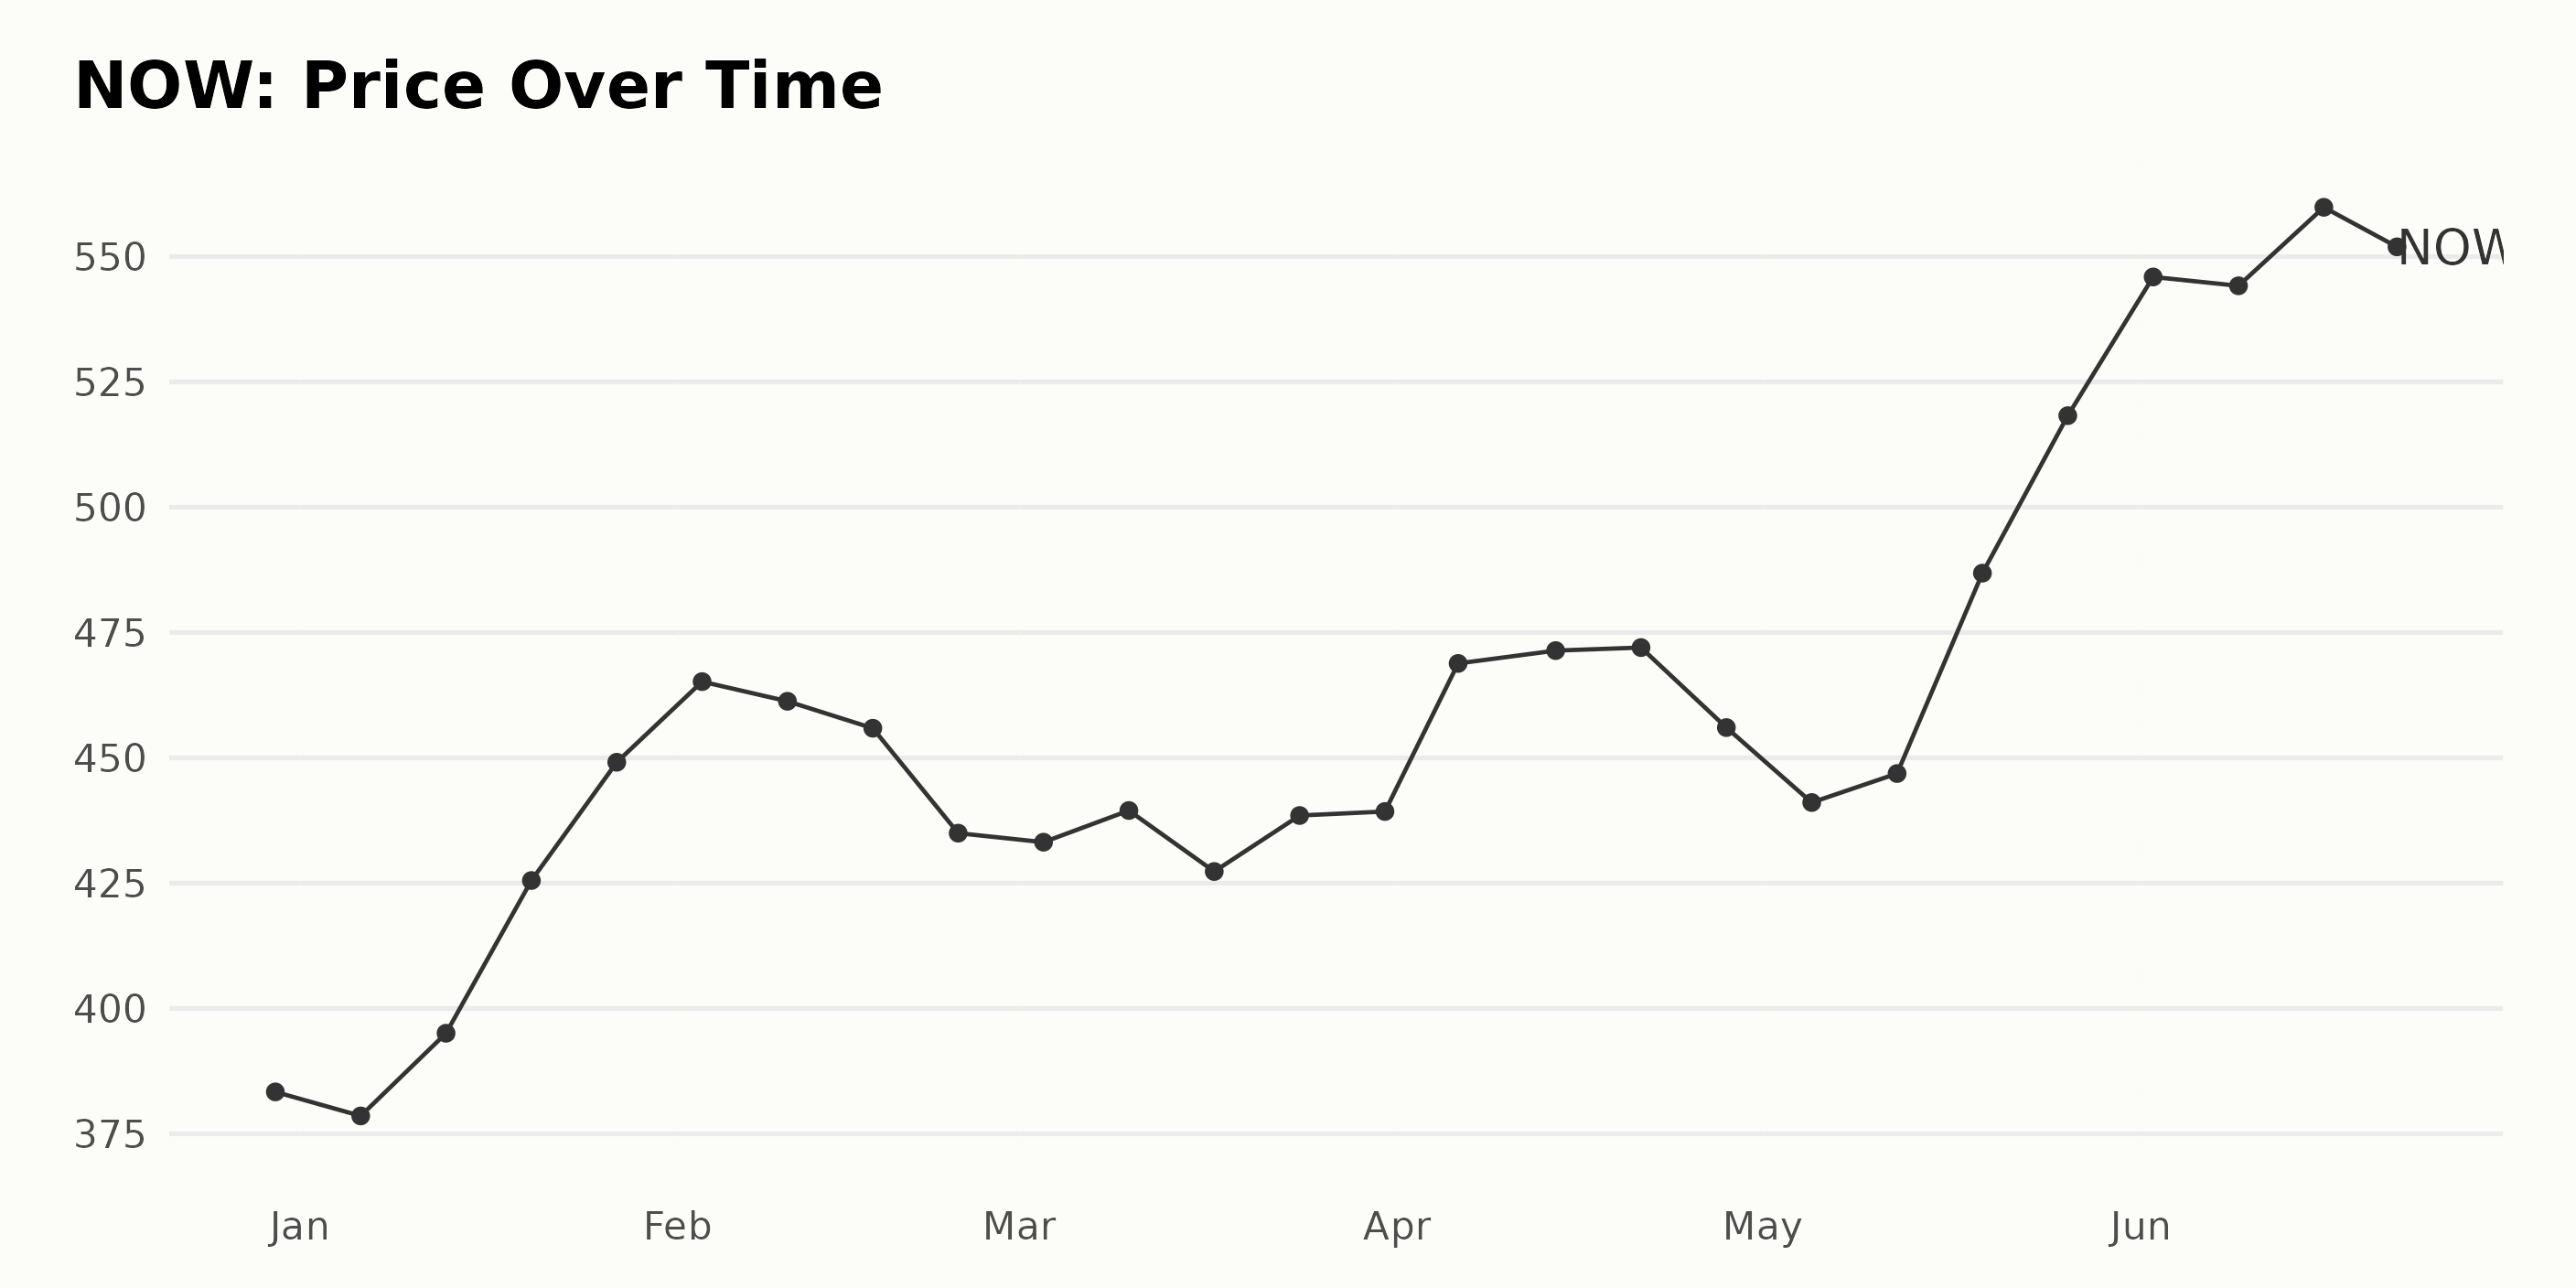
Analyzing ServiceNow’s Share Price Journey: Growth and Fluctuations (December 2022 – June 2023)
The data provided represents the share price of NOW from December 30, 2022, to June 22, 2023. Here are the key points and trends observed:
- A slight decline in the share price between December 30, 2022 ($383.35) and January 6, 2023 ($378.56)
- A continuous increase in the share price from January 6, 2023, ($378.56) to February 3, 2023, ($465.21)
- The share price then experiences fluctuations between February 3, 2023 ($465.21) and April 6, 2023 ($468.84)
- From April 6, 2023 ($468.84) to May 26, 2023 ($518.27), the share price presents a fluctuating yet an overall increasing trend
- A rapid increase in share price is observed between May 19, 2023 ($486.85) and June 2, 2023 ($545.94)
- Between June 2, 2023 ($545.94) and June 22, 2023 ($549.87), the share price fluctuates without a clear trend
Overall, NOW presents an accelerating growth rate in its share price from December 2022 to June 2023. Still, some fluctuations are observed from February 2023 onwards, resulting in alternating periods of increase and decrease in share price. Here is a chart of NOW’s price over the past 180 days.
ServiceNow: Analyzing Growth, Quality, and Sentiment Ratings
NOW has an overall B rating, translating to a Buy in our POWR Ratings system. NOW is ranked #11 out of 52 in the Software – Business category, demonstrating its relatively strong position in this sector.
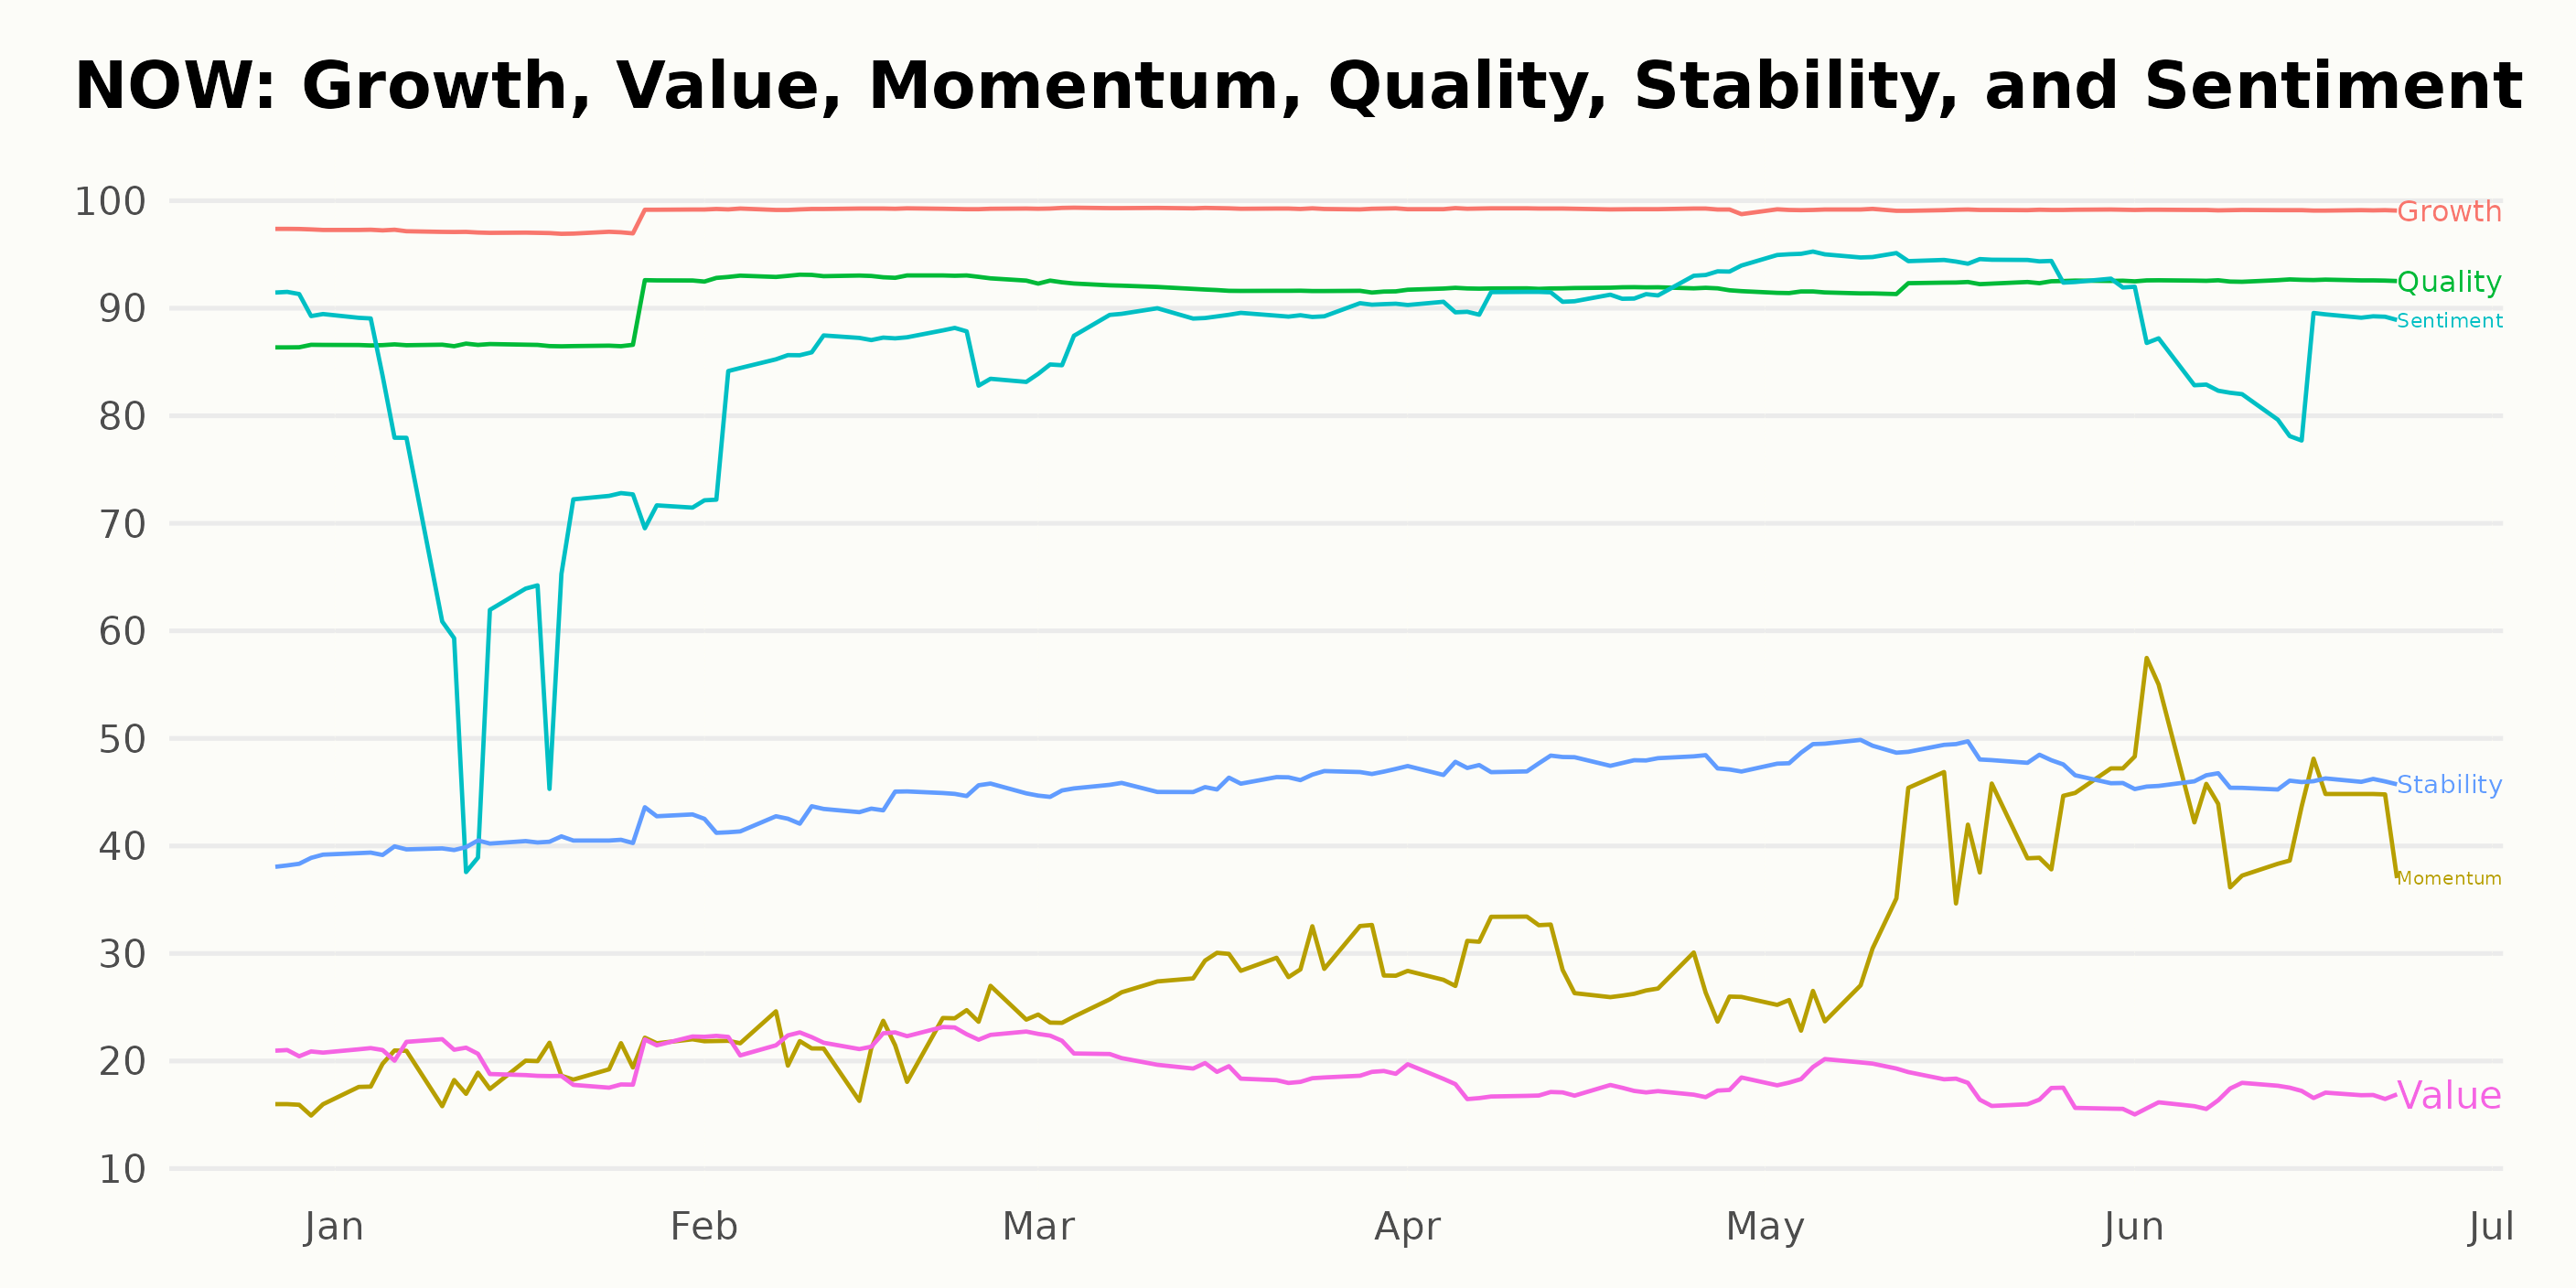
NOW has seen some notable changes in its POWR Ratings across three important dimensions from December 31, 2022, to June 22, 2023. The most noteworthy dimensions to focus on are Growth, Quality, and Sentiment. Here are the key takeaways from these dimensions:
- Growth: The Growth rating consistently remained high throughout the period, improving from 97 on December 31, 2022, to 99 on February 28, 2023, staying constant until June 22, 2023.
- Quality: NOW demonstrated a steadily increasing trend in Quality from December 31, 2022, at 86, reaching 93 by June 22, 2023.
- Sentiment: The Sentiment rating experienced some fluctuation during the observed period, starting at 91 on December 31, 2022, decreasing to 68 on January 31, 2023, and then gradually increasing to reach 94 on May 31, 2023. By June 22, 2023, the rating settled at 85.
These ratings suggest that NOW has experienced strong growth and improving quality while demonstrating relatively positive sentiment with some variations over the analyzed period.
How does ServiceNow Inc. (NOW) Stack Up Against its Peers?
Other stocks in the Software – Business sector that may be worth considering are Sapiens International Corporation N.V. (SPNS), F5 Networks Inc. (FFIV), and Vmware Inc. (VMW) — they have better POWR Ratings.
What To Do Next?
Get your hands on this special report with 3 low priced companies with tremendous upside potential even in today’s volatile markets:
3 Stocks to DOUBLE This Year >
Want More Great Investing Ideas?
NOW shares were trading at $550.05 per share on Friday afternoon, up $0.18 (+0.03%). Year-to-date, NOW has gained 41.67%, versus a 14.50% rise in the benchmark S&P 500 index during the same period.
About the Author: Subhasree Kar

Subhasree’s keen interest in financial instruments led her to pursue a career as an investment analyst. After earning a Master’s degree in Economics, she gained knowledge of equity research and portfolio management at Finlatics. More...
More Resources for the Stocks in this Article
| Ticker | POWR Rating | Industry Rank | Rank in Industry |
| NOW | Get Rating | Get Rating | Get Rating |
| SPNS | Get Rating | Get Rating | Get Rating |
| FFIV | Get Rating | Get Rating | Get Rating |
| VMW | Get Rating | Get Rating | Get Rating |
| NVDA | Get Rating | Get Rating | Get Rating |