

Realty Income Corporation (O) boasts a long history of rewarding investors with steady dividends. It is a member of the S&P 500 Dividend Aristocrats index and has increased the dividend 121 times since its public listing in 1994. Moreover, it has a record of over 100 consecutive quarterly increases, making this REIT a desired option for income investors.
However, it is pertinent to note that when it comes to profitability, O’s trailing-12-month asset turnover ratio of 0.07x is 42.8% lower than the industry’s average rate of 0.13x. Furthermore, its trailing-12-month ROTA, ROTC, and ROE of 1.61%, 1.96%, and 3.02% compared with the 1.82%, 2.07%, and 3.88% industry averages.
In addition, the stock looks overvalued at its current price, with its forward P/FFO of 13.78x, 12.3% higher than the industry average of 12.27x, while its forward non-GAAP P/E of 44.42x is 30.6% higher than the industry average of 34.01x.
In light of these crucial financial trends and figures for O, it may be prudent for investors to avoid the stock at the moment. Detailed examination of O’s key financial metrics is advised before intending investors make their move.
Analyzing Realty Income Corporation’s Financial Performance from 2020 to 2023
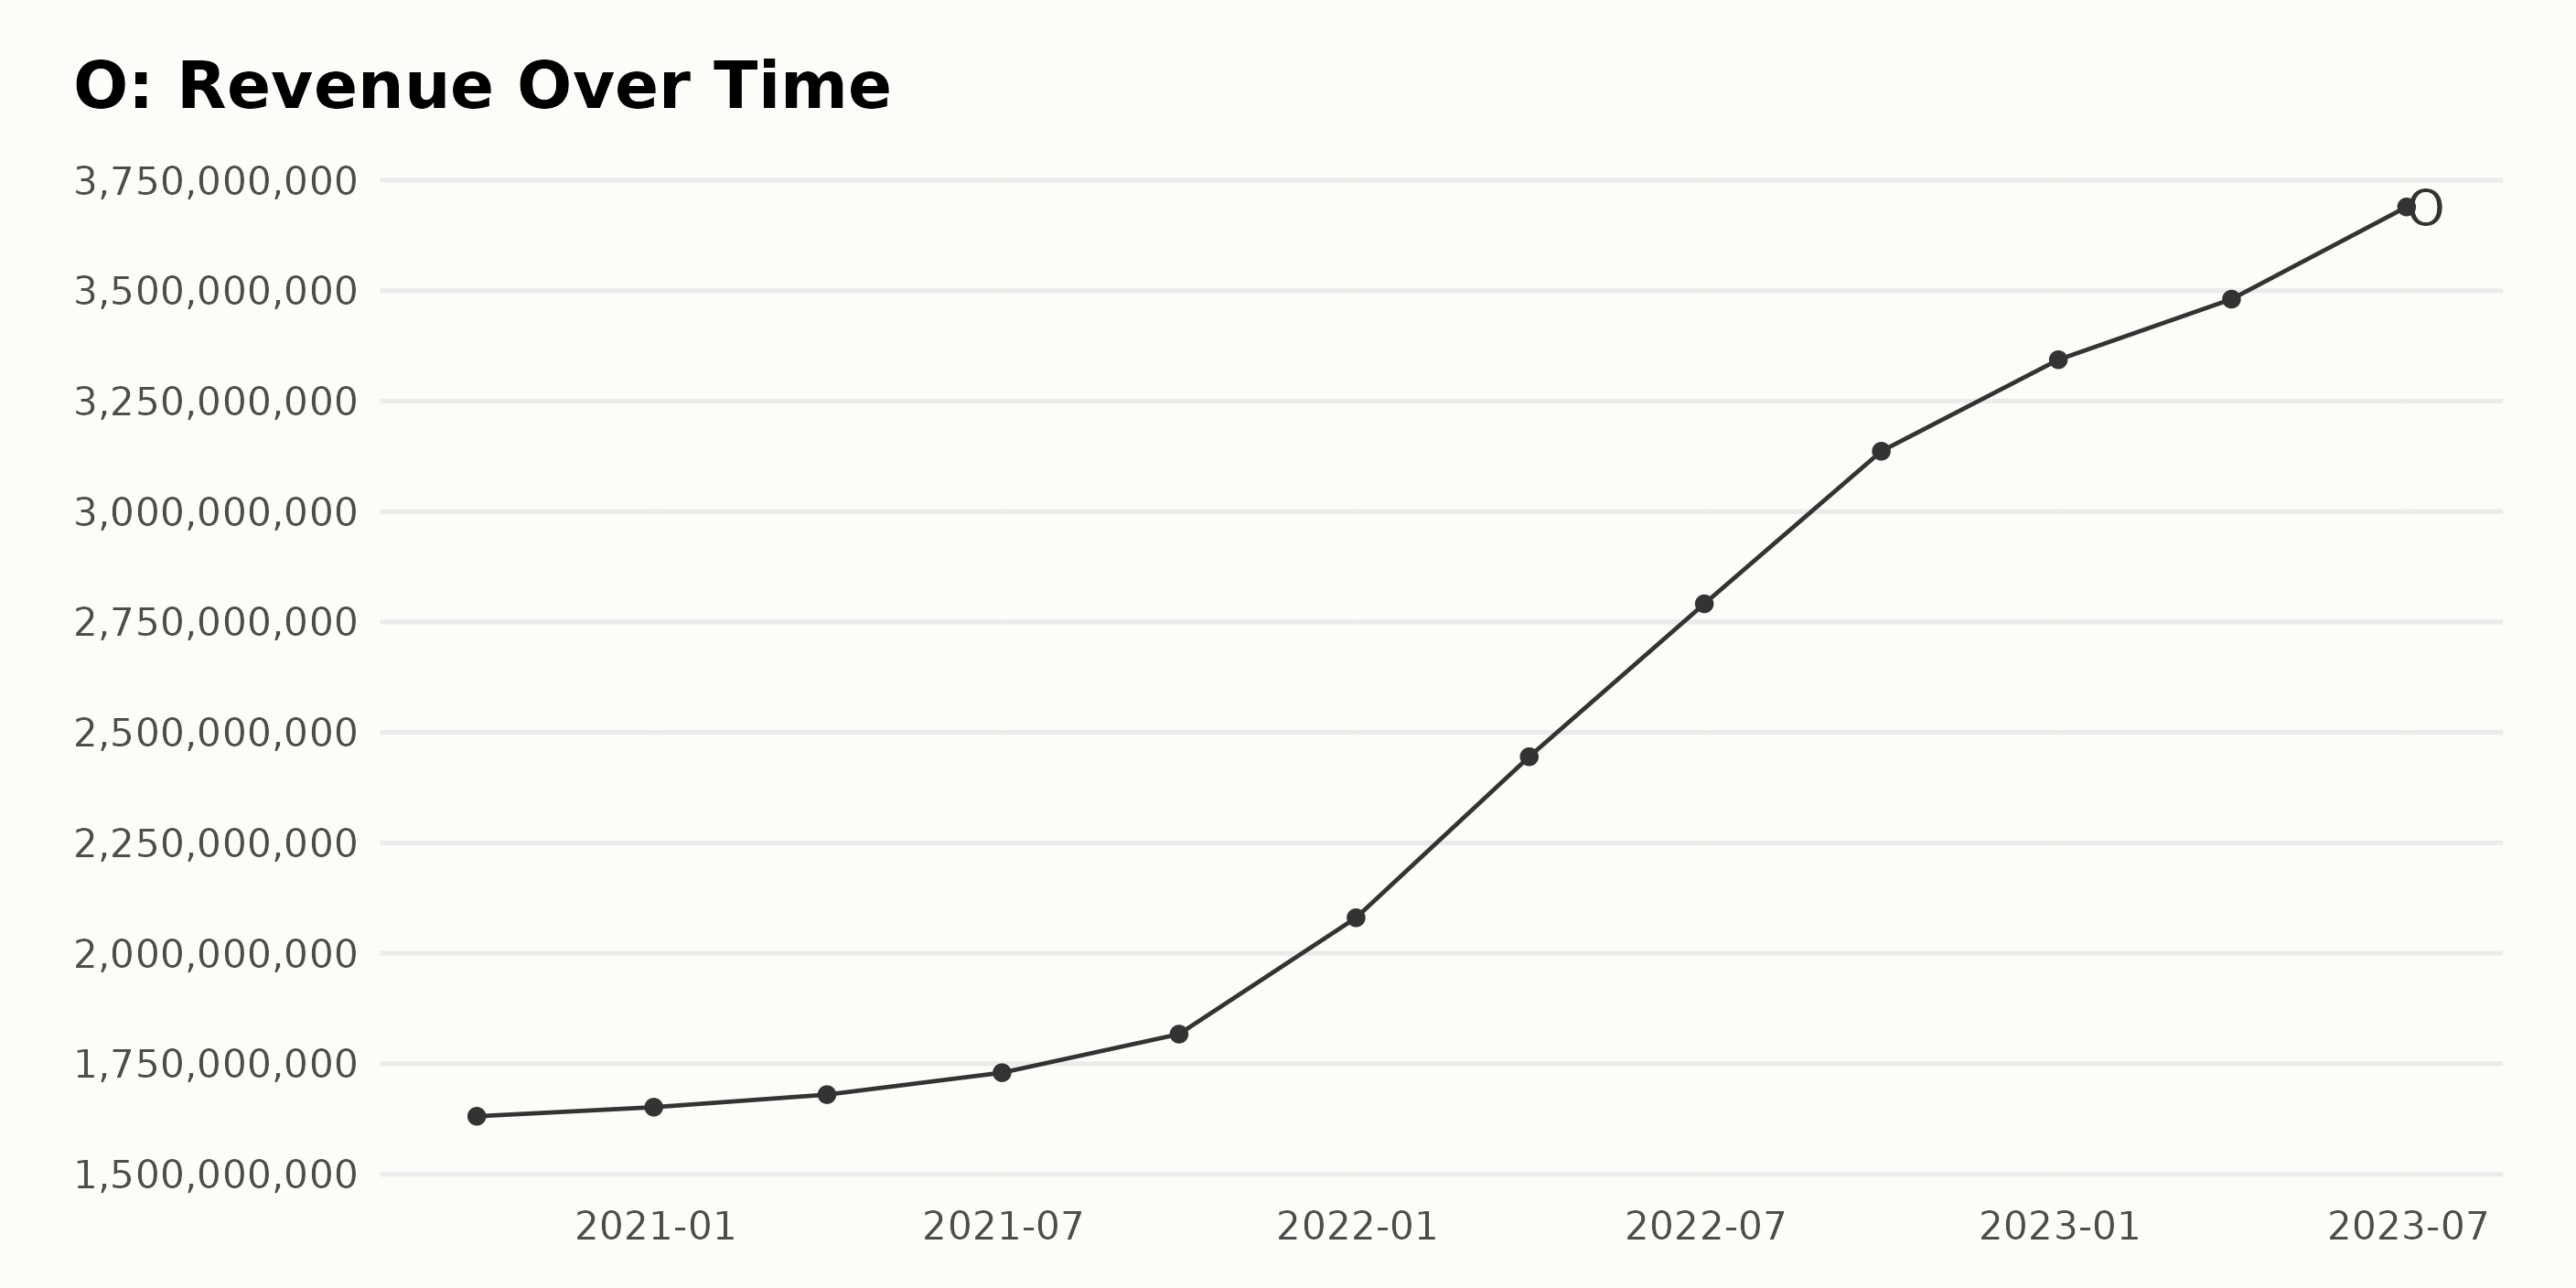
The series data provided represents the trailing-12-month revenue trend for O from September 2020 to June 2023. Here’s a summary:
- Starting from $1.63 billion in September 2020, the corporation’s revenue consistently rose over the subsequent quarters.
- Gradual increments were noted until December 2021, when the revenue rose to $2.08 billion, indicating a significant rise in business prospects.
- In the first quarter of the following year (March 2022), the revenue made an impressive leap to $2.45 billion and continued a steady rise in the coming quarters.
- By the end of 2022, the revenue had reached a notable figure of $3.34 billion, presenting almost twice the gain compared to the same period in the previous year.
- Entering 2023, the firm maintained its upward revenue stride, escalating to $3.48 billion in March and making a substantial turnover of $3.69 billion by the end of June 2023.
In conclusion, the overall trend in the Realty Income Corporation’s revenue have been positive, with fluctuations mostly characterized by steady quarterly increases, especially from 2022 onwards. The growth rate, calculated by measuring the last value from the first value, shows a more than twofold increase in revenue over this period, demonstrating a robust financial performance by the corporation.
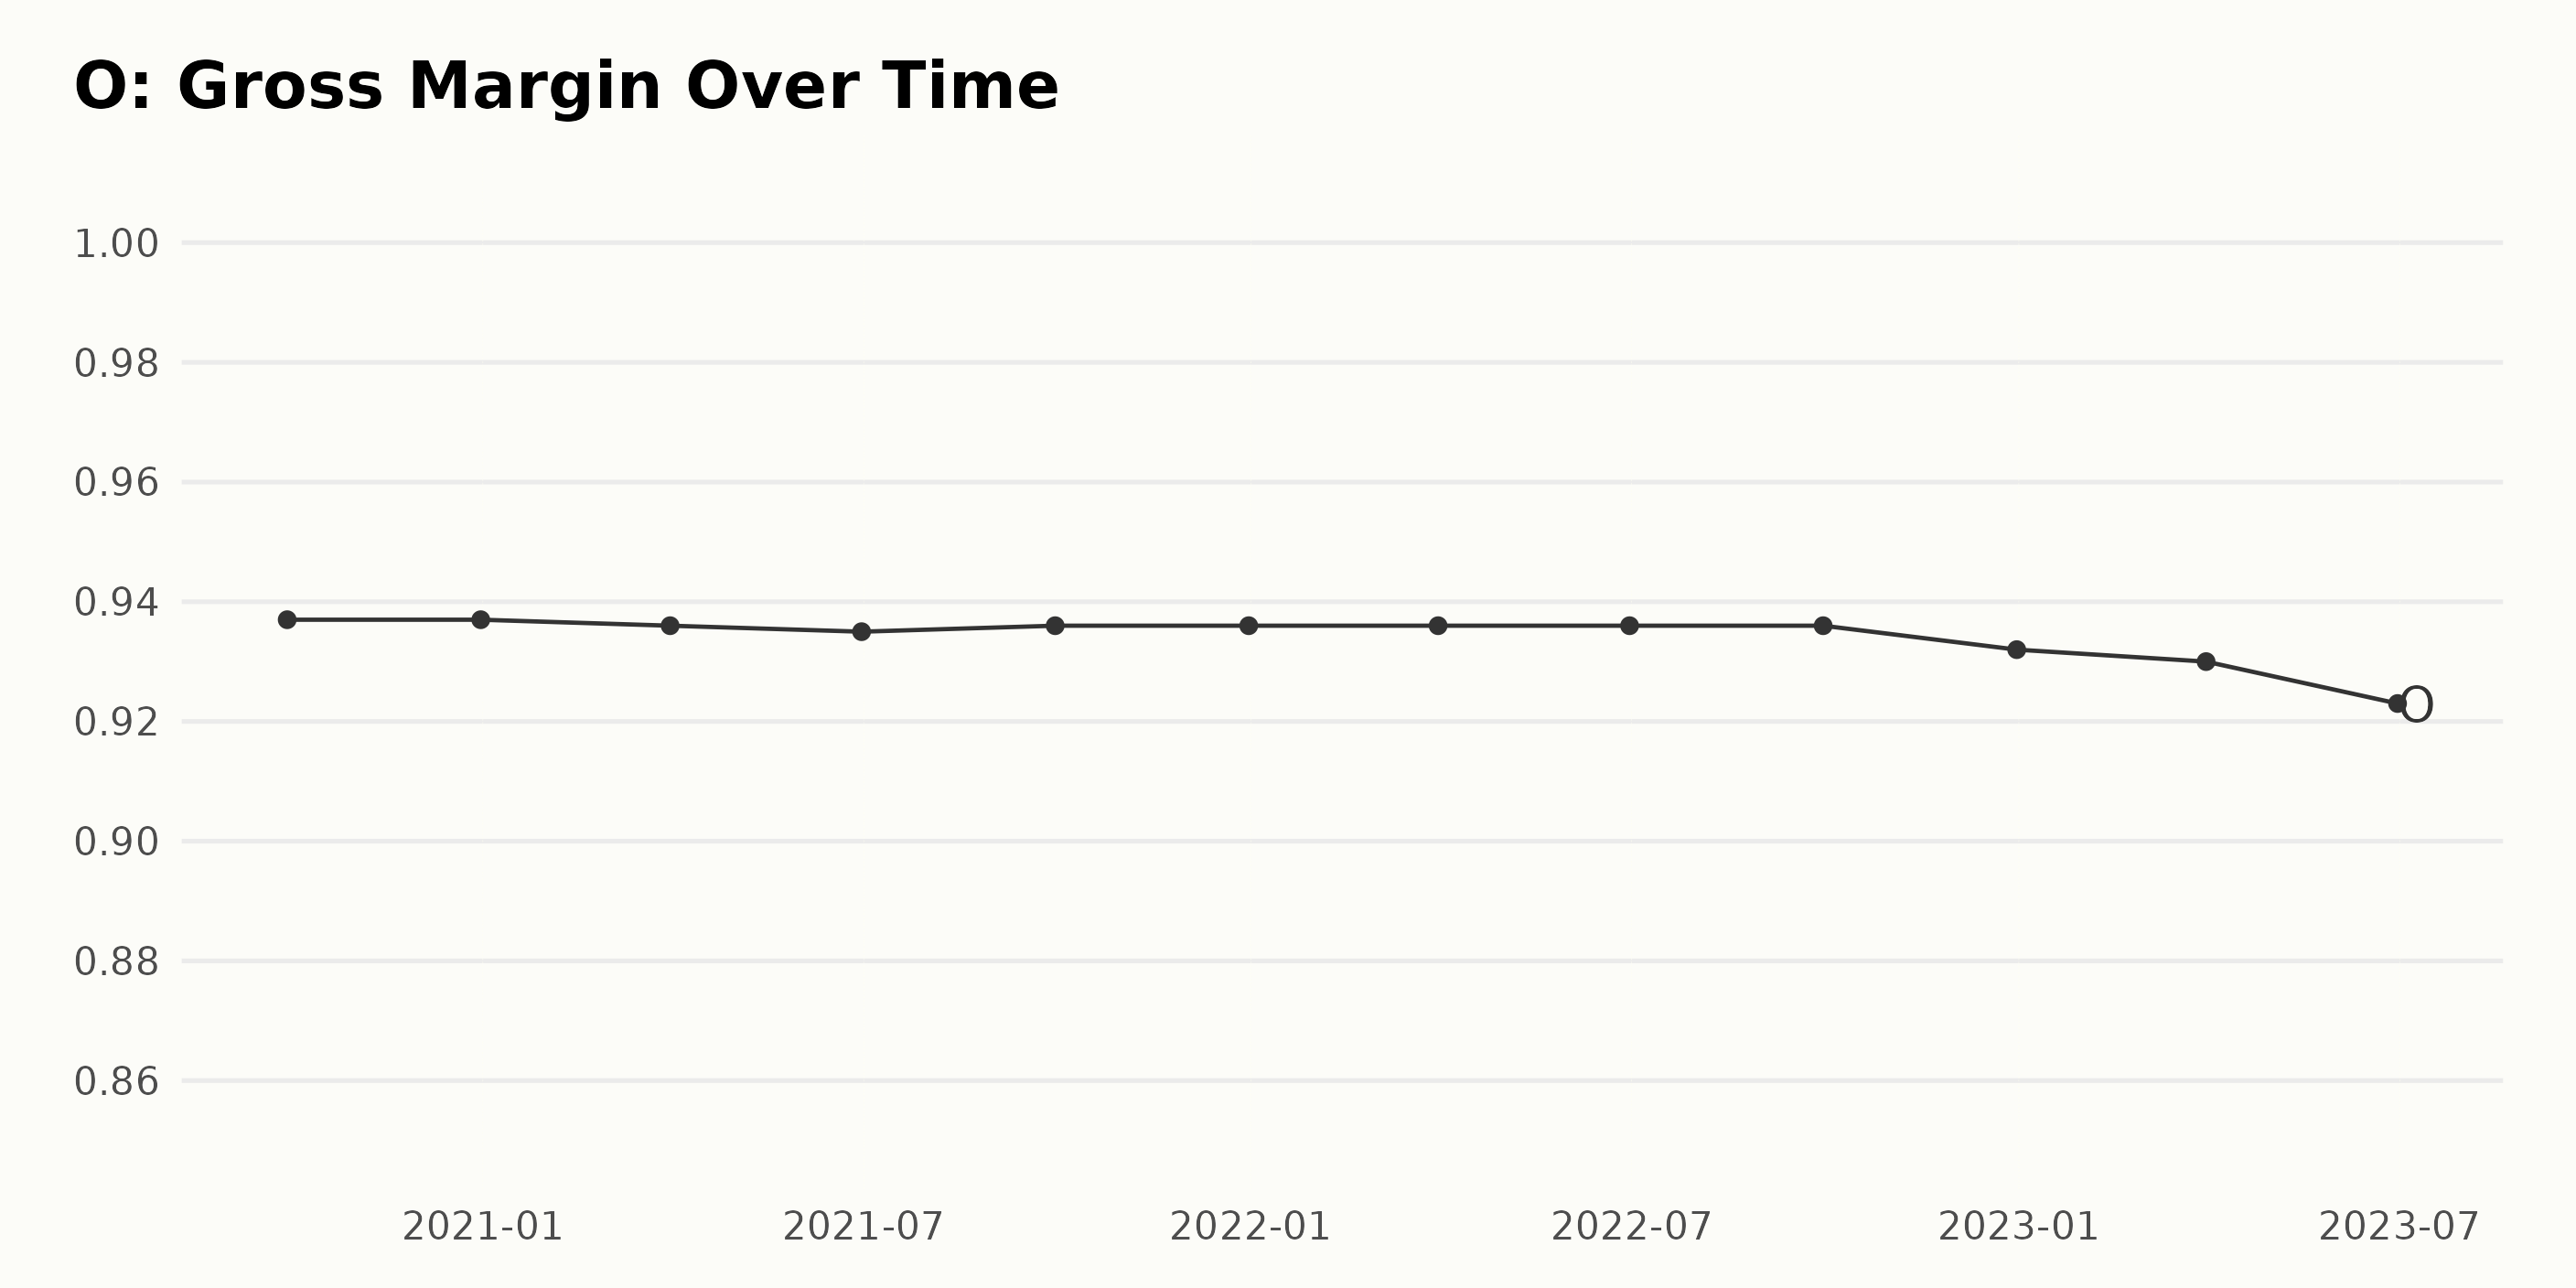
The gross margin trend of O has seen modest fluctuations over the observed period, summarized as follows:
- On September 30, 2020, the gross margin was 93.70%
- The gross margin remained steady at 93.70% on December 31, 2020
- A slight decrease was observed on March 31, 2021, with the gross margin dropping to 93.60%
- By June 30, 2021, the gross margin had further declined slightly to 93.50%
- The gross margin began to rebound slowly from September 30, 2021, and was at 93.60% by December 31, 2021
- This positive trend continued up until June 30, 2022, when the gross margin remained stable at 93.60%
- However, September 30, 2022, saw a minor decrease, with the gross margin again at 93.60%
- By the end of 2022, on December 31, O’s gross margin had slightly decreased to 93.20%
- In the first quarter of 2023, on March 31, it dipped further to 93.00%.
- Notably, a more significant decrease occurred by June 30, 2023, with the gross margin dropping to 92.30%.
Overall, the data shows a gradual downward trend in the gross margin for O. The gross margin decreased from 93.70% in September 2020 to 92.30% in June 2023, representing a total decline of approximately 1.40% over this period. This emphasizes a need for closer monitoring and strategic focus on improving the margin moving forward.
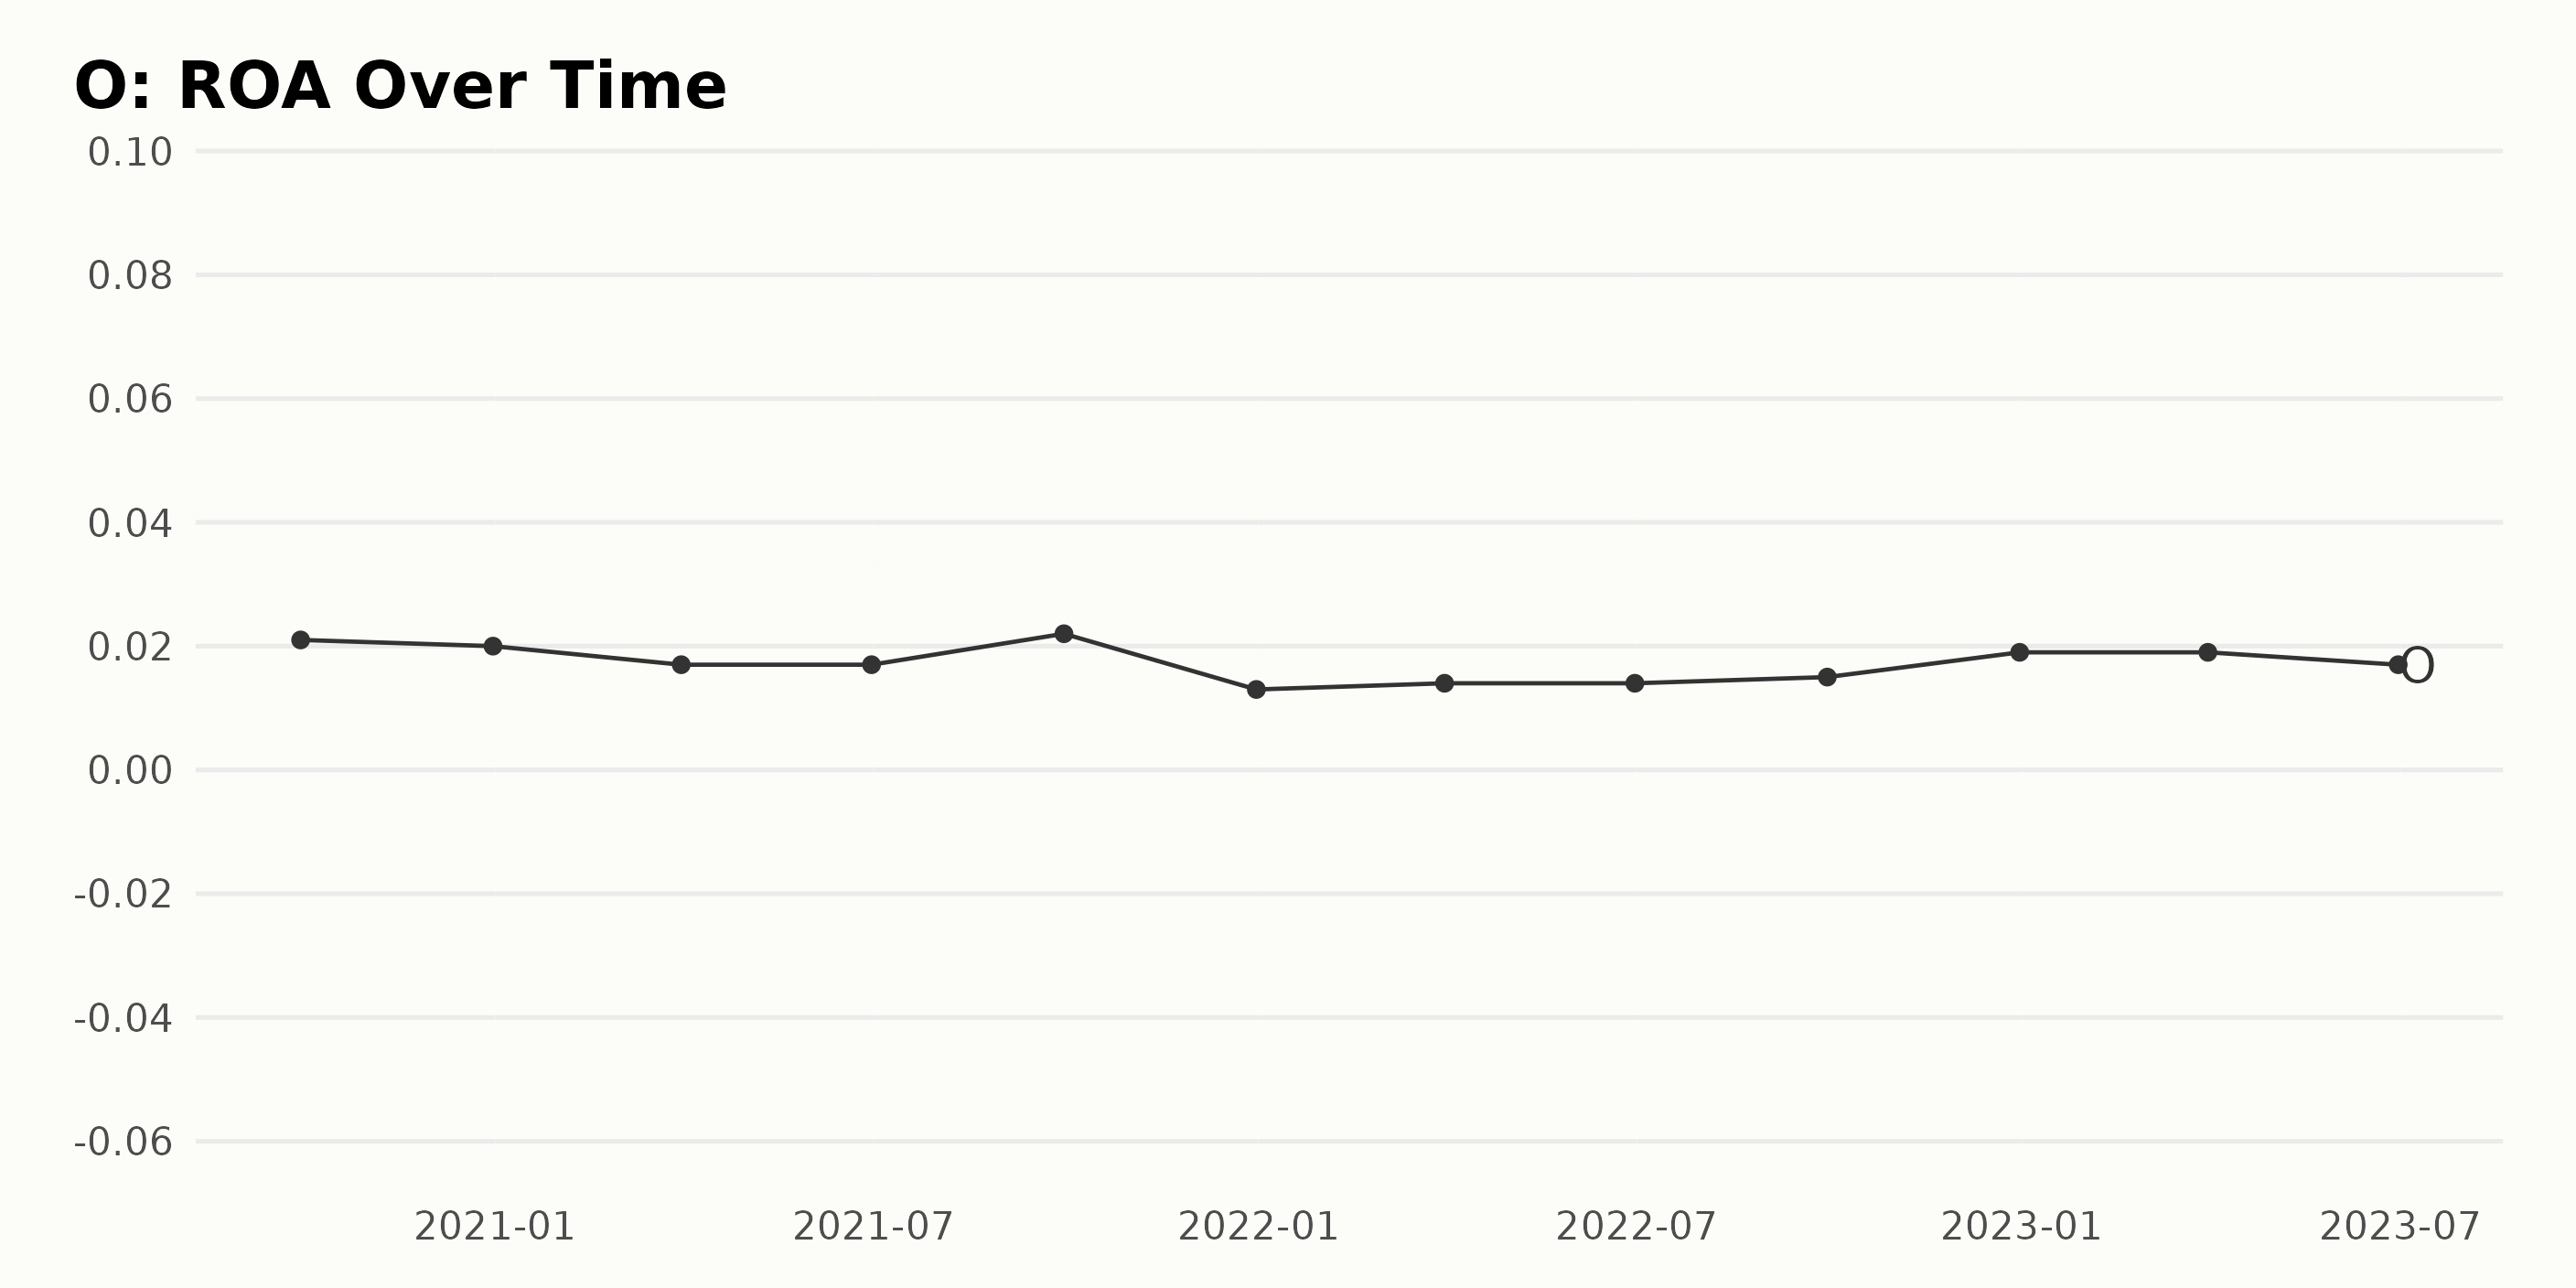
O’s Return on Assets (ROA) has exhibited several fluctuations from September 2020 to June 2023.
- On September 30, 2020, the ROA was at 0.021.
- By the end of that year, on December 31, 2020, it had slightly decreased to 0.02.
- A noticeable drop occurred in the first quarter of 2021, with the ROA reducing to 0.017 by March 31, 2021, and remained steady through June 30, 2021.
- An upturn was observed in the value by September 30, 2021, when it rose to 0.022.
- After that, the ROA saw a significant dip to 0.013 by the end of 2021 on December 31.
- Moving into 2022, it noticed an improvement but stagnated at 0.014 through June 30, 2022.
- The ROA gradually increased to 0.015 by September 30, 2022, and subsequently to 0.019 by the end of that year.
- This value remained unchanged until March 31, 2023, before noticing another slight drop to 0.017 by June 30, 2023.
This results in a growth rate or change of approximately -19%, indicating a downward trend in the ROA of O over this spanned timeline. Emphasis is placed on the most recent data point, confirming that as of June 30, 2023, the ROA stands at 0.017. Notably, this reflects a minor decrease from the preceding quarter, suggesting the need for further strategies to improve the company’s profitability.
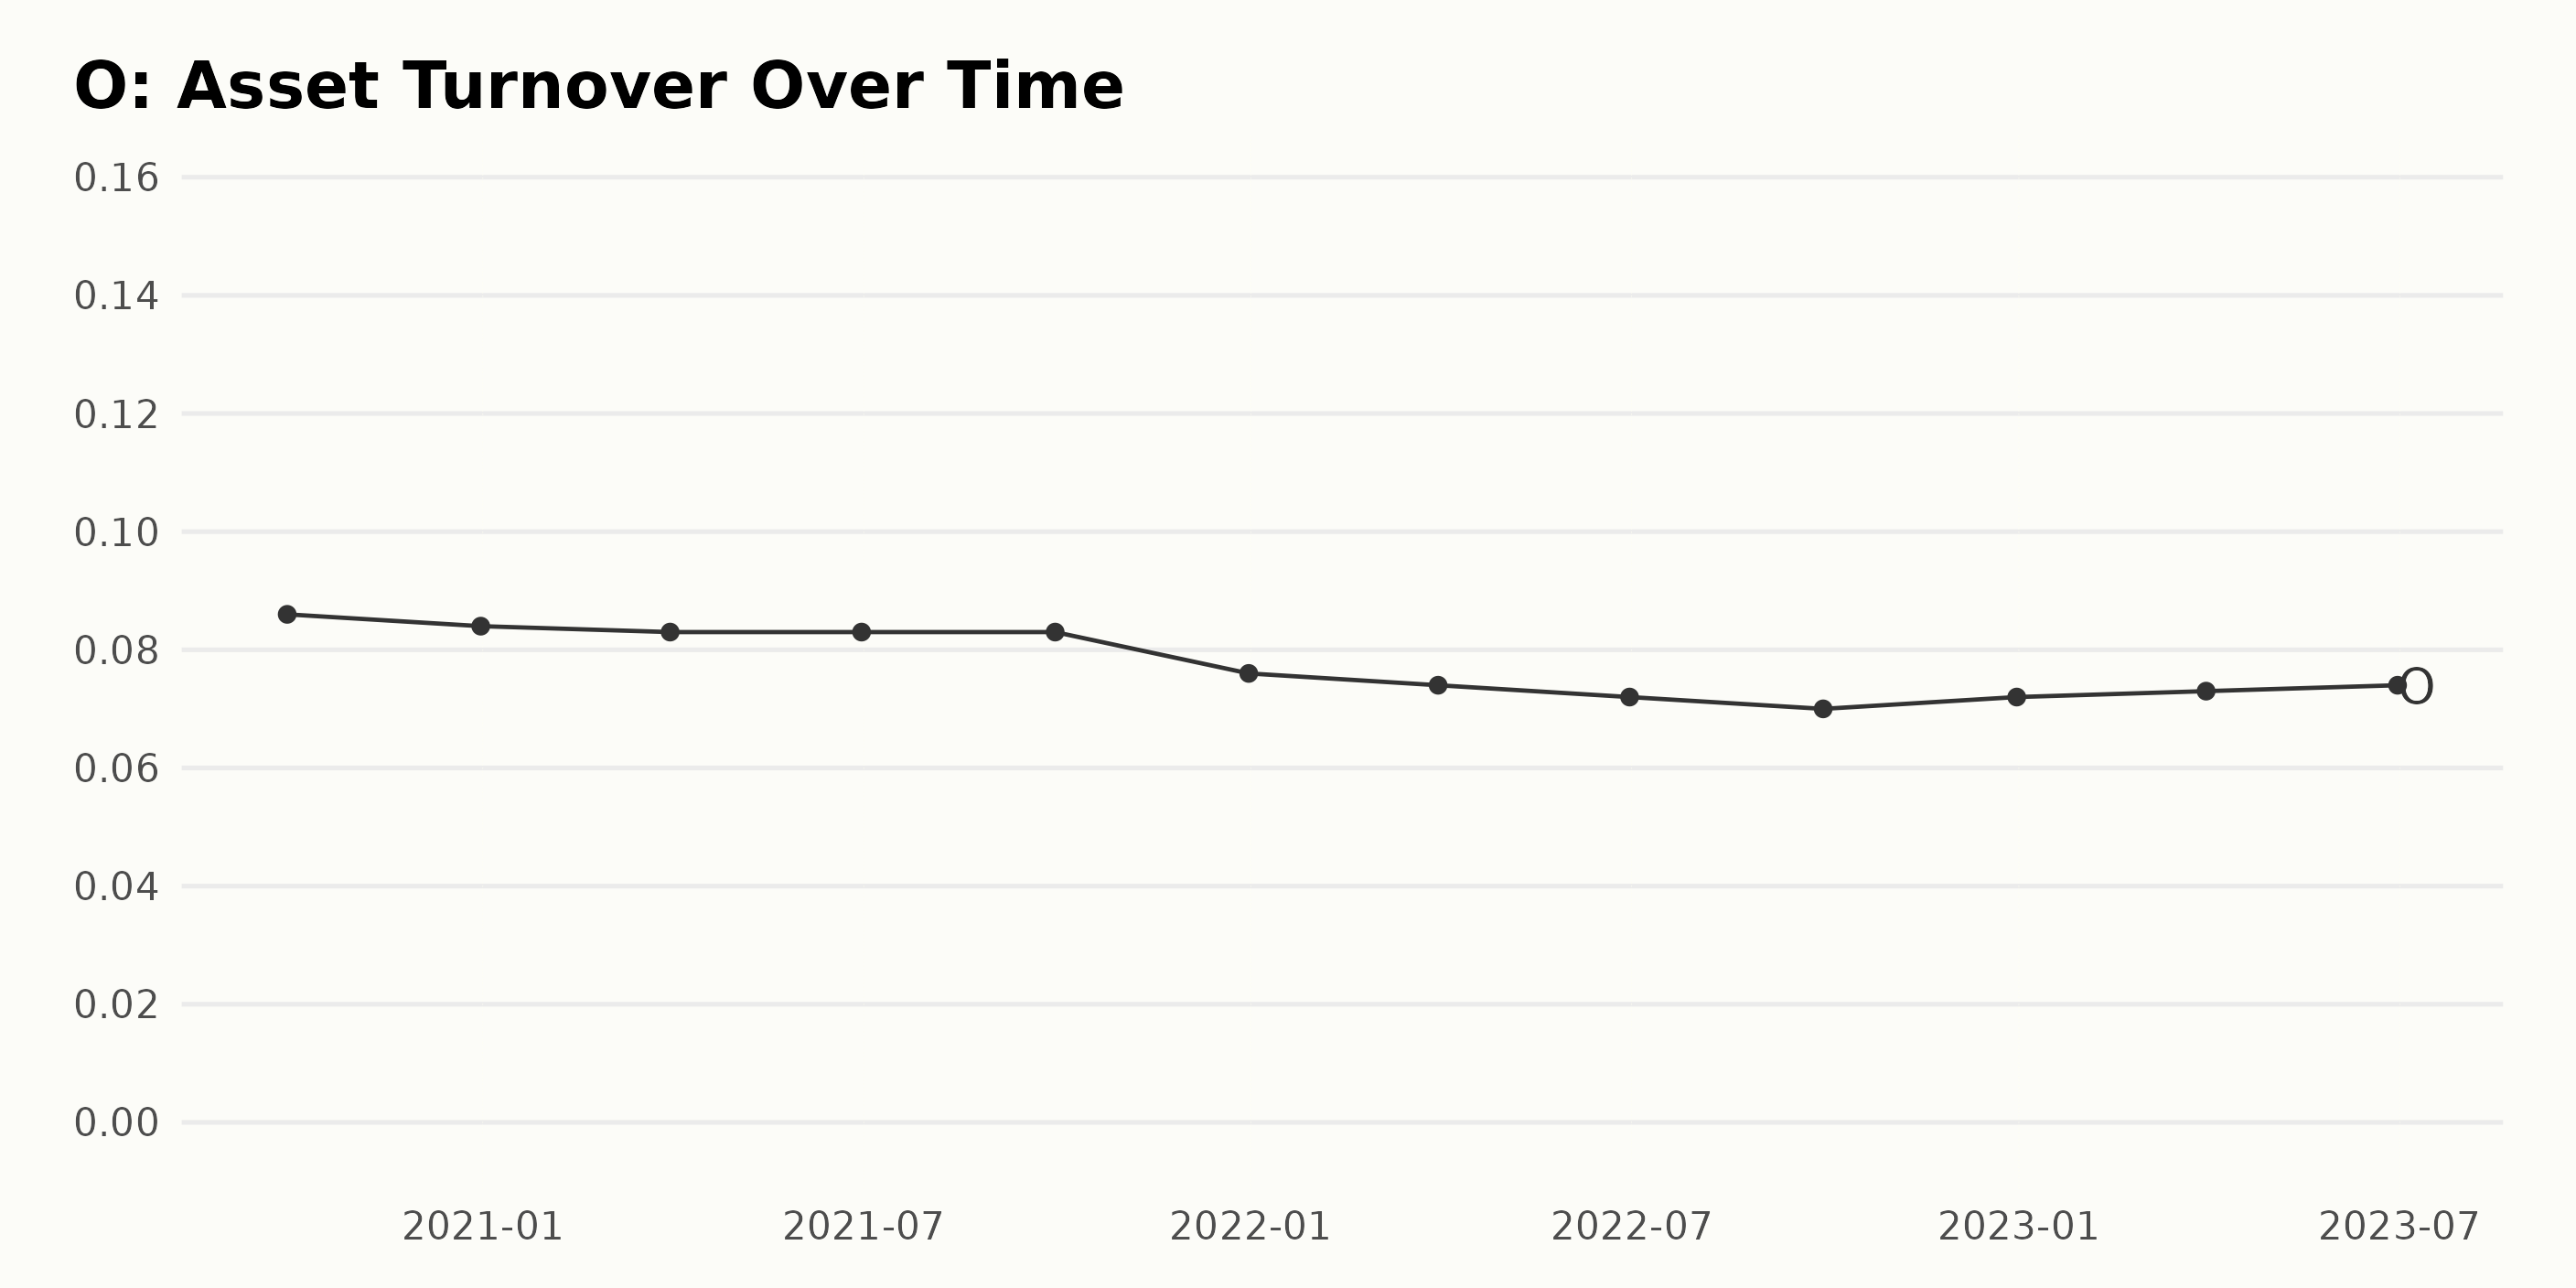
O’s asset turnover has steadily declined throughout the data series from September 2020 to June 2023. The asset turnover decreased from 0.086 in September 2020, hit a low point of 0.07 in September 2022, and slightly recovered to 0.074 by June 2023. Here is a more detailed breakdown:
- In September 2020, the asset turnover for O was at 0.086.
- By December 2020, it had slightly decreased to 0.084.
- Throughout the year 2021, there was a mild decline. The numbers remained consistent at 0.083 for three quarters (from March until September) before dipping to 0.076 in December.
- In the first half of 2022, the asset turnover showed a further decline, falling to 0.072 by June. This trend continued until September, when it dipped to its lowest at 0.07.
- However, starting from December 2022, the asset turnover showed some recovery. By June 2023, the figure had slightly risen back up to 0.074.
Taking the first and last values in the series, the growth rate of asset turnover for O decreased by approximately 14% over this period.
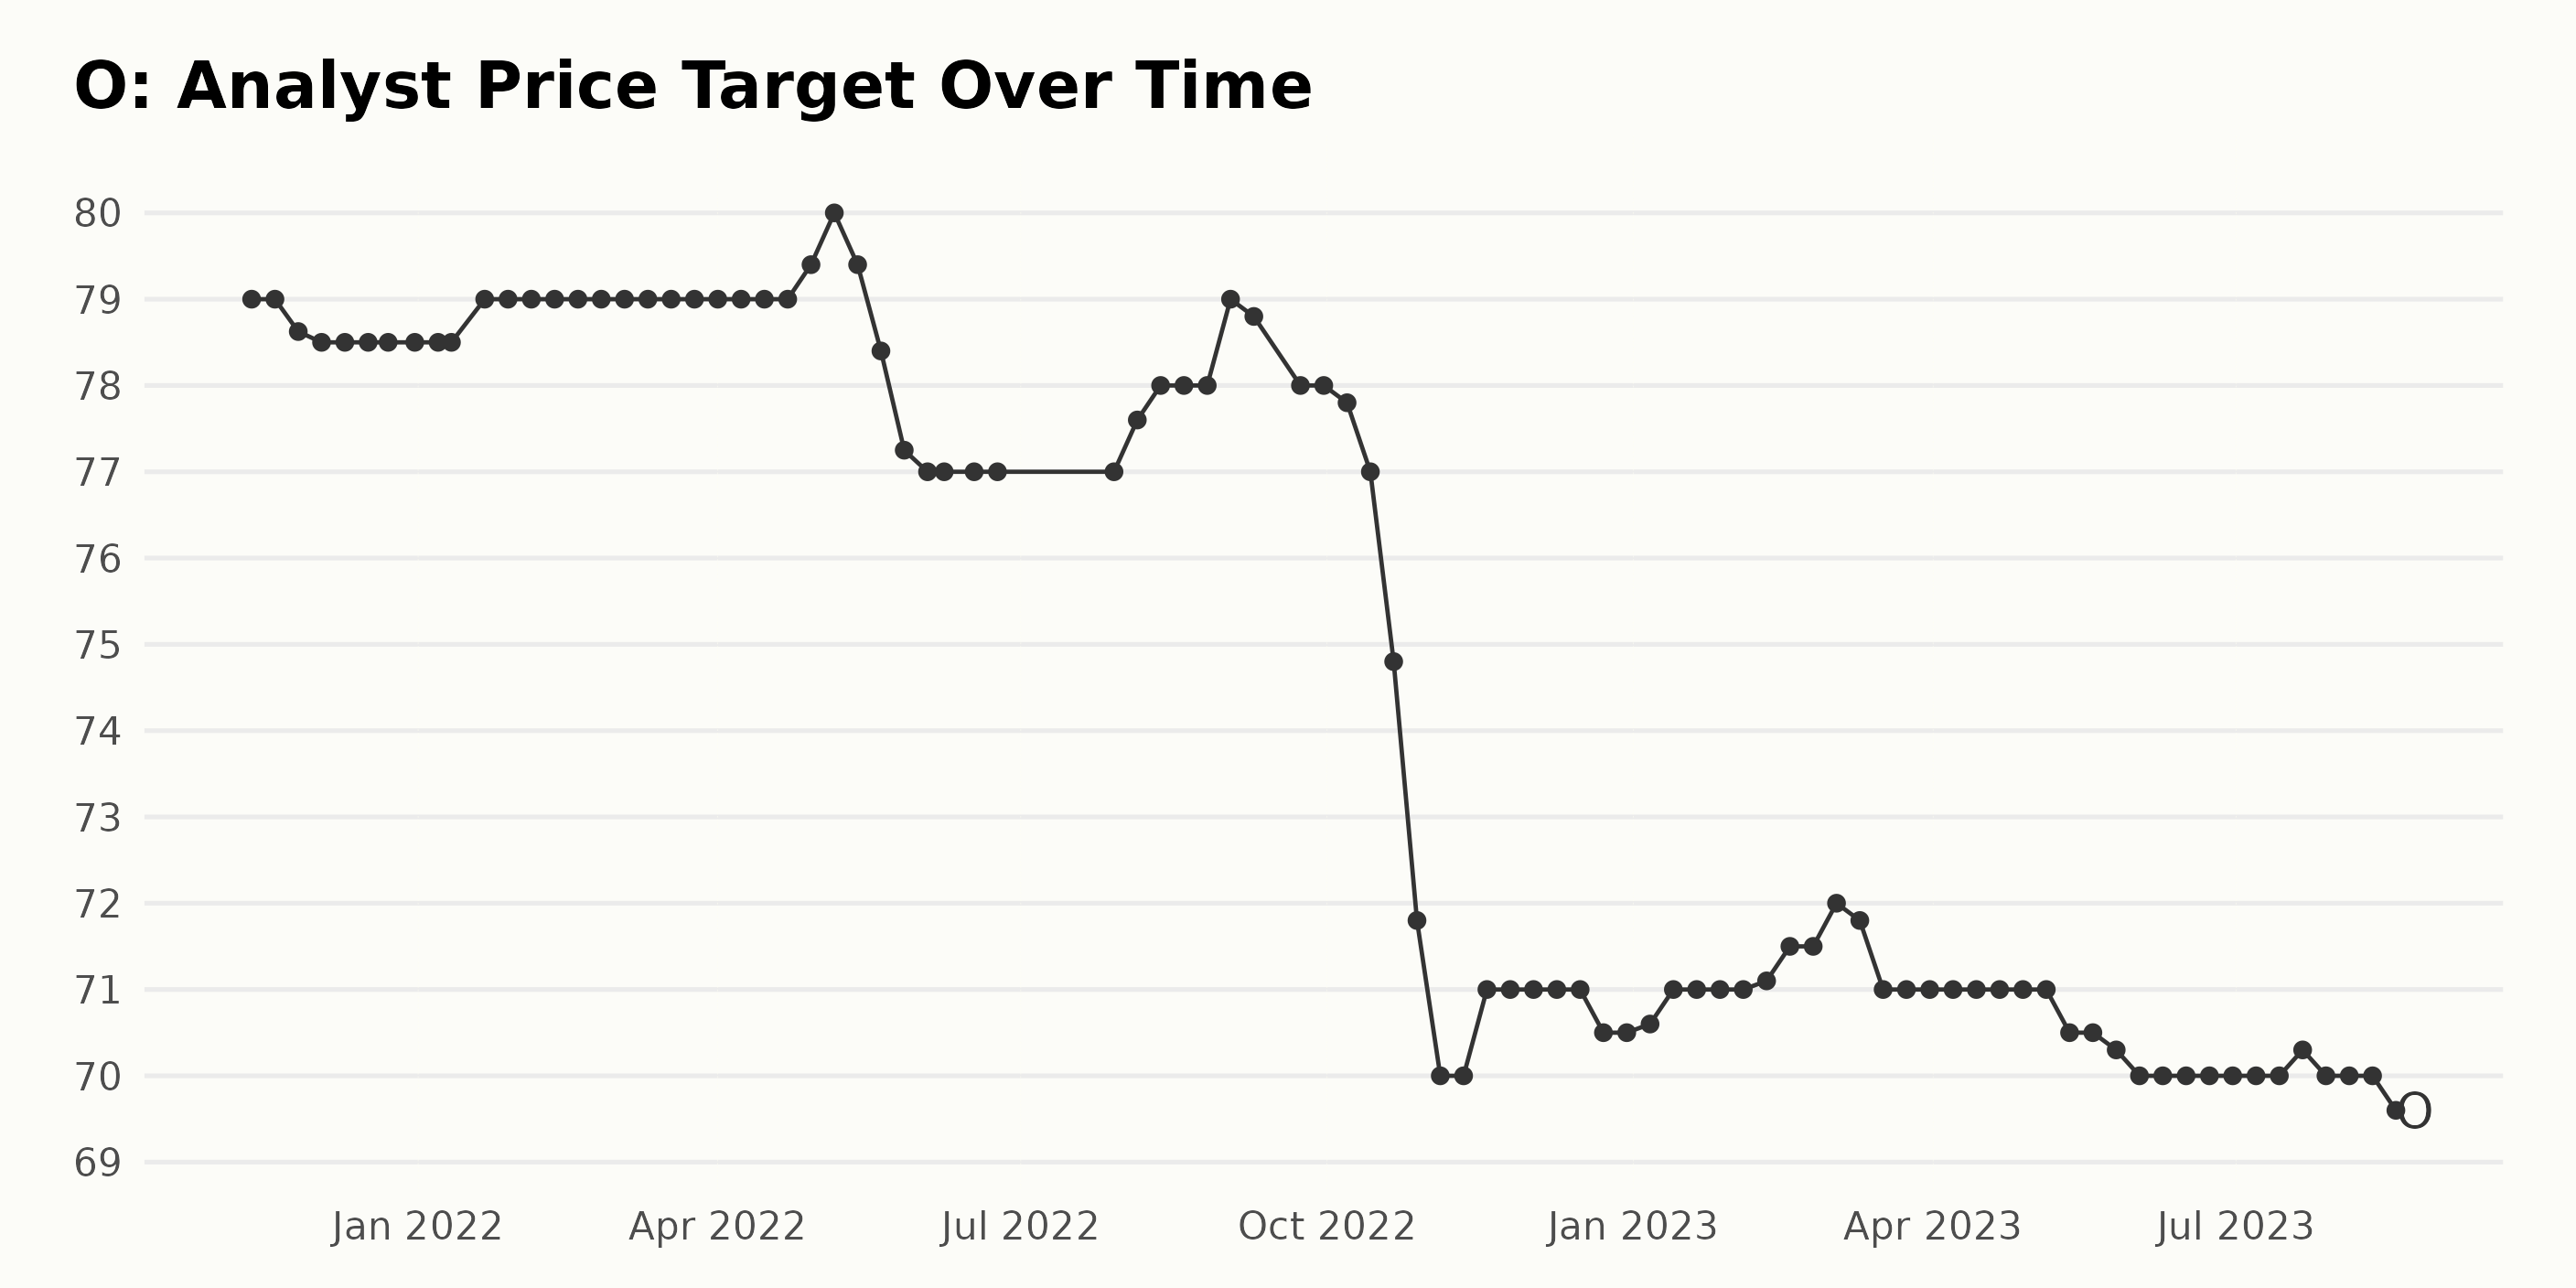
Examining the Analyst Price Target of O, we see the following summary of trends and fluctuations from November 12, 2021, to August 18, 2023:
- Initial Stability: The company saw stability in its price target, starting at $79 in November 2021 and slightly decreasing to $78.50 by December 2021 and remaining steady till mid-January 2022.
- Gentle Uptrend: From late January to April 2022, the analyst price target showed a minor uptrend, peaking at $80 in early May 2022.
- Notable Decline and Recovery: A noticeable downward trend occurred from May to November 2022, where the value dropped from $79.40 to $70. This was followed by a slight up-down fluctuation until the end of 2022.
- Minor Fluctuations: In 2023, the value fluctuated near $71 in the first quarter, slightly increased to $72 in early March, and then returned to around $71 later that month.
- Slight Downtrend: Subsequently, in May 2023, the value started a slight downtrend, reaching a low of $70 by June, with a minor recovery in July and then falling again to $69.60 by August 2023.
Normalized from the initial value (November 2021), the final value in August 2023 shows an approximate decline of 11.65%.
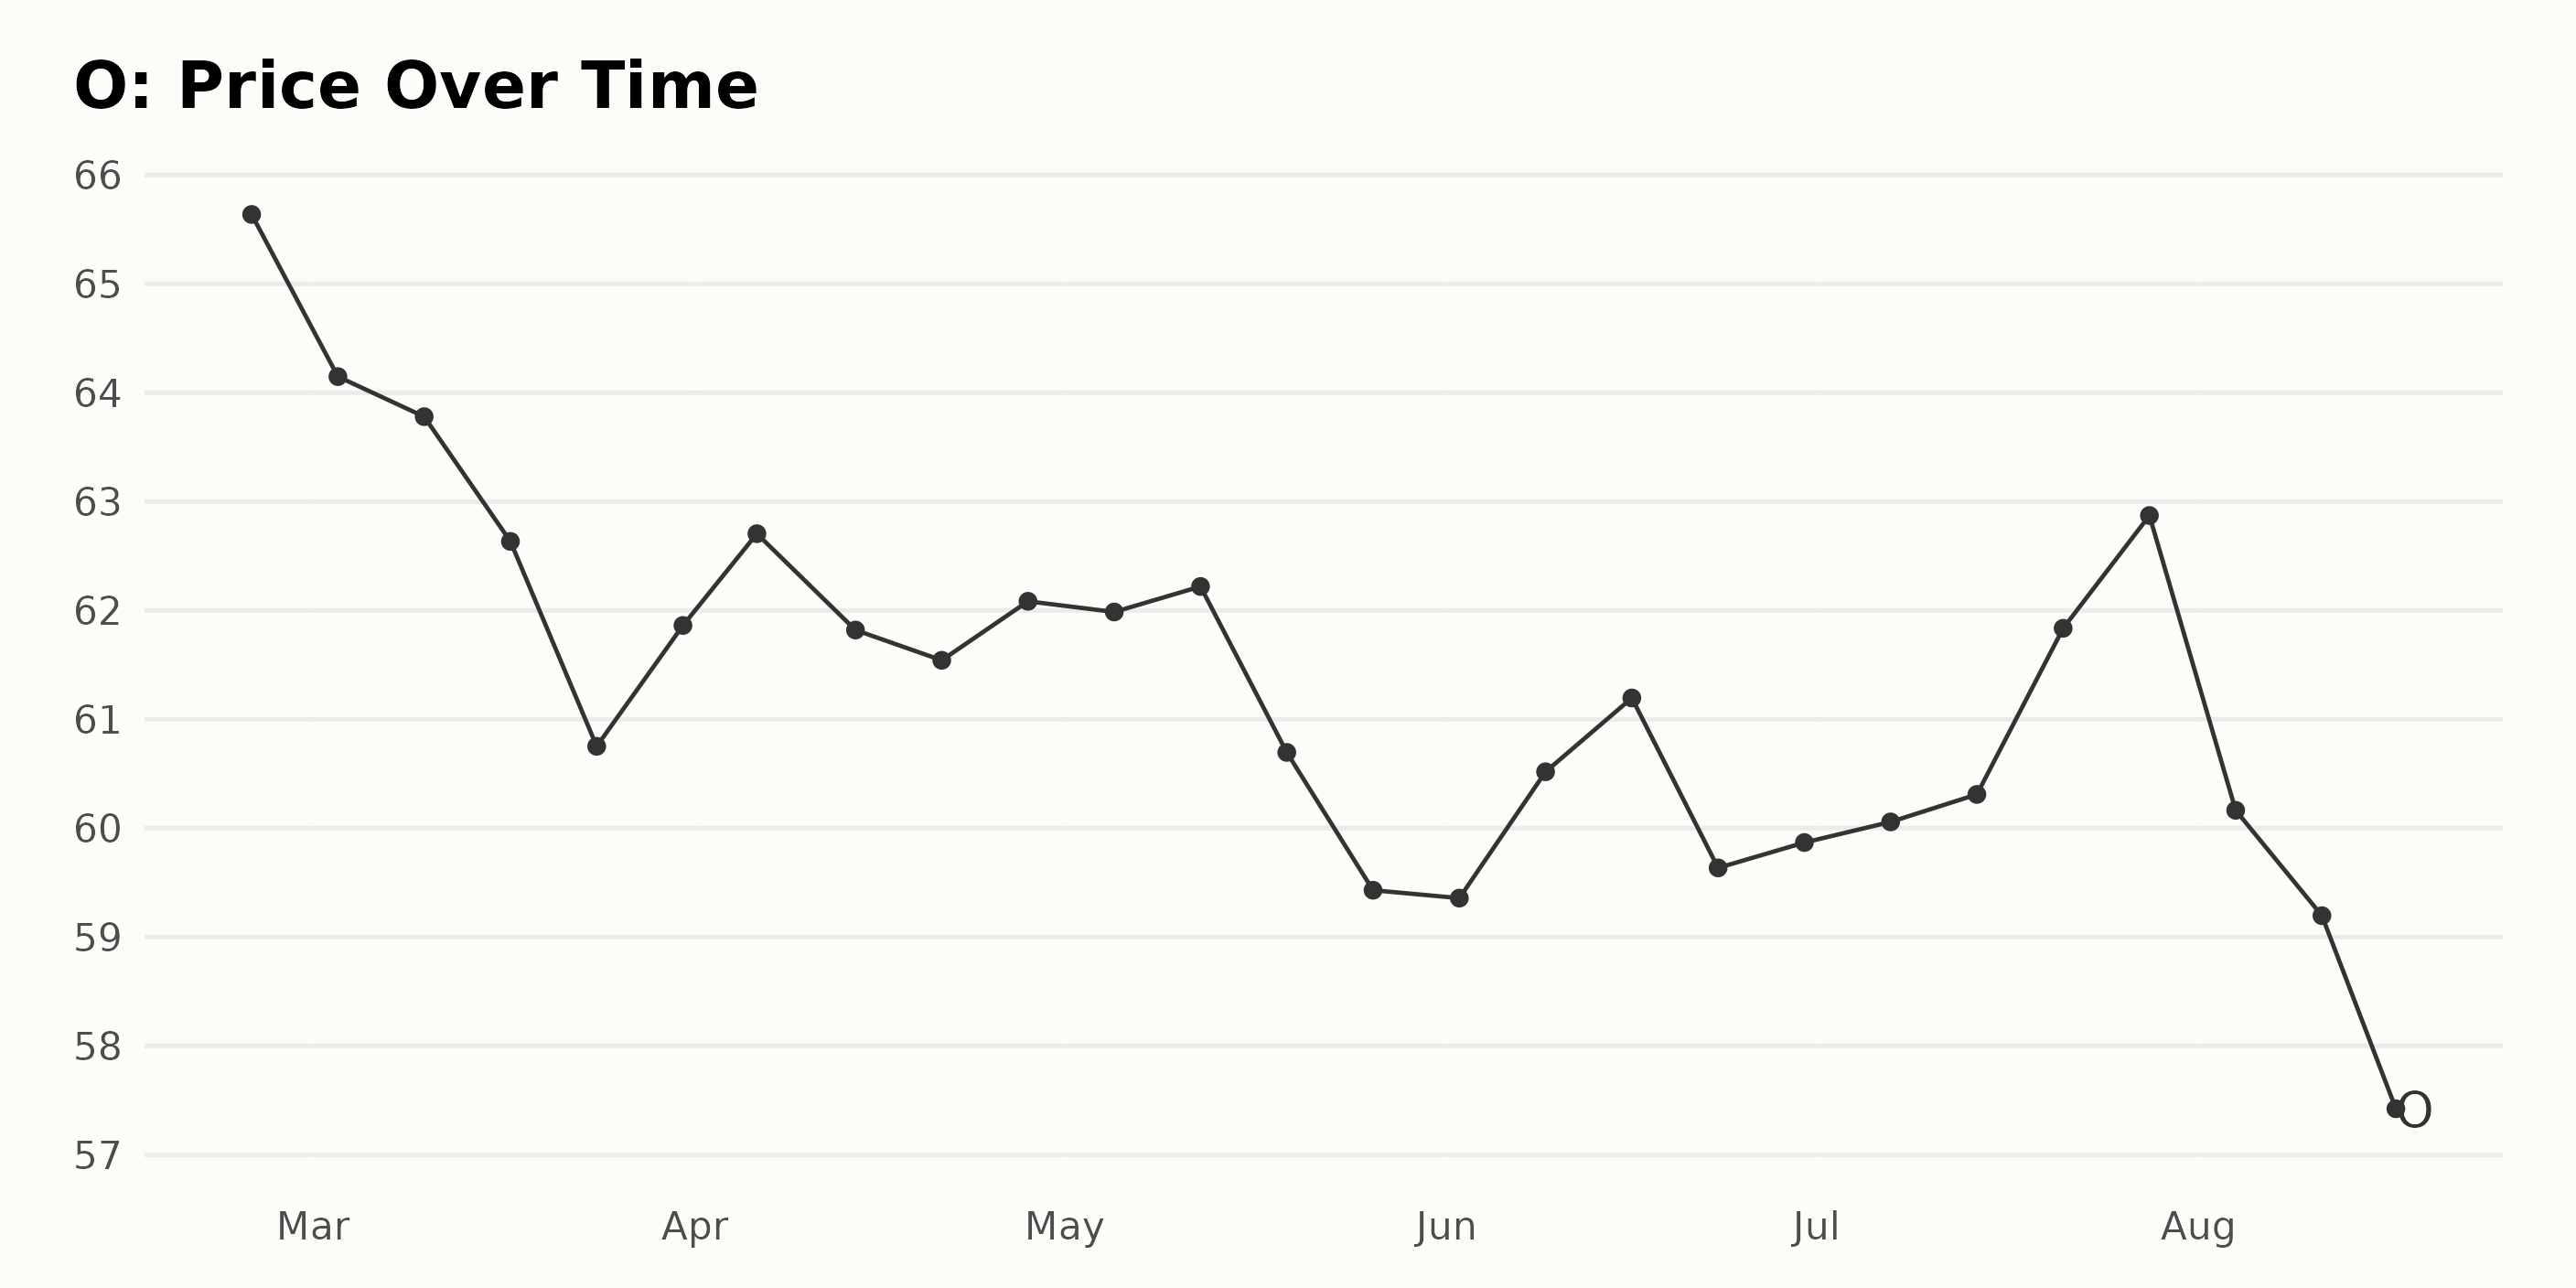
Tracking Realty Income Corporation’s Unsteady Share Price from February to August 2023
The share price of O shows a fluctuating trend from February to August 2023 based on the data provided.
- On February 24, 2023, the share price was $65.64.
- Throughout March, the price steadily decreases, ending the month at $61.86 on March 31, 2023.
- In April, the share price bobs slightly but ultimately ends the month, April 28, 2023, at $62.08.
- In May, prices experienced minor ups and downs, ending the month lower at $59.43 on May 26, 2023.
- The share price stays fairly consistent around the low $60 throughout June, with a slight dip towards the end of the month to $59.87 on June 30, 2023.
- July marks an upswing in price, peaking at $62.87 on July 28.
- However, the trend reverses in August, dropping significantly once more by mid-August to $56.88 on August 17, 2023.
From the data available, it can be deduced that there is a decelerating growth rate in the share price of O from July to August 2023. Despite sporadic increases, the price has showcased a general downward trend over this period. Here is a chart of O’s price over the past 180 days.
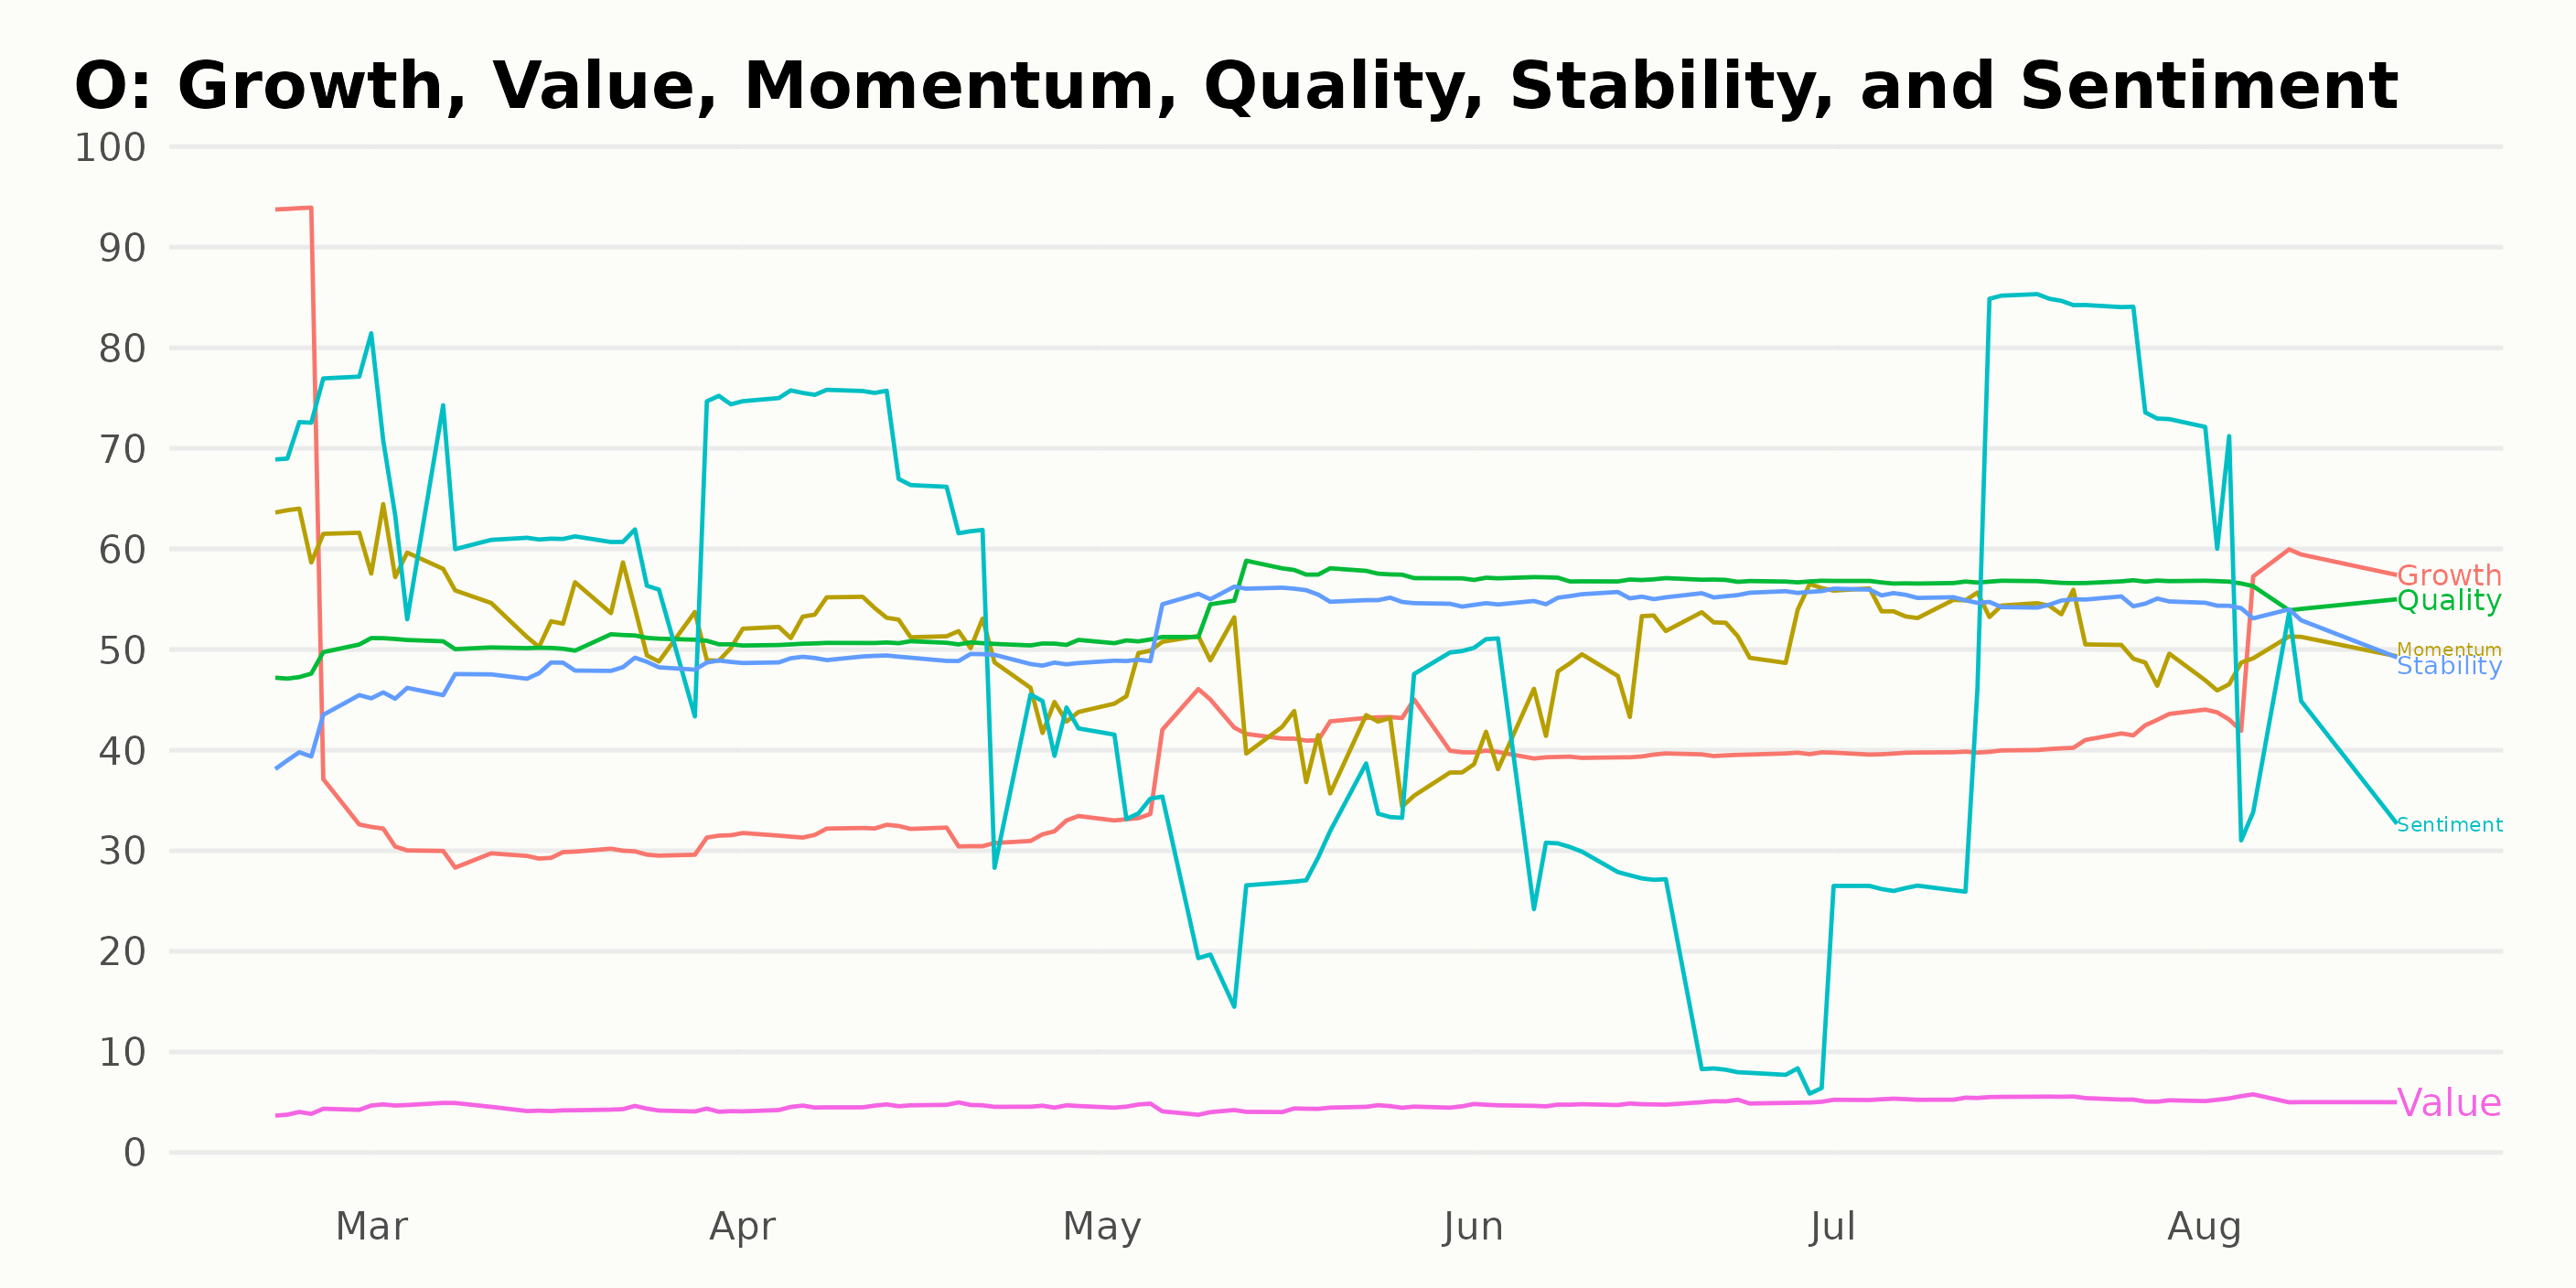
Realty Income Corporation’s POWR Ratings: Assessing Growth, Quality, and Stability
O has an overall D rating, translating to a Sell in our POWR Ratings system. It is ranked #24 out of the 30 stocks in the REITs – Retail category.
This present location suggests a less-than-optimal performance compared to other stocks within the REITs – Retail category.
In analyzing O based on the POWR Ratings, we can see that the three most noteworthy dimensions of Growth, Quality, and Stability consistently score the highest values over the examined period.
Growth
- In February 2023, the Growth dimension for O rested at a high of 74. However, there is a notice of a decline to a low of 30 in March 2023, and it remained somewhat steady around the mid-thirties and forties until it started to experience a moderate upward trend starting May 2023, reaching high forties by August 2023.
Quality
- The Quality rating displays a consistent but gradual improvement over the six months from February 2023 to August 2023. Starting at 48 in February 2023, the Quality dimension experienced an increase, achieving a peak of 57 in June and July 2023 and slightly dropping to 56 in August 2023.
Stability
- The Stability dimension was relatively low in February 2023, with a value of 41. However, it shows a clear improvement over the subsequent months reaching 55 in June and July and slightly declining to 53 in August 2023. The consistent values over the summer months indicate a stable phase for Realty Income Corporation in this dimension.
Stocks to Consider Instead of Realty Income Corporation (O)
Other stocks in the REITs – Retail sector that may be worth considering are Alexander’s Inc. (ALX), Saul Centers Inc. (BFS), and Simon Property Group Inc. (SPG) — they have better POWR Ratings.
43 Year Investment Pro Shares Top Picks
Steve Reitmeister is best known for his timely market outlooks & unique trading plans to stay on the right side of the market action. Click below to get his latest insights…
Steve Reitmeister’s Trading Plan & Top Picks >
Want More Great Investing Ideas?
O shares were unchanged in premarket trading Friday. Year-to-date, O has declined -7.73%, versus a 14.94% rise in the benchmark S&P 500 index during the same period.
About the Author: Subhasree Kar

Subhasree’s keen interest in financial instruments led her to pursue a career as an investment analyst. After earning a Master’s degree in Economics, she gained knowledge of equity research and portfolio management at Finlatics. More...
More Resources for the Stocks in this Article
| Ticker | POWR Rating | Industry Rank | Rank in Industry |
| O | Get Rating | Get Rating | Get Rating |
| ALX | Get Rating | Get Rating | Get Rating |
| BFS | Get Rating | Get Rating | Get Rating |
| SPG | Get Rating | Get Rating | Get Rating |


