Major pharmaceutical corporation Pfizer Inc. (PFE) recently channeled $25 million into acquiring a minority interest in Caribou Biosciences, Inc. (CRBU). This move aligns with previous strategies PFE has pursued over recent years, utilizing the substantial cash flow it generated from its COVID-19 product sales.
Despite this strong position, Credit Suisse analyst Trung Huynh downgraded the stock to a ‘Hold’ rating due to what he predicts as upcoming uncertainties and “limited pipeline catalysts.” Notwithstanding, he also recognized the attractiveness of the stock’s valuation.
In terms of forward P/E, PFE is trading at 13.00x, 51.9% lower than the industry average of 27.04x. The stock’s forward EV/EBITDA multiple of 9.01 is 31.9% lower than the 13.22 industry multiple. Its forward Price/Cash Flow ratio of 10.88x is 29.9% lower than the 15.53x industry average.
PFE closed its last trading session at $35.53, lower than its 50-day moving average of $38.07 and 200-day moving average of $43.27, indicating a downtrend.
Considering these factors, it’s worth analyzing some of Pfizer’s key financial metrics to understand why delaying entry into the stock may be a prudent move.
Analyzing Financial Performance of Pfizer Inc.: A Comprehensive Look at Key Metrics from 2020 to 2023
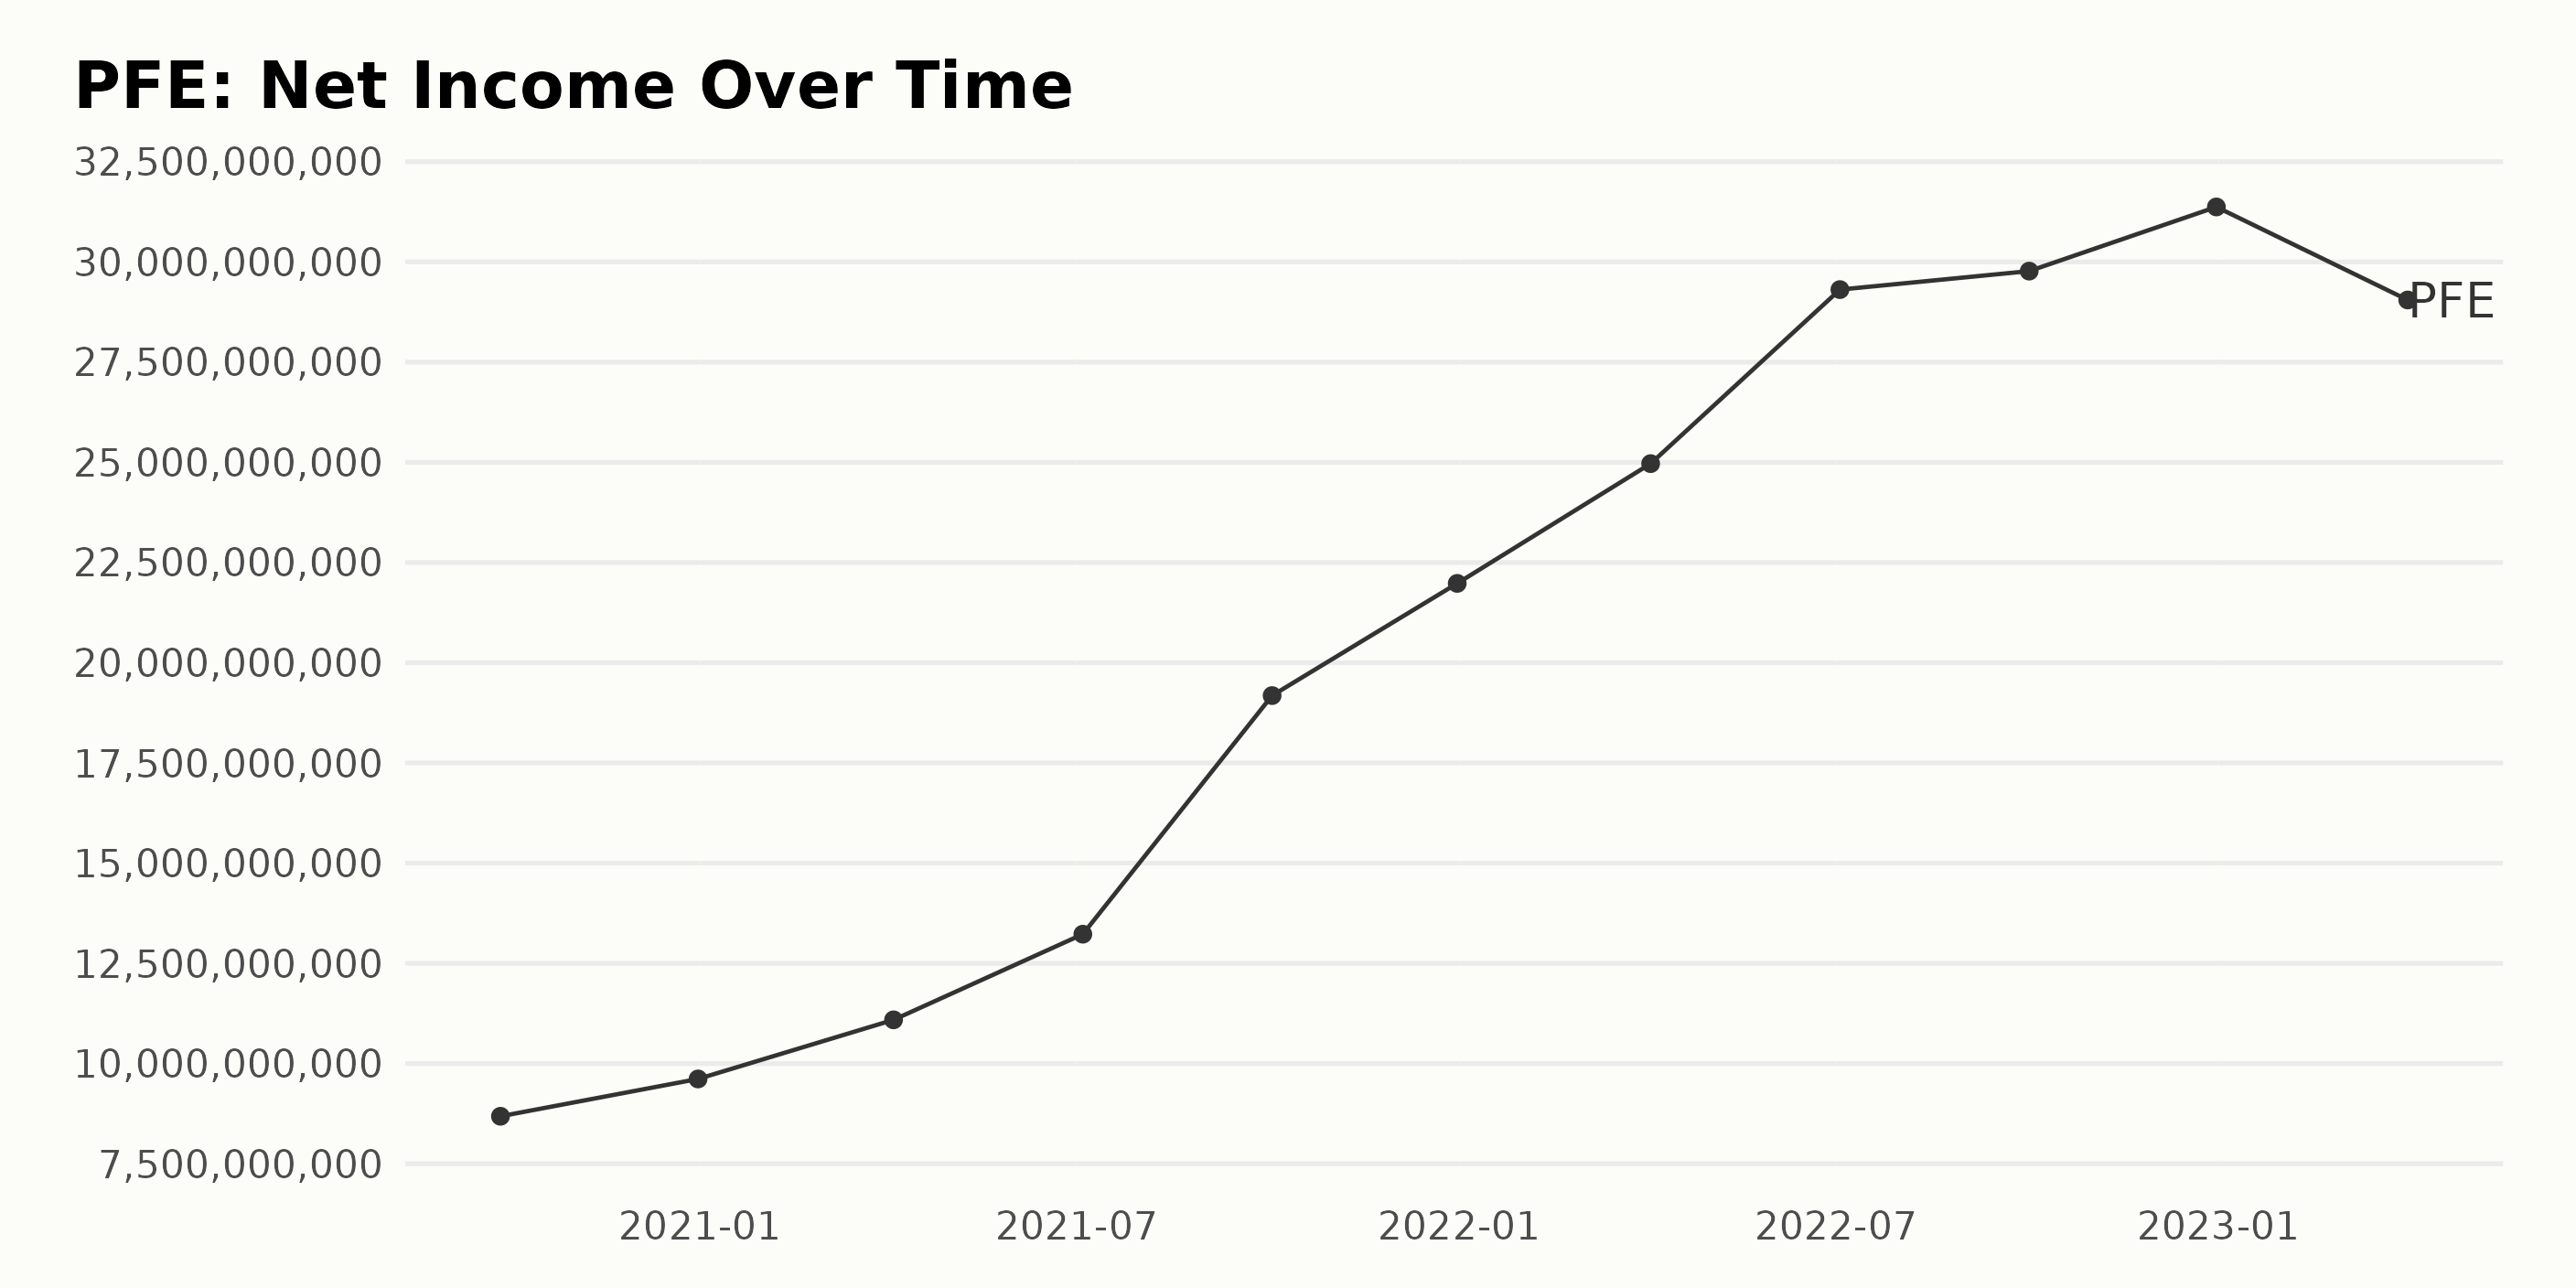
The trailing-12-month net income of PFE has shown a generally upward trend with some fluctuations from September 27, 2020, to April 2, 2023. Details are as follows:
- As of September 27, 2020, net income stood at $8.68 billion.
- This value then rose to $31.37 billion by December 31, 2022, marking significant growth.
- In the period between these two dates, there were several ups and downs, with the highest increase observed between July 4, 2021 ($13.23 billion) and October 3, 2021 ($19.18 billion).
- The last quarter of 2022 saw another notable leap when net income jumped from $29.77 billion on October 2, 2022, to $31.37 billion on December 31, 2022.
- However, there was a dip in the most recent value, as net income dropped to $29.05 billion on April 2, 2023, from its previous peak.
Overall, the growth rate from September 27, 2020, to April 2, 2023, is approximately 234.50%, indicating strong financial performance for this publicly traded company despite the fluctuations.
Impressively, PFE’s highest recorded net income within this series was seen on December 31, 2022, with a significant amount of $31.37 billion. This indicates a moment of peak profitability for the company, even though it wasn’t sustained into the following year. The extent of such fluctuations emphasizes the company’s dynamic financial circumstances during this period.
The recent drop in net income as of April 2, 2023, deserves attention as it may signal a trend reversal or a temporary downturn due to particular business conditions. However, in the longer-term context, PFE still demonstrates strong net income growth.
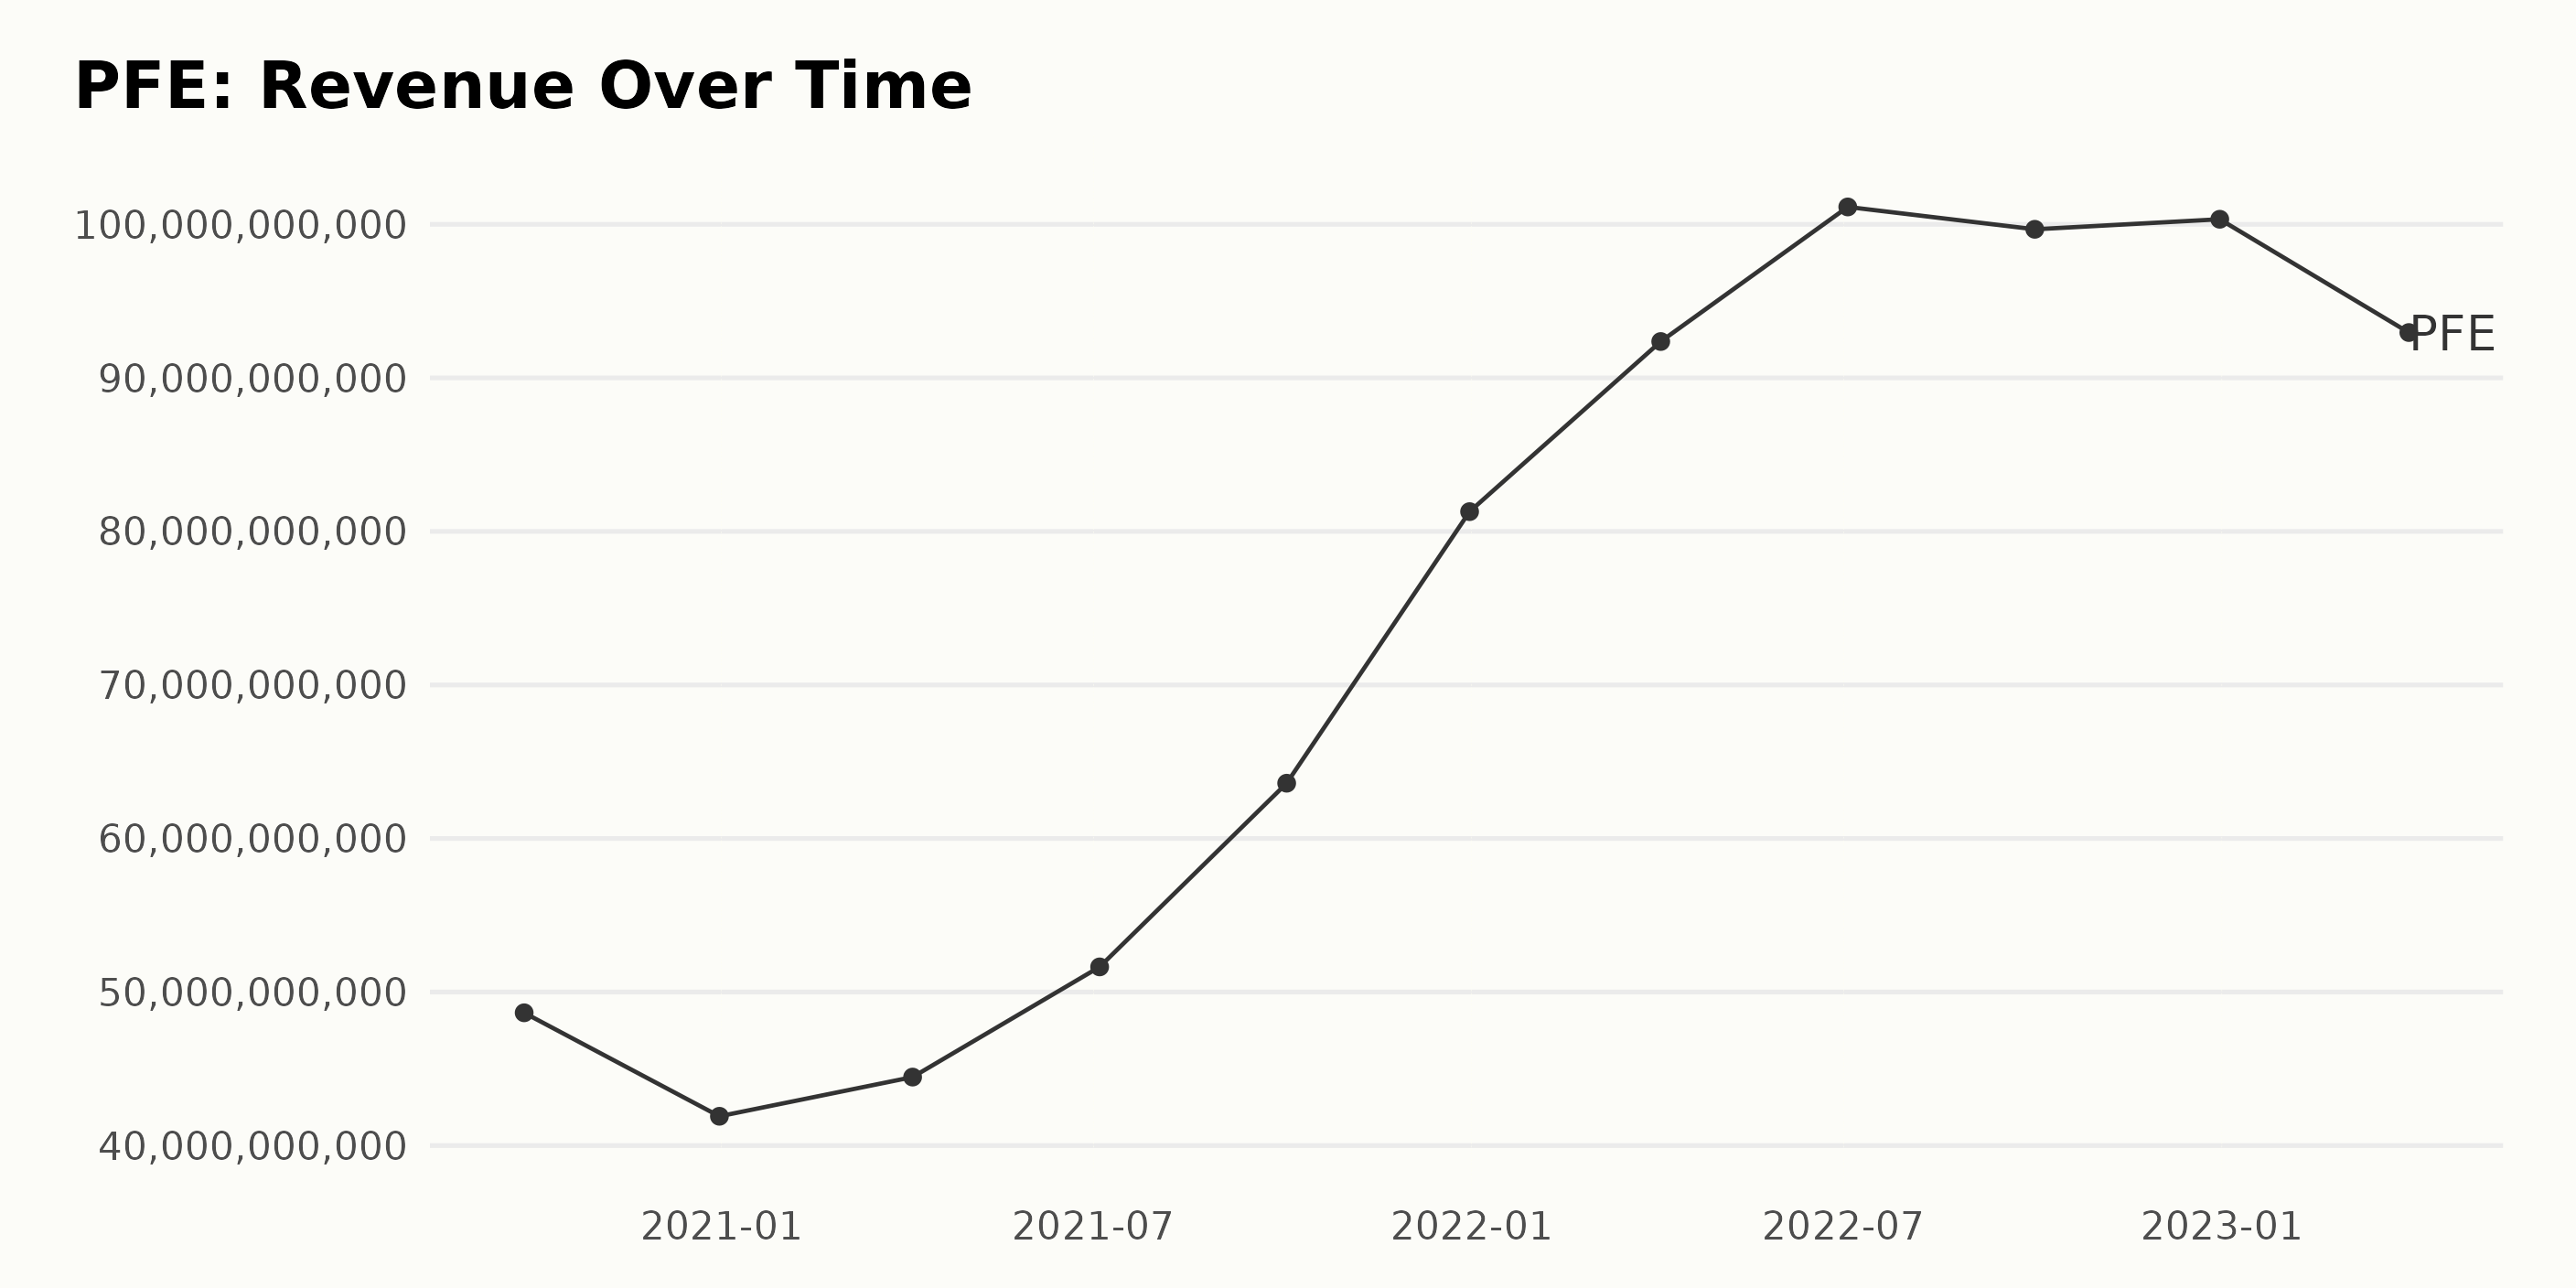
The trend for PFE’s trailing-12-month revenue reveals a mostly upward trajectory from September 2020 to the last value in April 2023, punctuated by some fluctuations. Here’s a breakdown:
- In September 2020, revenue was reported at $48.65 billion.
- There was a drop by the end of 2020, with December 2020 figures showing revenue of $41.91 billion.
- A general increase began in 2021. By April 2021, it rose to $44.46 billion, $51.64 billion in July, and $63.60 billion in October.
- The growth continued in 2022, peaking at $101.13 billion in July 2022, a stark rise from $48.65 billion in September 2020.
- However, there was a slight decrease to $99.68 billion in October 2022, climbing again marginally to $100.33 billion by December 2022.
- The most recent data in April 2023 shows another decline, with revenue sitting at $92.95 billion.
Despite fluctuations and periodic drops, PFE’s revenue demonstrated strong overall growth between September 2020 and April 2023. When measured from the first recorded figure to the last, the growth rate signifies an increase of approximately 91.02%.
Emphasizing more recent data, we see a downturn in revenue from the peak of July 2022 to April 2023, when the revenue fell from $101.13 billion to $92.95 billion.
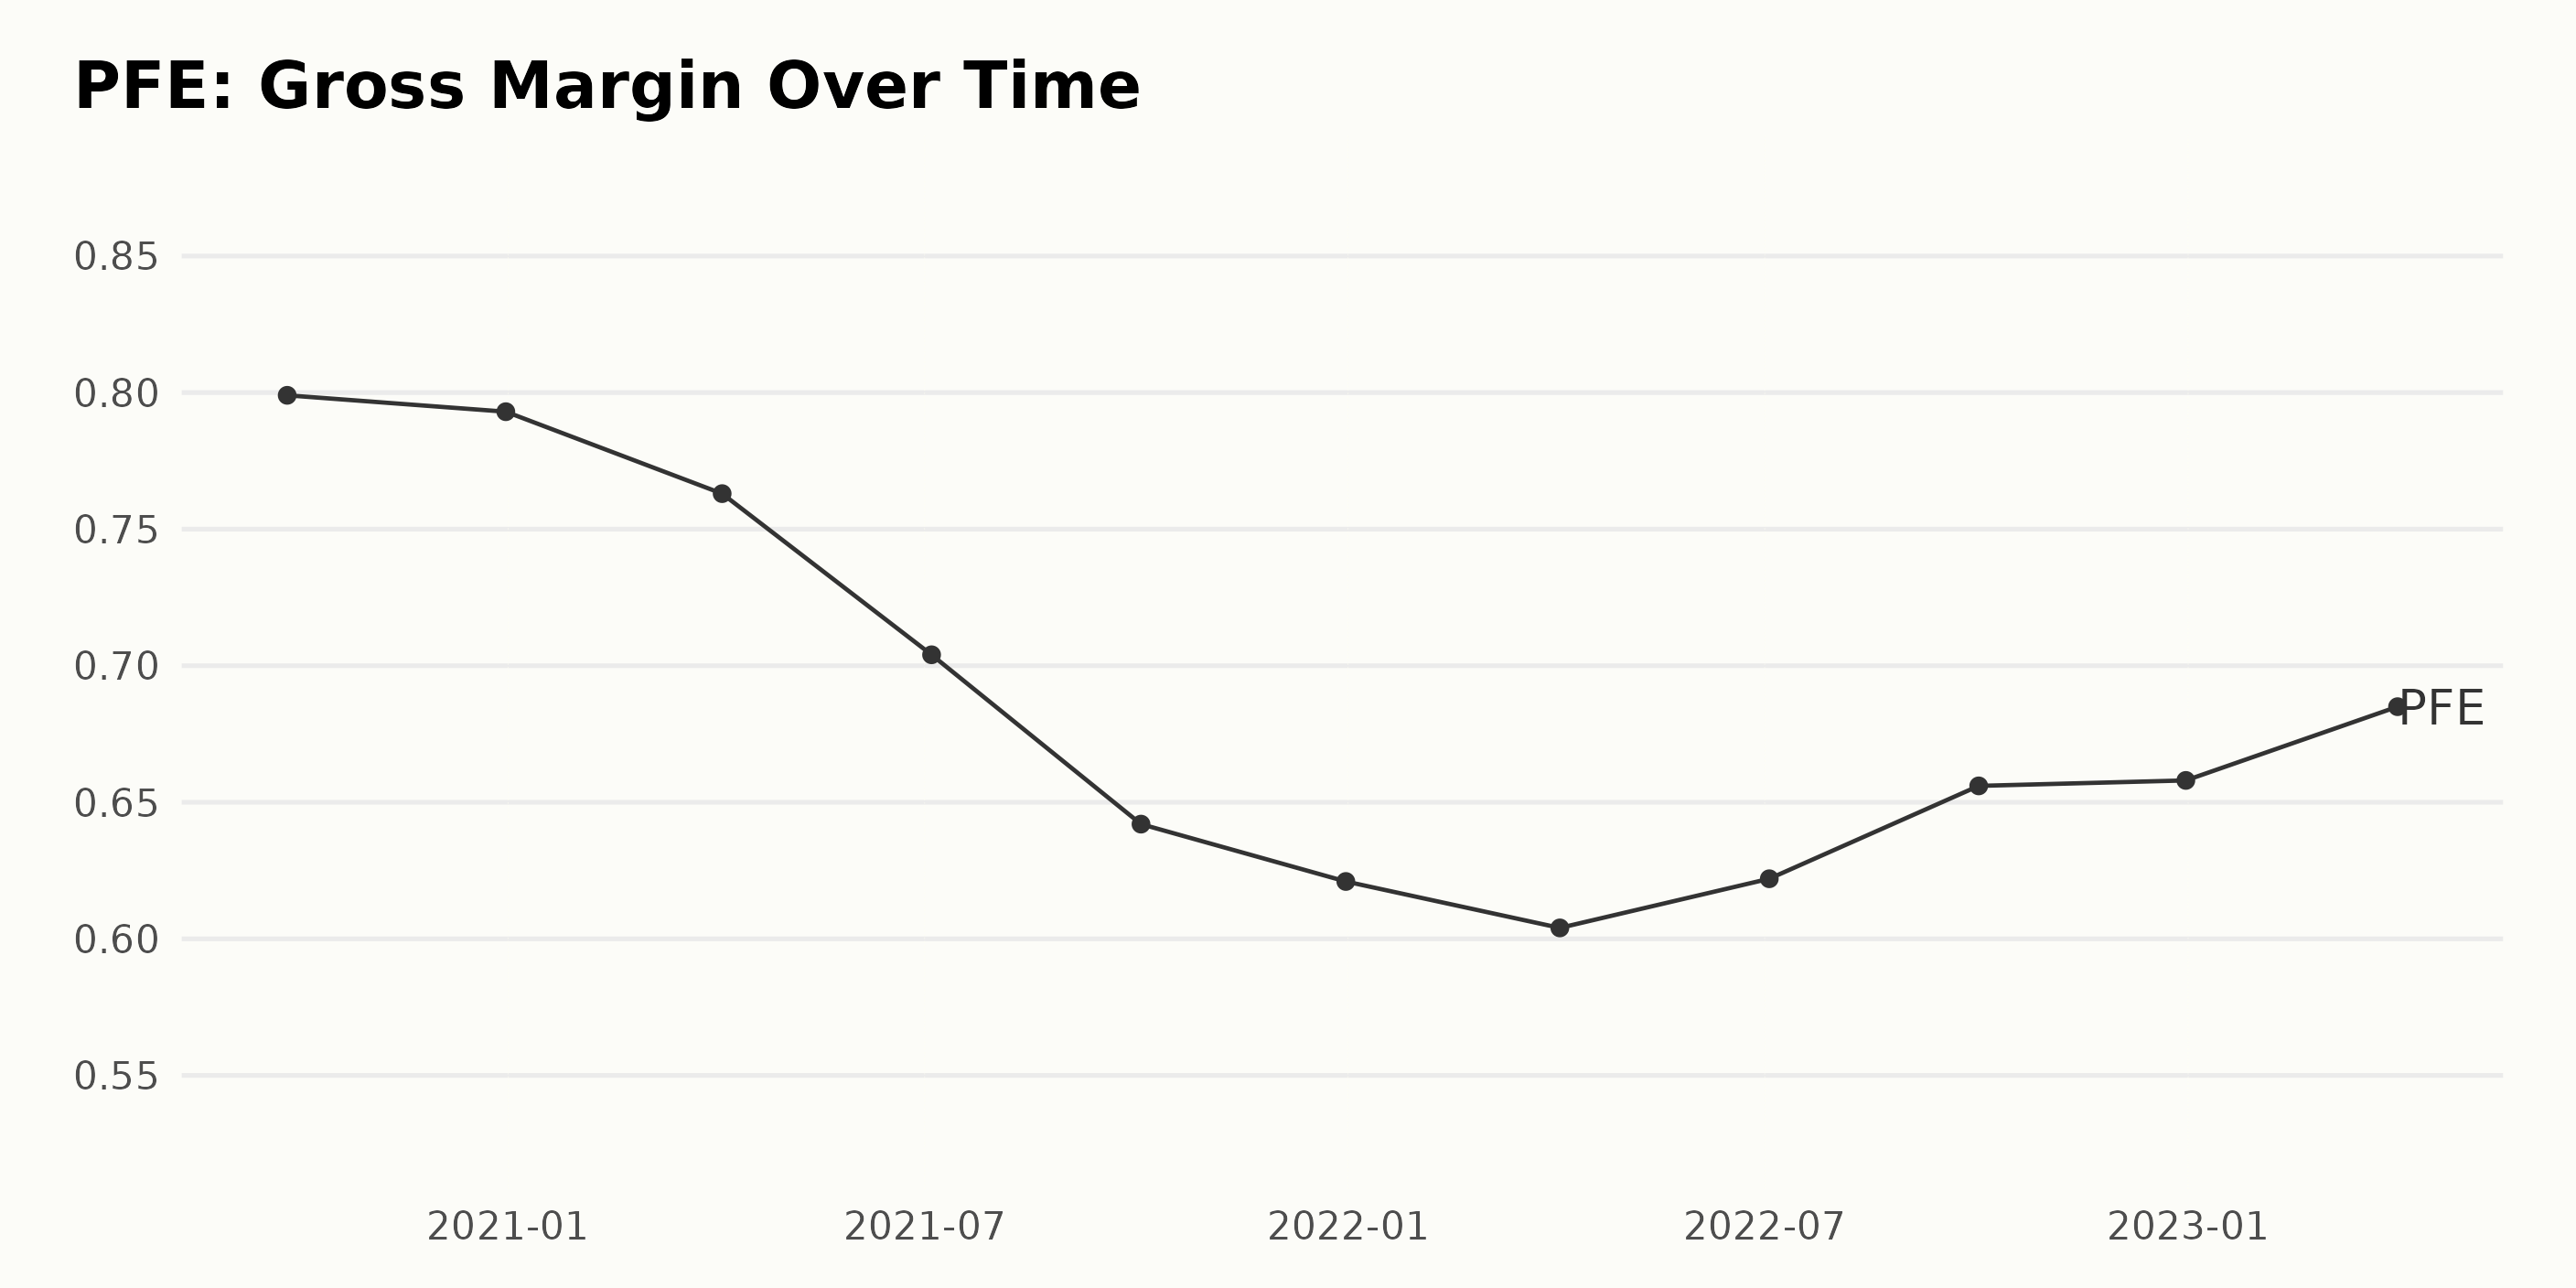
In the observed period, PFE’s gross margin demonstrated a generally declining trend with intermittent periods of growth. The data spans from September 27, 2020, to April 2, 2023. Emphasizing more recent figures:
- As of September 27, 2020, the gross margin was reported at 79.90%.
- It then decreased to 79.30% by December 31, 2020.
- A significant drop was noted by April 4, 2021, placing the gross margin at 76.30%.
- Consequently, the gross margin further declined throughout 2021, reaching 70.40% by July 4, 64.20% by October 3, and eventually settling at 62.10% by the end of the year on December 31, 2021.
- The downward trend continued into the first quarter of 2022, falling to 60.40% by April 3.
- However, an uptick was observed in the summer, increasing the gross margin to 62.20% by July 3, 2022.
- This upward trend persisted, reaching 65.60% by October 2, and maintained at 65.80% by the end of 2022.
- As of the most recent data point on April 2, 2023, the gross margin experienced a boost, landing at 68.50%.
Despite the fluctuations seen over the series, PFE’s overall gross margin showed a decrease from September 2020 to April 2023. The growth rate measured from these points indicates a decrease of approximately 11.4% during this period. However, it is intriguing to note the noticeable recovery in the gross margin in the latter part of the series, notably from July 2022 onwards.
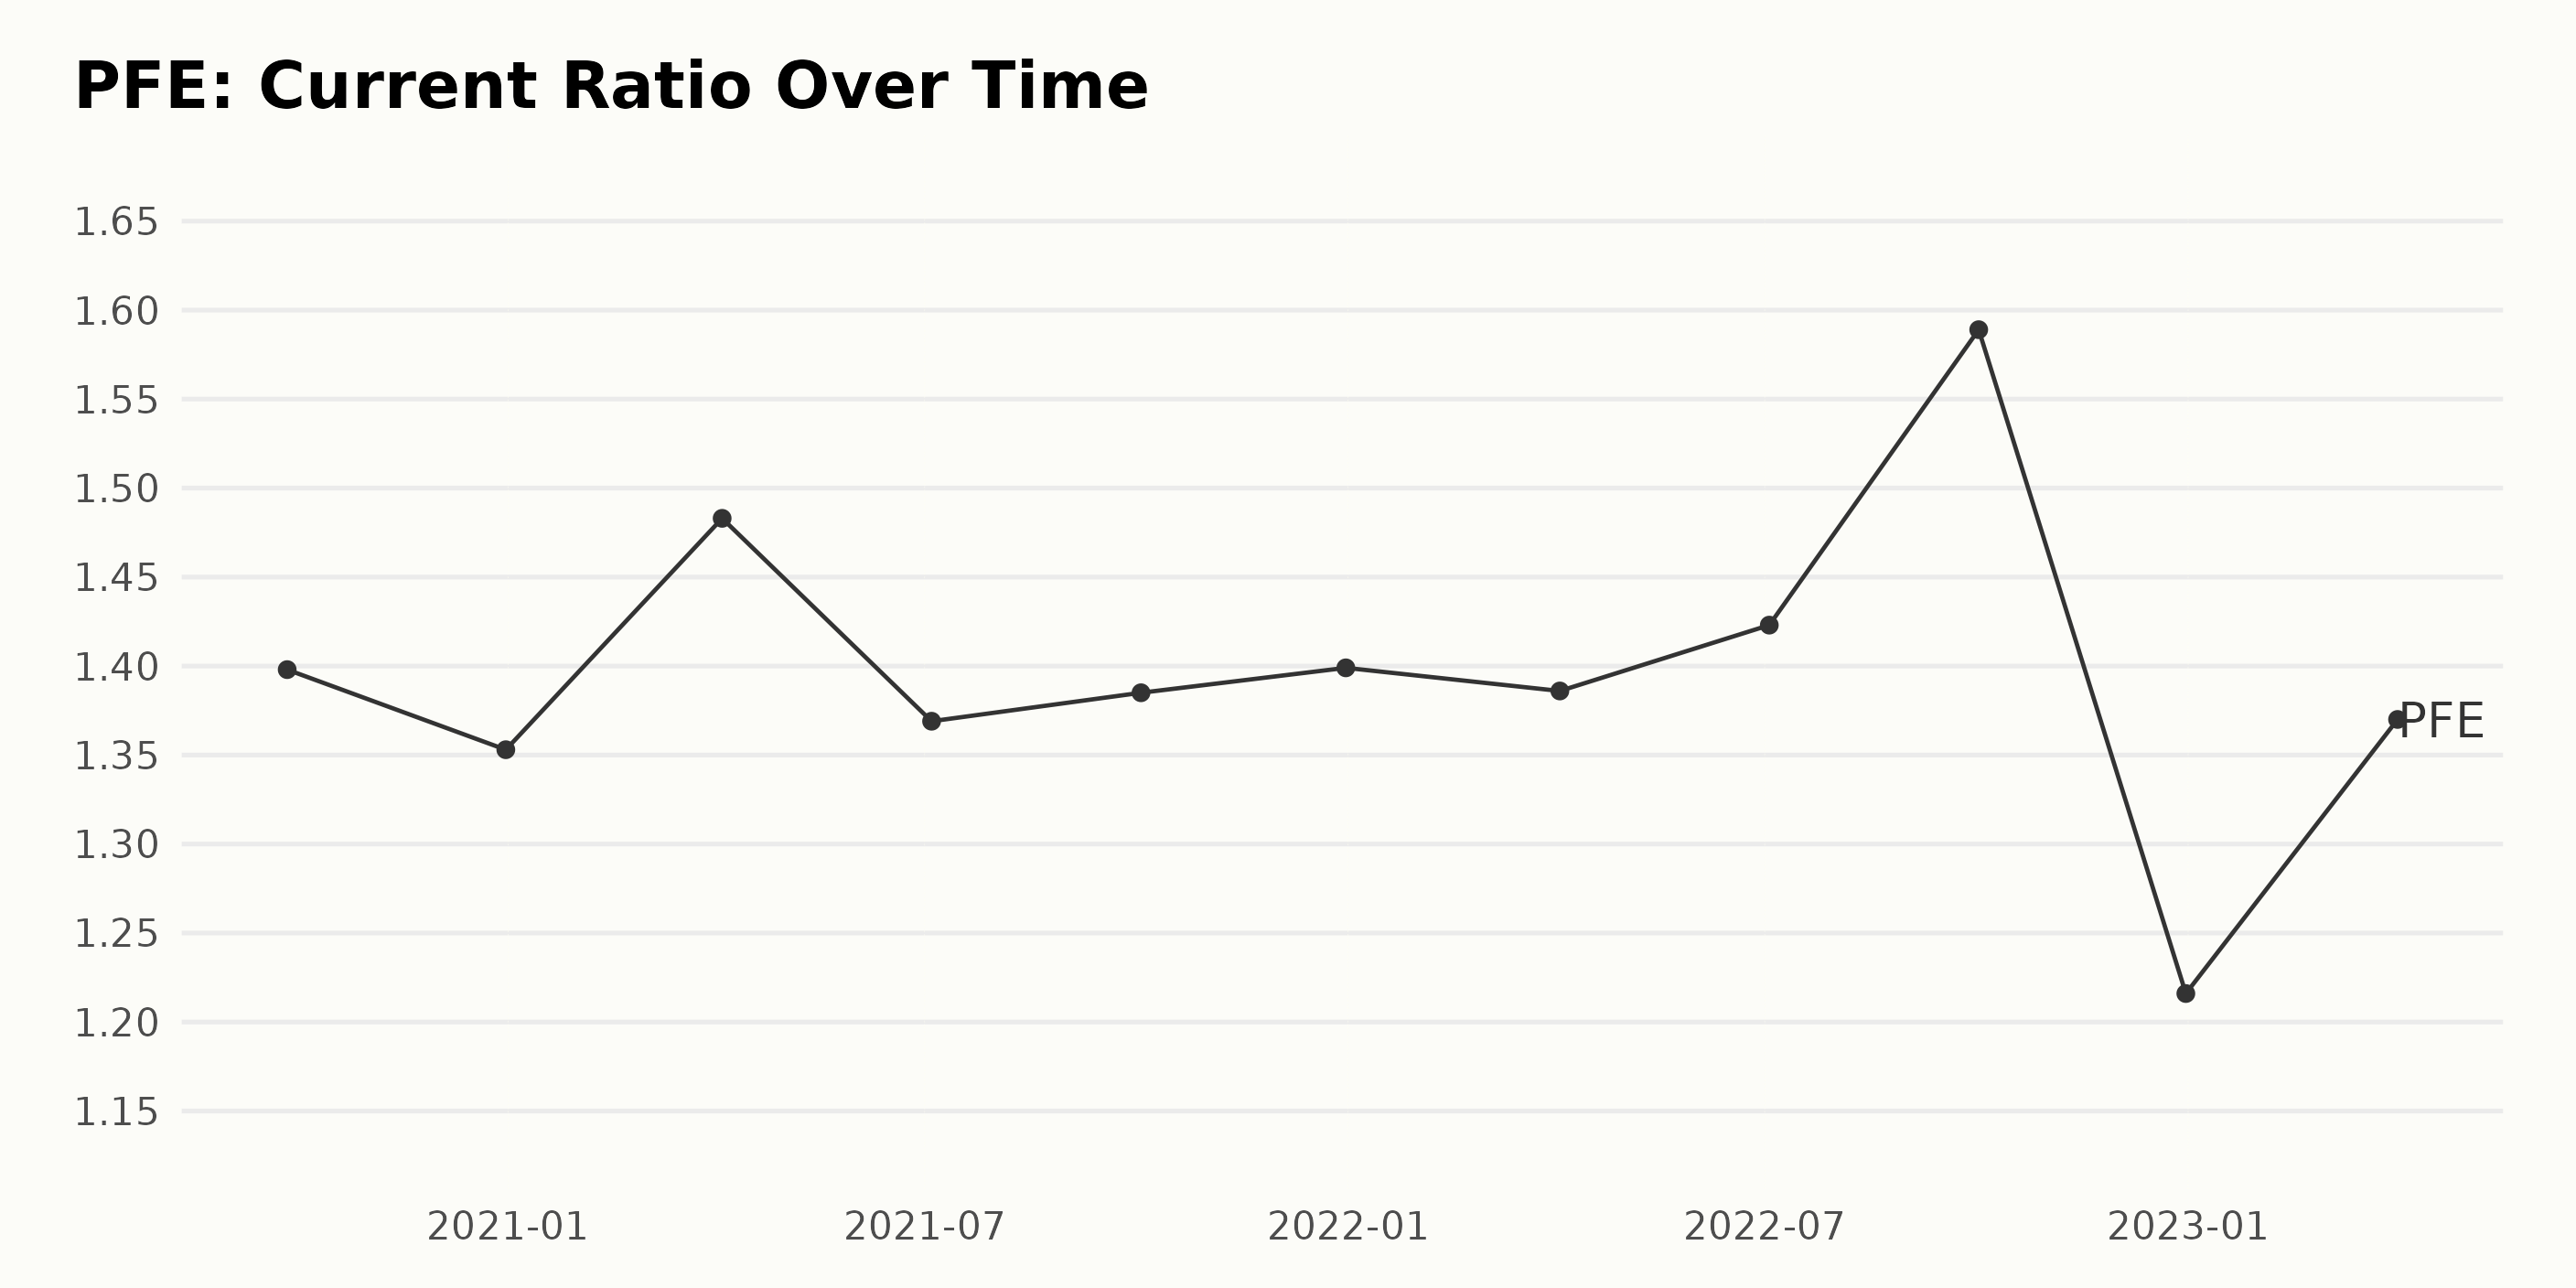
The following analysis concerns PFE’s current ratio:
- In September 2020, the current ratio was at 1.40.
- There was a minor decrease in the current ratio to 1.35 by December 2020.
- The ratio began an upward trend in 2021, reaching 1.48 in April, but it faced a slight dip to 1.37 in July.
- As we approached the end of 2021, the current ratio stayed relatively unchanged between October (1.39) and December (1.40).
- Starting in 2022, there was an irregularity in the current ratio— it peaked at 1.59 in October, then fell sharply to 1.22 in December, showing the largest fluctuation within two months.
- As of the most recent data from April 2023, the current ratio is back up, standing at 1.37.
Calculating the growth rate from the first value in September 2020 to the last in April 2023 gives a negative rate, indicating a slight decline over this period. However, considering the volatility marked by significant peaks and troughs throughout the series, the current ratio of PFE has displayed various trends. The marked drop in December 2022 stands out, which may require further investigation.
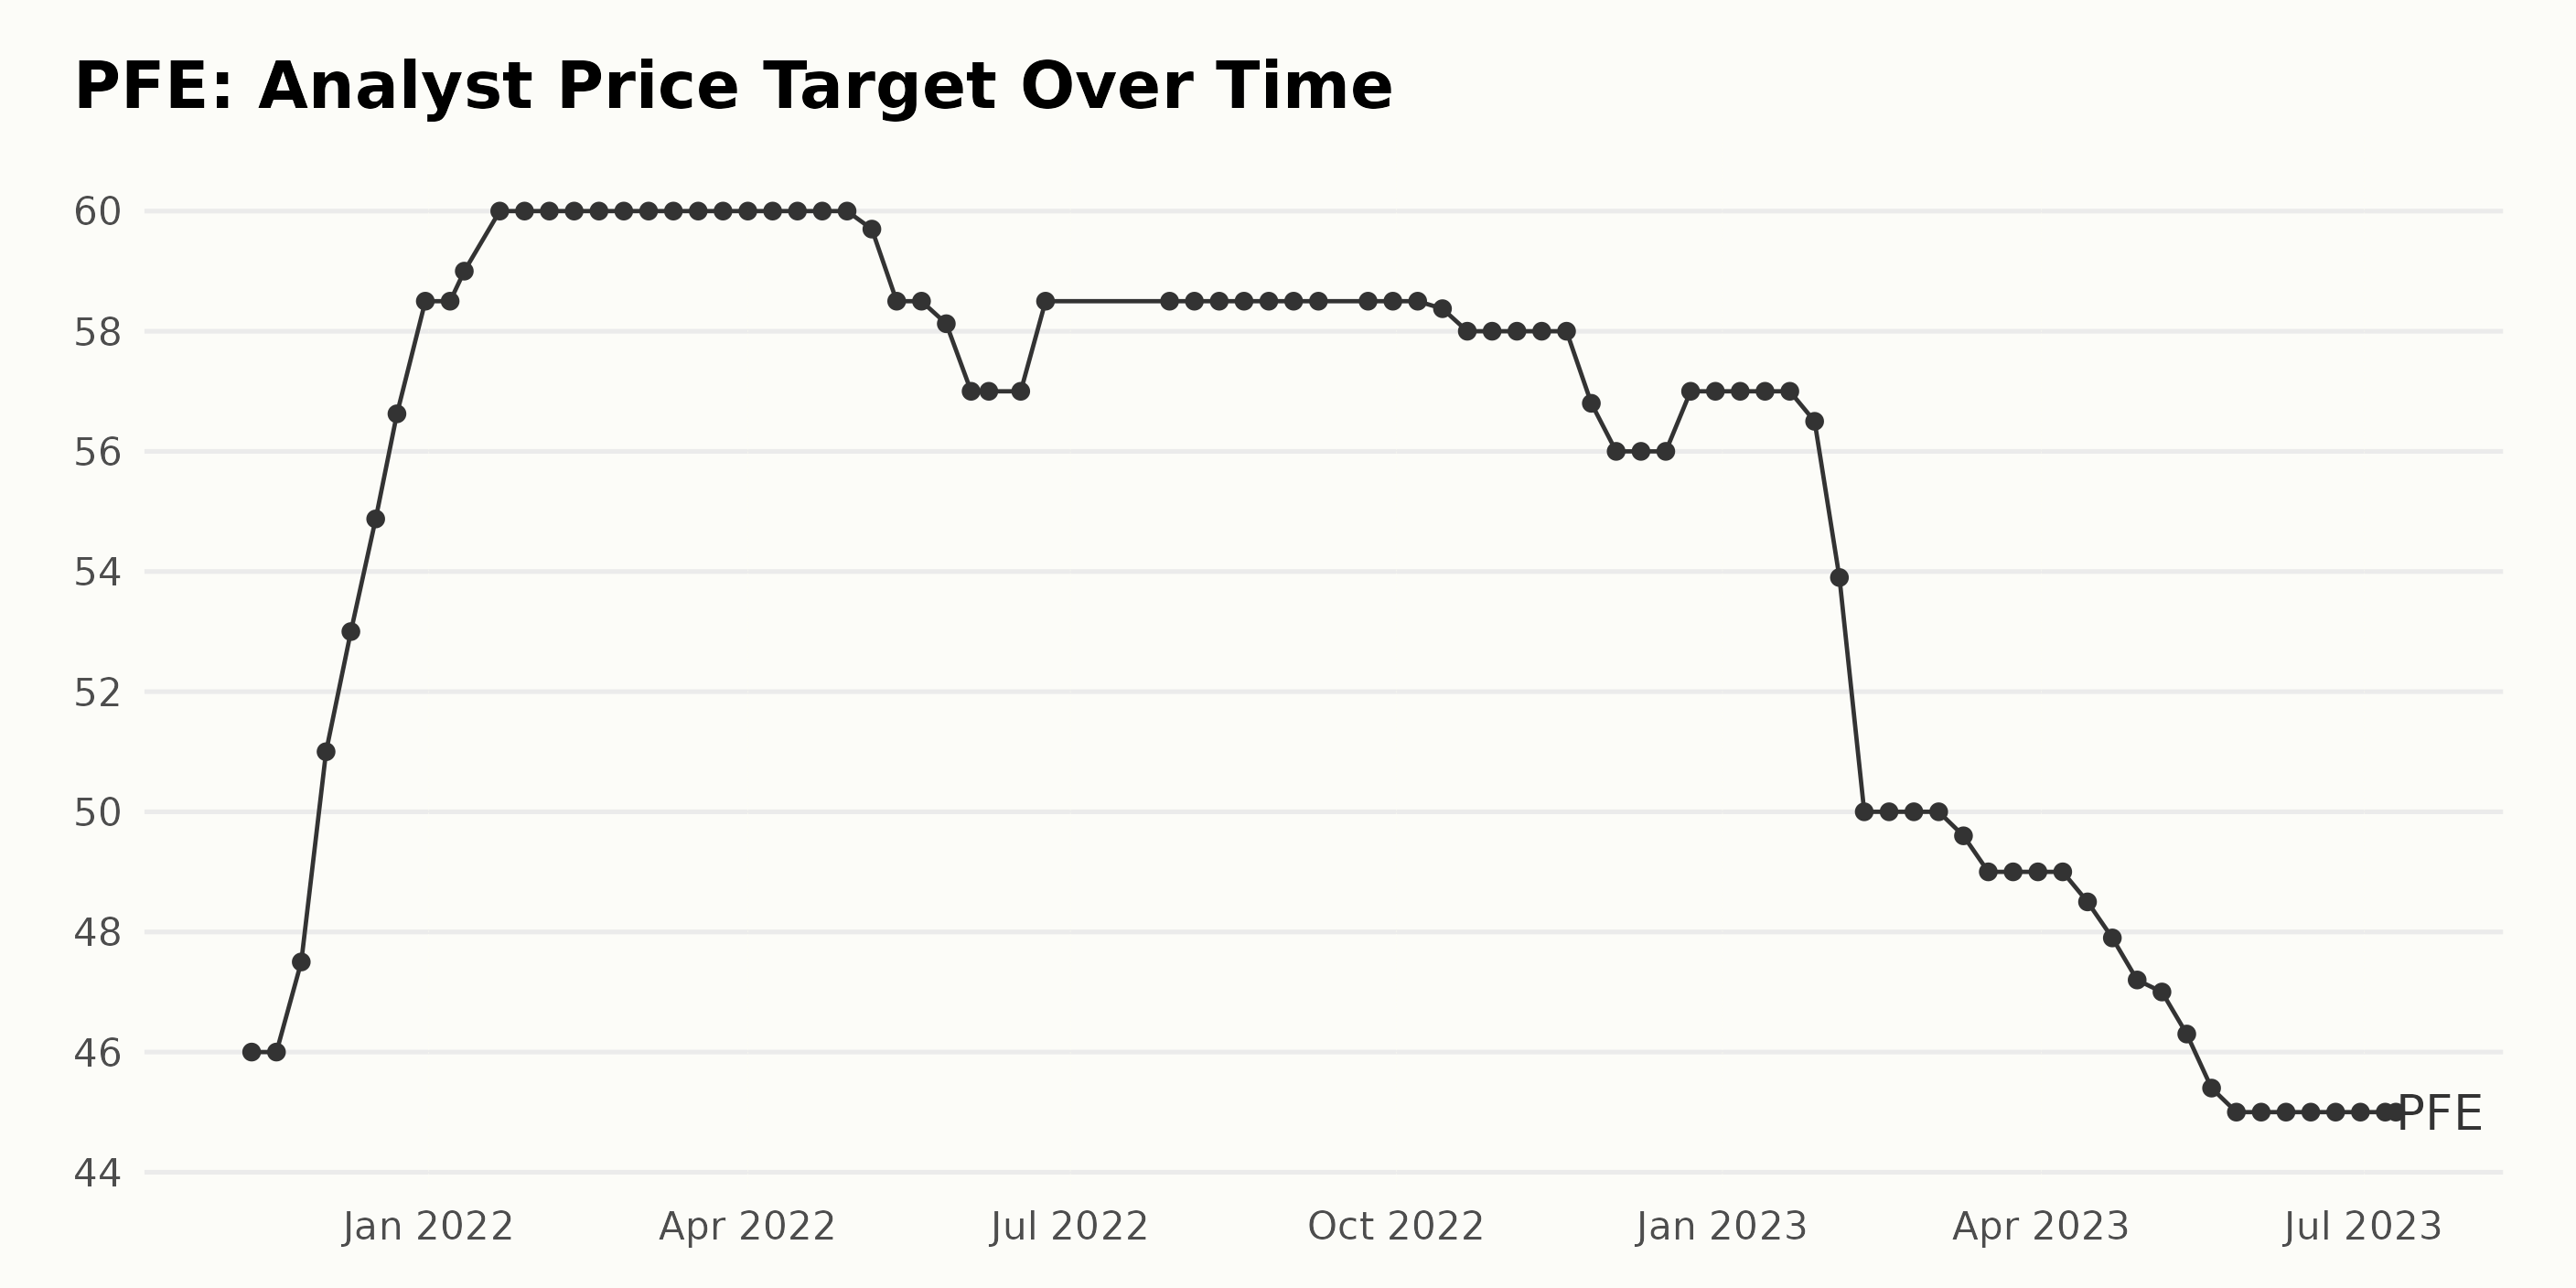
The given data reflects the fluctuating analyst price target for PFE over the course of about two years.
- A general upward trend is observed in the data from November 2021 to early 2022, where the Analyst Price Target increased from $46 on November 12, 2021, to a peak value of $60 by February 04, 2022. This represents an increase of about 30%.
- The price target remained consistently at $60 for some months until May 2023. After reaching this peak, the target started showing a mild decline, dropping marginally to $59.7 on May 6, 2022, and then to $57 by June 03, 2022.
- For the following few months, throughout summer and into the fall of 2022, the price target held reasonably steady, ranging between $58.5 and $58.
- However, in late November 2022, the target decreased significantly, falling to $56.8 by November 25, 2022, and continuing to $56 by December 2, 2022.
- The start of 2023 saw slight fluctuations around $57 until January 27, when it gently dipped to $56.5. Subsequently, it declined sharply to $53.9 in early February and reached a low of $50 by February 10, representing a 20% decrease from its peak.
- It continued at $50 until March, when we saw another mild downfall, with the price target dropping to $49 by March 24, 2023, and maintaining this figure till early April 7. From April 14, 2023, there was a steady downward trend until the last reported value of $45 on July 10, 2023.
From the comprehensive data, the overall growth rate for the analyst price target appears to be -2.17%, measuring the first value of $46 in November 2021 against the latest value of $45 in July 2023. This suggests a slight overall decrease over the given time frame despite some increase periods.
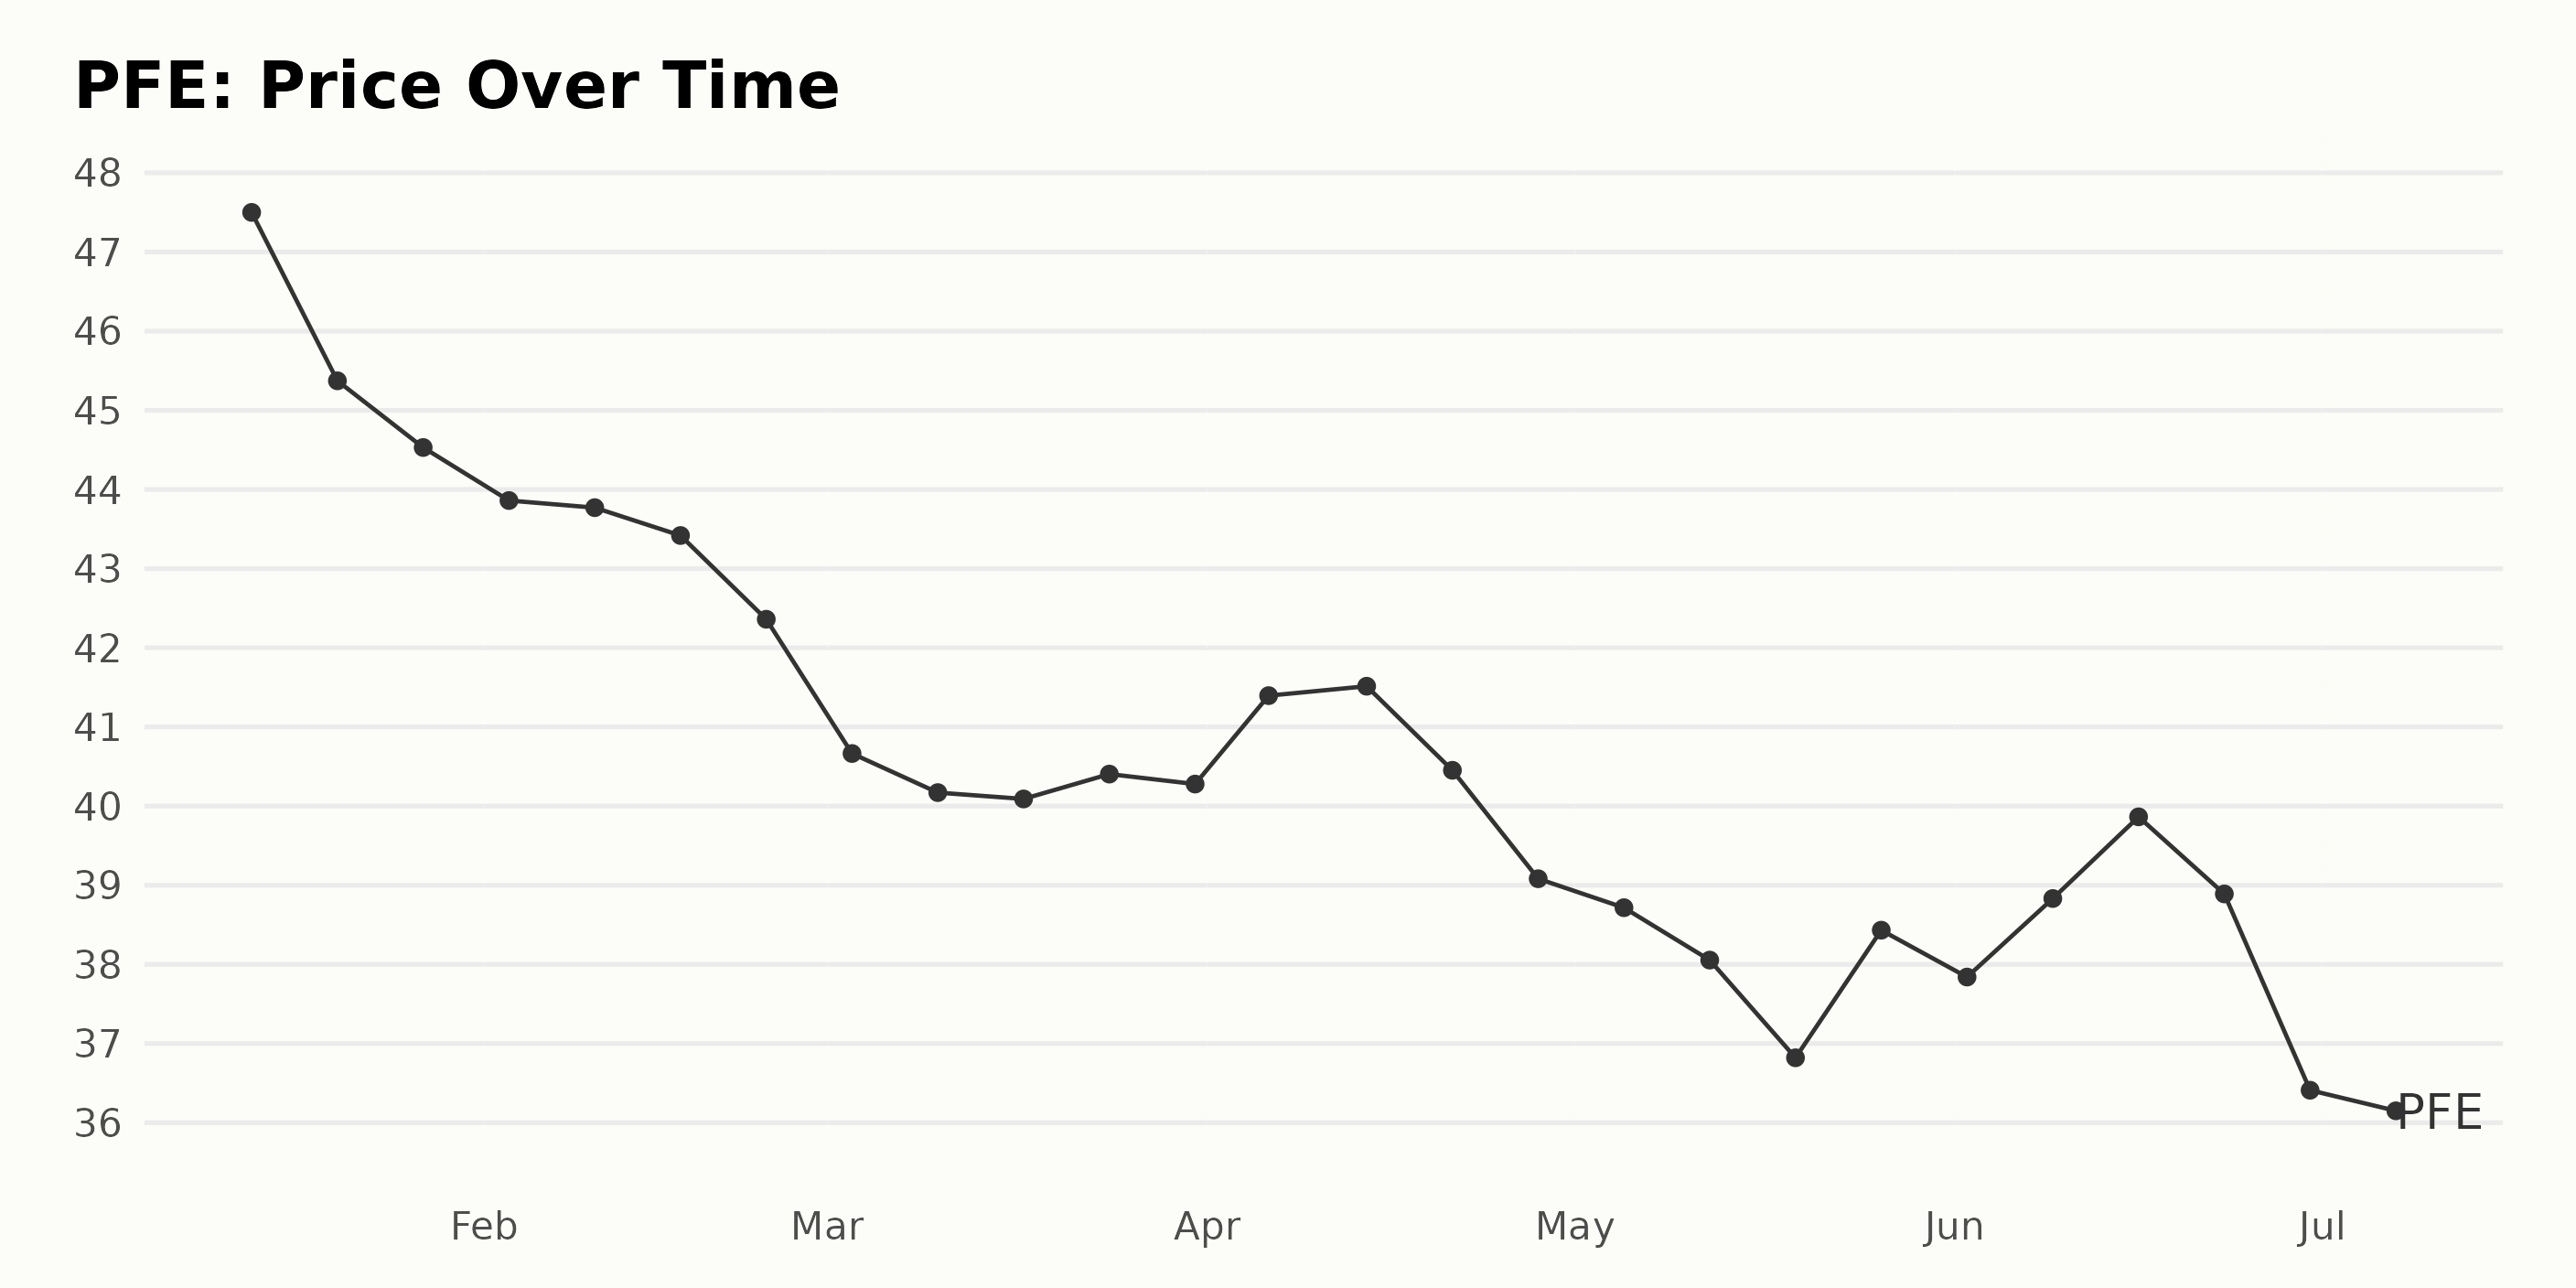
Analyzing Six-Month Trends in Pfizer Inc.’s Fluctuating Share Prices
Upon examining the provided share price data of PFE, it is evident that there are fluctuating trends seen throughout the given dates from January 13, 2023, to July 7, 2023. Here’s a breakdown:
- From January 13, 2023, to February 24, 2023, the share price exhibited a notable decrease, falling from $47.5 to $42.36.
- In March 2023, the share price remained static, with a slight increase between March 17, 2023, and March 24, 2023 ($40.09 to $40.404) before tapering off around $40.278 by the end of March.
- There was a small jump to $41.514 in mid-April 2023, but this didn’t sustain. By the end of April 2023, the stock had once again fallen to $39.082.
- In May 2023, further decrement could be observed where the share price slid down to $36.82 on May 19, 2023, followed by a short growth spurt taking it back up to $38.432 by the end of May 2023.
- A steady incline was seen in June 2023, reaching $39.864 by mid-June. However, the stock took a sharp downturn towards the end of the month. By June 30, 2023, it dropped to $36.41.
- The trend continued downwards as of July 7, 2023. It had decreased slightly more to $35.53.
The overall trend during this period depicts a steady decline in PFE’s stock price interspersed with minor, transitory increases. The growth rate is predominantly negative, indicating a declining trajectory for Pfizer’s share price during these six months. Here is a chart of PFE’s price over the past 180 days.
Pfizer Inc.’s Performance Assessment: Value, Quality, and Stability Dimensions Reviewed
The POWR Ratings grade of PFE, in the Medical – Pharmaceuticals category, has demonstrated a fluctuating stance over time. Given below are the key movements of PFE’s overall grade:
- In January 2023, the POWR Grade was A (Strong Buy), denoting a solid performance, ranking between #4 and #8.
- The grade maintained an A (Strong Buy) position until early February 2023.
- From February 11, 2023, to July 1, 2023, the POWR Grade dropped from A (Strong Buy) to B (Buy).
- During this period, the rank in the category also dropped, indicating a weaker performance, moving from the 25th to the 40th rank.
- By the week of July 8, 2023, the POWR Grade downgraded further to C (Neutral), with the position declining to #44 in its category, suggesting a decline in performance.
As of July 10, 2023, the latest POWR Grade for PFE stands at a C (Neutral), and it ranks 44th in its category, inferring a relative underperformance within the Medical – Pharmaceuticals sector, encompassing a total of 164 stocks.
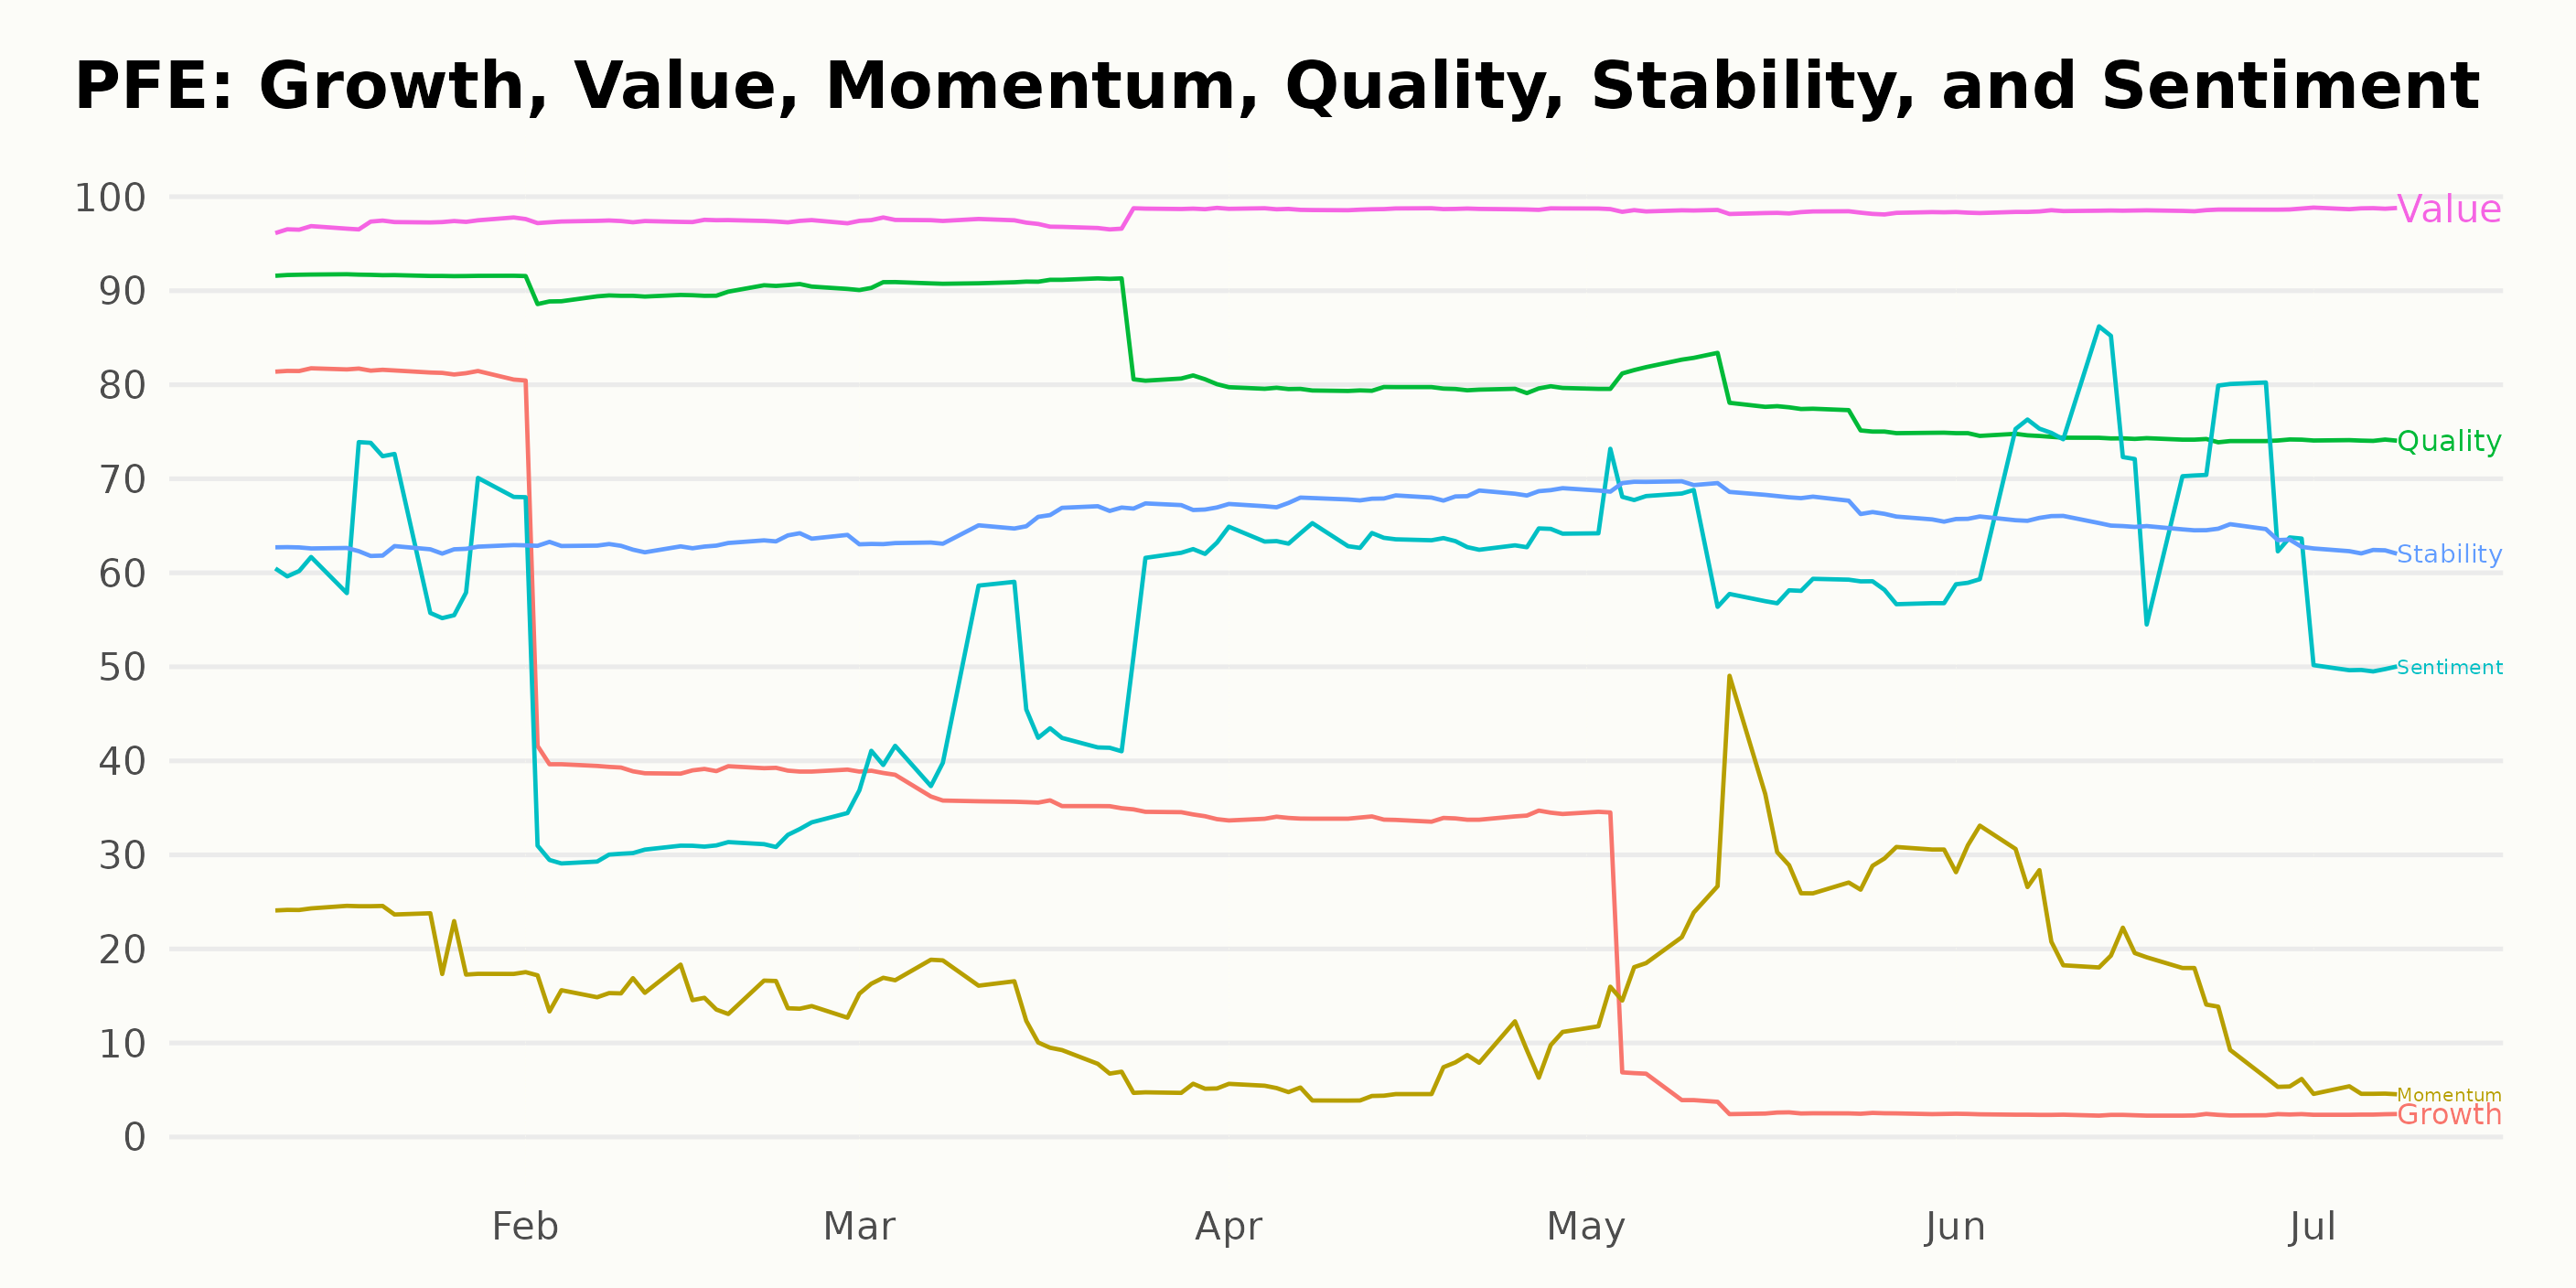
The three most noteworthy dimensions for PFE based on the POWR Ratings are Value, Quality, and Stability.
Value: PFE consistently maintained high-value ratings throughout the time period considered. The highest rating recorded was 99 in April 2023, which was sustained through the subsequent months till July 2023. Overall, the trends indicate a stable and strong value dimension, peaking at an impressive 99 rating.
Quality: PFE’s quality dimension started strong at 92 in January 2023 but showed a gradual decline over time. In February, March, April, May, June, and July 2023, quality ratings were 90, 88, 80, 78, 74, and 74, respectively. Despite this trend, PFE’s quality ratings remain satisfactorily high compared to other dimensions.
Stability: Stability ratings saw a slight upward trend from January 2023 at 62 up to 68 in April 2023. A plateau followed with the stability rating remaining constant at 68 in May. However, June and July 2023 slightly dropped to 65 and 62, respectively.
In conclusion, the Value dimension showcases the highest rating and consistent performance for PFE. Although the Quality dimension is declining, it still yields fairly high ratings. Despite exhibiting slight fluctuations, the Stability dimension maintained an average performance throughout the assessed period.
How does Pfizer Inc. (PFE) Stack Up Against its Peers?
Other stocks in the Medical – Pharmaceuticals sector that may be worth considering are AbbVie Inc. (ABBV), Novartis AG (NVS), and Novo Nordisk A/S (NVO) – they have better POWR Ratings.
What To Do Next?
Discover 10 widely held stocks that our proprietary model shows have tremendous downside potential. Please make sure none of these “death trap” stocks are lurking in your portfolio:
Want More Great Investing Ideas?
PFE shares were trading at $35.66 per share on Monday afternoon, up $0.13 (+0.37%). Year-to-date, PFE has declined -29.01%, versus a 15.53% rise in the benchmark S&P 500 index during the same period.
About the Author: Anushka Dutta

Anushka is an analyst whose interest in understanding the impact of broader economic changes on financial markets motivated her to pursue a career in investment research. More...
More Resources for the Stocks in this Article
| Ticker | POWR Rating | Industry Rank | Rank in Industry |
| PFE | Get Rating | Get Rating | Get Rating |
| CRBU | Get Rating | Get Rating | Get Rating |
| ABBV | Get Rating | Get Rating | Get Rating |
| NVS | Get Rating | Get Rating | Get Rating |
| NVO | Get Rating | Get Rating | Get Rating |