

The acronyms FANG and MAGA, which have become to stand for the cohort of mega-cap tech stocks “Microsoft (MSFT)” “Amazon (AMZN)” “Apple (AAPL)” Facebook (FB)” “Netflix (NFLX)” and “Google (GOOGL)” which have been investor favorites, and among the best performers, for the better part of a decade.
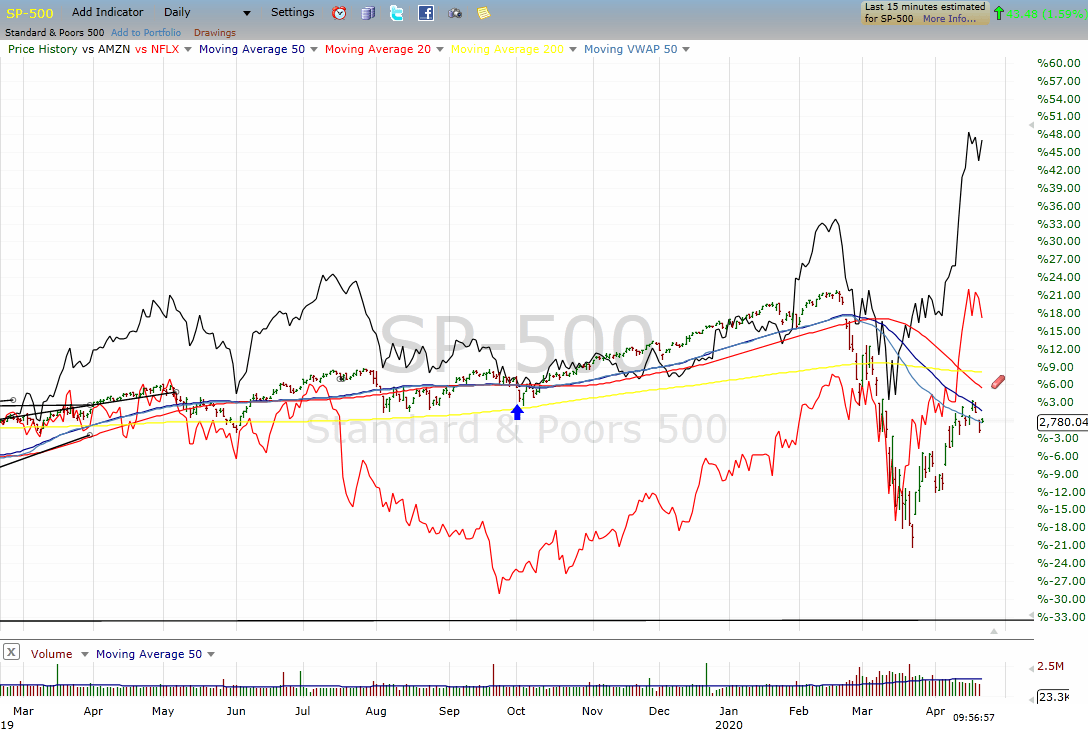
During the past few months during this time of COVID, with the exception of GOOGL, these stocks have further separated themselves from the rest of the market.
With the “SPDR Trust (SPY - Get Rating)” down some 15% for the year and the “Small Cap Russell (IWM)” is still in bear territory down 21% for the year. By contrast, the “Nasdaq 100 (QQQ)” which is dominated by the FANG/MAGA names is down a mere 3.6% for the year.
AMZN and NFLX are actually at new all-time highs by a large margin. The separation in performance is truly eye-popping.
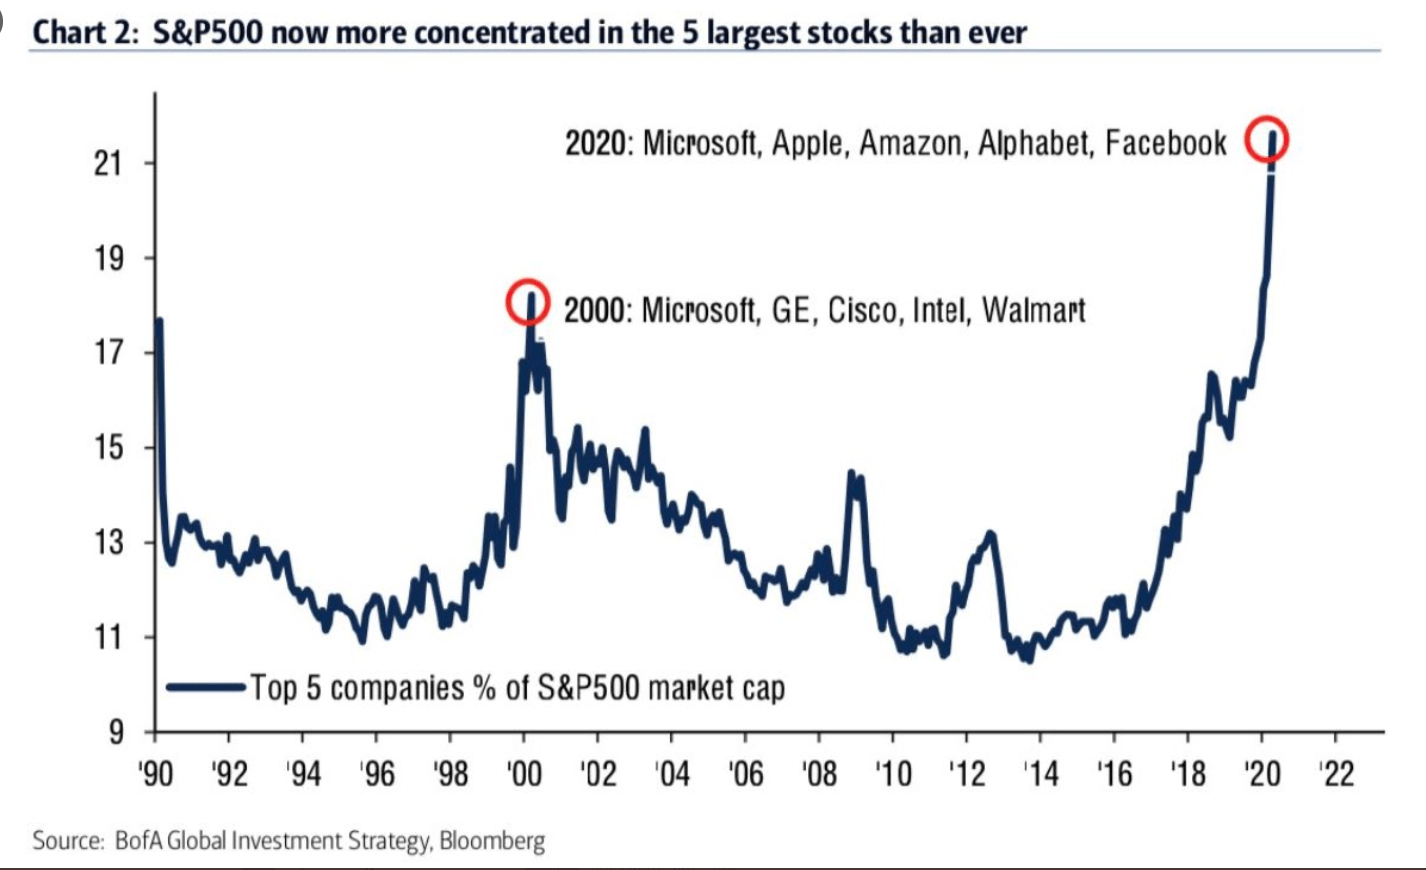
These stocks became “must own” as their unique and dominant business models led to a virtuous circle in terms of garnering investment dollars. As their market capitalization grew started to represent an increased weighting in not just the tech-heavy QQQ, in which the five largest names are over 40% of that Index, but also the SPY.
In fact, the top five are now over 20% of the S&P 500, which is a clear record, far and away eclipsing a peak in 2000.
So, while this rally of nearly 30% from the March lows has been impressive, it may be less than meets the eye in that it’s had very poor breadth or participation.
We’ve heard how the economy is becoming a “winner takes most” and that is certainly happening in the stock market.
When judging the quality and potential sustainability of a risk-on rally, we like to see participation by a broad number of stocks in the market. Meaning the prospects for the current stock market rally may be less than stellar. That’s because we have seen a recent “thinning out” of the herd.
The recent gains were accompanied by less than 40% of both advancing issues and advancing volume on the NYSE. That has only happened 3 other days in history — all during or leading into cyclical bear markets.
Likewise, on the best day of last week, the large-cap QQQ was up nearly 2% on the day; yet, less than 45% of Nasdaq issues rose on the day. That is just the 22nd time we’ve seen a day like that — and the first since the 2000-2002 bear market
Lastly, the April 6th rally was confined to the mega-caps as evidenced by the fact that while the Nasdaq QQQ rallied over 1.5%, while the small-cap Russell 2000 IWM fell by more than a half of a percent. That was just the 8th such day, historically — and the only one outside of the 2000-2002 bear market.
So, what does this all mean? overall, signs of low participation like this during rallies call into doubt the sustainability of such risk-on moves. And perhaps most meaningful of all is the timing of similar historical precedents. Specifically, we have ominously seen these types of days almost exclusively during longer-term bear markets.
This doesn’t mean the market can’t bounce a bit more in the near-term. However, investors may think twice about the prospects for a return to a bull market environment that we’ve witnessed for the past many years.
Want More Great Investing Ideas?
9 “BUY THE DIP” Growth Stocks for 2020
7 “Safe-Haven” Dividend Stocks for Turbulent Times
Investors Beware: It’s Still Really Bad Out There!
SPY shares were trading at $278.93 per share on Wednesday afternoon, up $5.89 (+2.16%). Year-to-date, SPY has declined -12.83%, versus a % rise in the benchmark S&P 500 index during the same period.
About the Author: Option Sensei

Steve has more than 30 years of investment experience with an expertise in options trading. He’s written for TheStreet.com, Minyanville and currently for Option Sensei. Learn more about Steve’s background, along with links to his most recent articles. More...
More Resources for the Stocks in this Article
| Ticker | POWR Rating | Industry Rank | Rank in Industry |
| SPY | Get Rating | Get Rating | Get Rating |
| Get Rating | Get Rating | Get Rating | |
| Get Rating | Get Rating | Get Rating | |
| Get Rating | Get Rating | Get Rating |


