

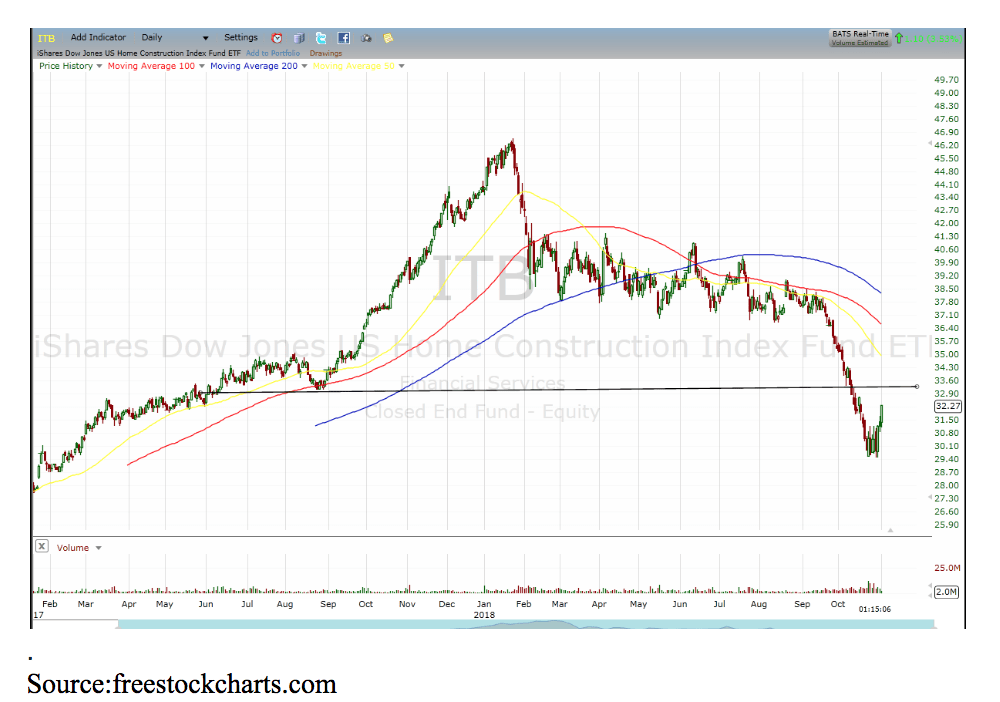
Likewise, the Home Construction Index has enjoyed a 5.6% rally but may run into trouble at the $33 level.
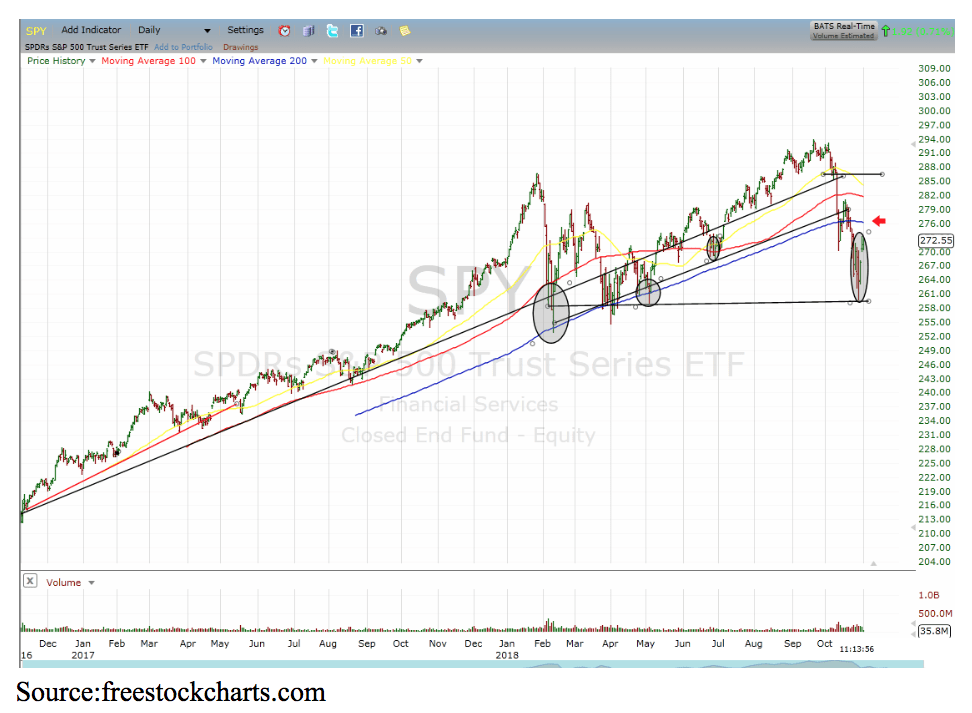
Looking at the broader market, we can see the S&P 500 held an important level at $260 and has had a good bounce. But unlike prior declines, it not only broke the 200-day moving average but also remained below it. Unless it can clear the $275 level, the downtrend and bears will remain in control.
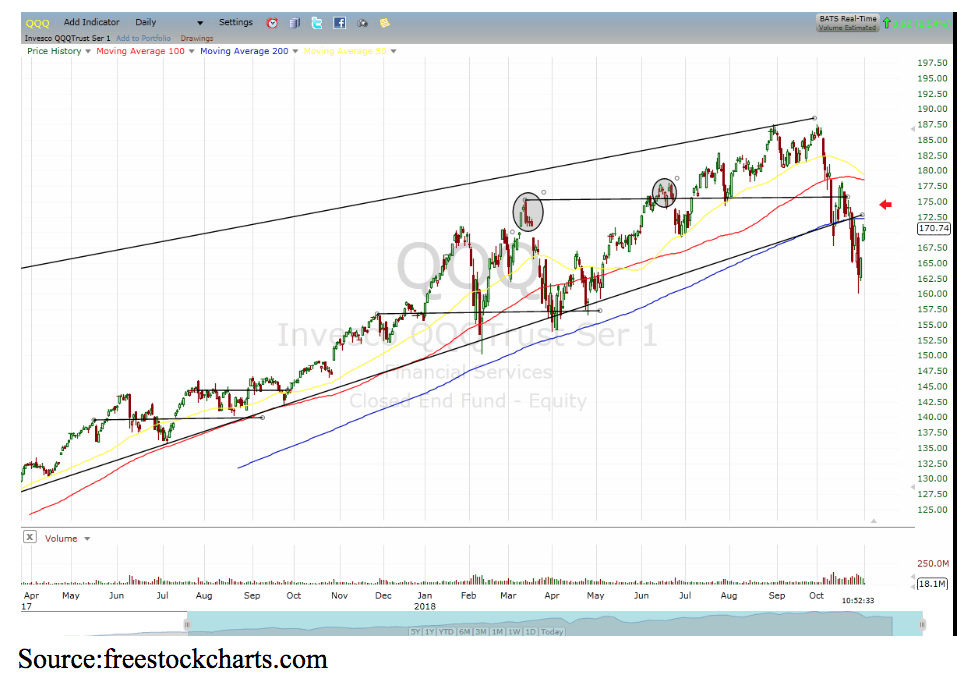
As we turn toward the Nasdaq 100, which is dominated the FANG stocks like Apple, Amazon, and Google and has led the bull market, we also see a break of the 200 DMA as well as important trendlines.
About the Author:

9 "Must Own" Growth Stocks For 2019
Get Free Updates
Join thousands of investors who get the latest news, insights and top rated picks from StockNews.com!
Top Stories on StockNews.com

Best & Worst Performing Mega Cap Stocks for July 22, 2025
HDB leads the way today as the best performing mega cap stock, closing up 4.22%.
Best & Worst Performing Mega Cap Stocks for July 21, 2025
IBKR leads the way today as the best performing mega cap stock, closing up 7.77%.
Best & Worst Performing Mega Cap Stocks for July 18, 2025
ABBNY leads the way today as the best performing mega cap stock, closing up 9.07%.
Best & Worst Performing Mega Cap Stocks for July 17, 2025
JNJ leads the way today as the best performing mega cap stock, closing up 6.19%.