

Market volatility has contracted back down to historically low levels with the VIX, which acts as the benchmark measure, sitting just above 52-week low at the pre-teen level of 12.
But, with earnings season upon us, tons of IPOs such as Uber hitting market, and pickup in mergers and acquisition activity such as Chevron’s (CVX) $33 billion buy-out bid for Anadarko (APC) Today, we can expect volatility to lift from its current low levels.
But how does an increase in volatility, which basically is a measure of the magnitude of price changes within a given time frame impact options’ values.
To understand this, we need to turn to Vega. Options traders sometimes use these terms interchangeably, and while they are related, they are two distinct concepts.
Volatility
Volatility is one of the five inputs used in the basic Black-Scholes options pricing model.
Higher volatility means higher option prices. That’s because higher volatility means greater expected price swings.
So it follows that stocks like Netflix (NFLX) and Facebook (FB) have higher volatility readings, and therefore higher-priced options than more mature and stable companies like Apple (AAPL) and JP Morgan(JPM).
Take a look at this table:
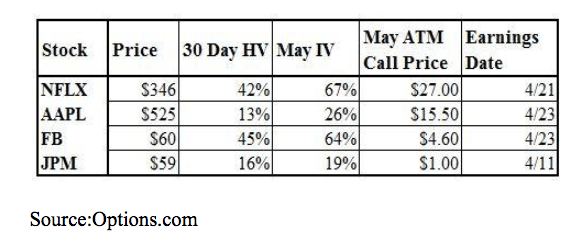
Despite Apple having a higher underlying stock price than Netflix, its at-the-money. The May call is actually much lower in price than Netflix.
And note that both JP Morgan and Facebook are trading around $60. But the latter’s call is nearly five times the price.
This is almost entirely due to the differences in implied volatility. This is because Facebook is far more likely to make a huge move after earnings than JP Morgan.
Last quarter provided a perfect example of this. Facebook rose 14% in one day after reporting earnings. JP Morgan moved just 0.1%.
Vega
Vega isolates how a change in implied volatility will impact an option’s price by estimating of how much its value changes when implied volatility moves 1%.
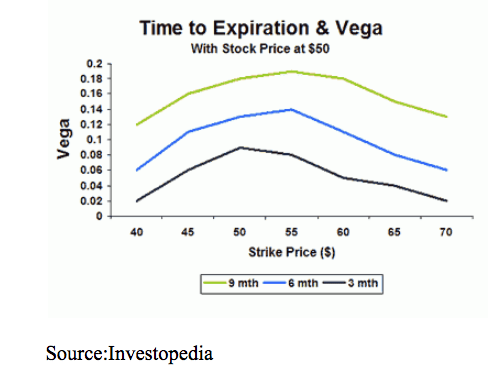
Vega is highest for at-the-money strikes and increases as you go out in time. Notice also that peak vega also moves slightly out of the money as you go out in time. This is because the probability of a given price move occurring increases as the time frame is extended.
For example, if you’re speculating on a $10 price move, you have more of a chance of being right if you have a six-month time frame rather than a one-month time frame.
A directional calendar spread, in which one buys a later-dated out-of-the-money option and sells a near term out-of-the-money option, is a strategy that tries to benefit from this concept.
When it comes to known events such as earnings reports, implied volatility will typically rise ahead of news and decline afterward.
Understanding the difference between historical (or realized) volatility and implied volatility is crucial in determining whether an option is relatively “cheap” or “expensive” and whether you want to be long or short vega.
In this case, one might want to be short vega through the sale of a straddle or iron condor, which would benefit from a decline in implied volatility even if the stock moves sharply following the news event.
Understanding what the options market is expecting, or “pricing in” as measured by implied volatility, will help you determine just how large a price move will be needed for a profit when you are long options. And vega will tell you how much a change in implied volatility, following the report, will impact the price of the options.
Often, a decline in IV (also known as vega risk) will offset the impact of price gains in the underlying stock. This is how you can be correct on a stock’s direction and still lose money on an options position.
Volatility helps define an option’s cost, and vega helps determine a position’s profit or loss. Therefore, it is critical to understand both concepts.
It’s a good idea to use a basic option calculator like this one from the Chicago Board of Options Exchange (CBOE) to play around with changes in implied volatility over different time frames and see what the impact on the option’s price will be.
About the Author: Steve Smith

Steve has more than 30 years of investment experience with an expertise in options trading. He’s written for TheStreet.com, Minyanville and currently for Option Sensei. Learn more about Steve’s background, along with links to his most recent articles. More...
9 "Must Own" Growth Stocks For 2019
Get Free Updates
Join thousands of investors who get the latest news, insights and top rated picks from StockNews.com!
Top Stories on StockNews.com

Best & Worst Performing Stock Industries for July 26, 2024
Led by ticker KGJI, "Fashion & Luxury" was our best performing stock industry of the day, with a 1,299.75% gain.
Best & Worst Performing Mid Cap Stocks for July 26, 2024
GSHD leads the way today as the best performing mid cap stock, closing up 29.21%.
Best & Worst Performing Small Cap Stocks for July 26, 2024
KGJI leads the way today as the best performing small cap stock, closing up 100,000.00%.
Best & Worst Performing Large Cap Stocks for July 26, 2024
NOW leads the way today as the best performing large cap stock, closing up 13.40%.