StockNews.com
  • Login Join

StockNews.com
  • News
    • Top Stories
    • Video News
  • Best Stocks
    • "A" Rated Stocks
    • Upgrades/Downgrades
    • High Yield Dividend Stocks
    • Stock Screener
    • Top Stocks by Target Price
    • Dividend Discount Model Stock Valuation
    • Industry Rank
  • Best ETFs
    • "A" Rated ETFs
    • Best ETF Categories
    • High Yield ETFs
    • 7 Best ETFs
  • POWR Ratings
  • Upgrades/Downgrades
  • Watchlist
  • Screener
  • Services
    • Services Home
    • POWR Platinum
    • Reitmeister Total Return
    • Stocks Under $10
    • POWR Options
    • POWR Value
    • POWR Screens 10
    • POWR Income Insider
    • Premium
  • Login Join


  • Home
  • Articles posted by Steve Smith
  • (Page 2)
  • Uncategorized

Options Trading: Profit and Probability Discussion [Part 2]

In the [first part of this series],  we discussed how returns need to calculate returns on a risk-adjusted basis in both percentage and dollar terms.  This applies to within the context of each position but, the overall portfolio. Now, let’s take a look at how setting up the proper risk/reward profile for each individual position will boost overall profitability.

Winning Percentage

A big secret that many rich traders know that new traders do not is that the winning percentage for even the best traders is only about 50%-60%. Having big winning trades and small losing trades is their edge.

Big losses will kill your account quickly and small wins will do little to pay for those losses. Our trades have to be asymmetric where our downside is carefully planned and managed, but our upside is open-ended. This is a crucial element for trading success and has to be understood and planned for.  Consider the following sets of risk/rewards with win rates.

  • With a 1:1 risk/reward ratio and 50% win rate a trader breaks even.
  • With a 2:1 risk/reward ratio and about a 35% win rate a trader breaks even.
  • With a 3:1 risk/reward ratio and about a 25% win rate a trader breaks even. 

The risk/reward ratio is used by more experienced traders to compare the expected profits of a trade to the amount of money risked to capture profit. This ratio is calculated mathematically by dividing the amount of profit the trader expects to have made when the position is closed (the reward) by the amount the trader could lose if price moves in the unprofitable direction and the trader is stopped out for a loss.  

Don’t Play the Lottery

One of the biggest mistakes novice options traders make is buying way out-of-the-money calls.   These options through their typically-low dollar cost seemingly set up a great risk/reward profile.   You can only lose what you pay for,  the option and profits are theoretically limitless.

I refer to these as lottery tickets because you are much more likely to rip them with a 100% loss than you are to hit the jackpot.  And remember, these options come with an expiration date, meaning you not only need an outsized price move, but it has to occur within the right time frame.

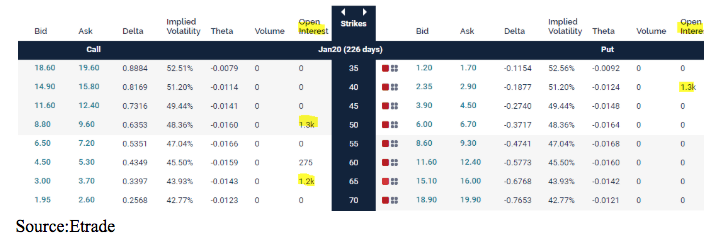
In addition to these OTM options having a low probability of success, they also may not be as “cheap” as they seem.   In options, it’s not just the dollar amount that determines whether it is relatively cheap or expensive, it is the implied volatility.   Often, the implied volatility on these OTM is very high-causing inflated premiums. This is especially true, ahead of pending news such as earnings or takeover chatter when the lottery aspect of these come fully into play.

Three-Step Approach

In setting up a trade, I take three basic steps:

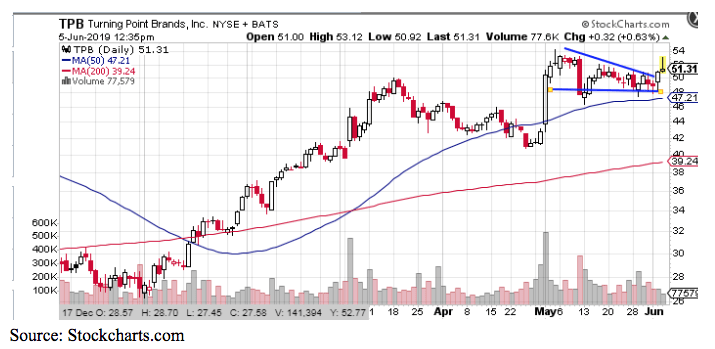
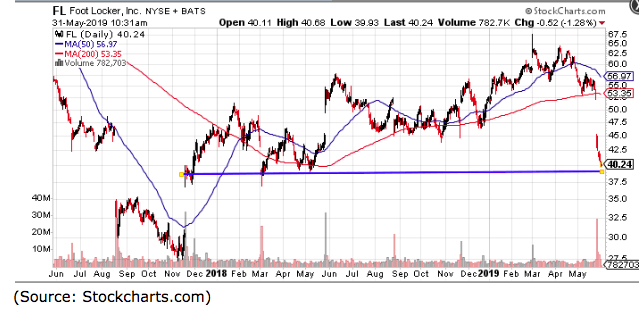
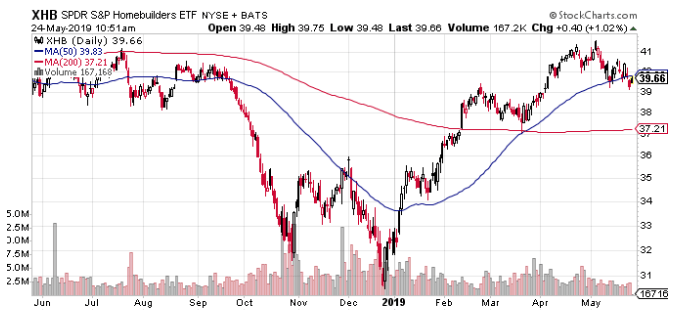
1. Use the chart to find an attractive entry level and define your trade parameters.  This means buying near support and selling at resistance levels. This not only provides an attractive initial price but helps you set a realistic price or profit target.  It also limits risk, if support is broken, the position gets closed for a small loss. Ideally, the price target should be at least twice the price magnitude as the stop loss level.

2. Choose a strategy that will deliver at least a 2:1 risk/reward if the price target is achieved.  If the target is small and the stop is tight, one can simply buy an at-the-money call. If the parameters are wider than using a spread might make more sense.

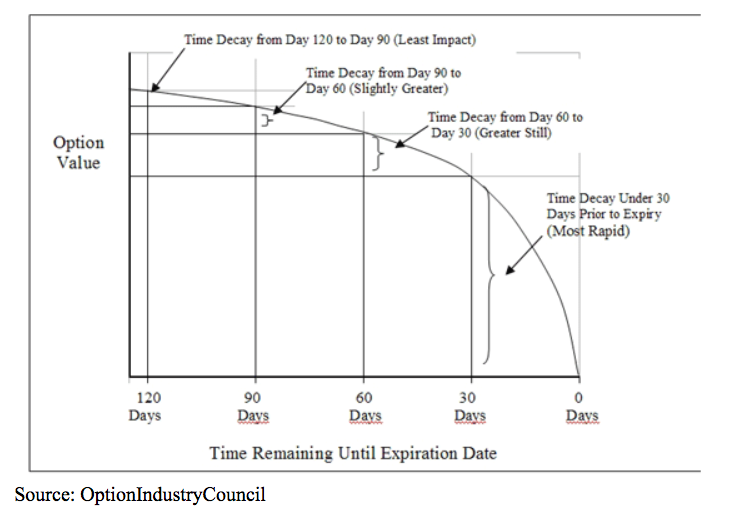
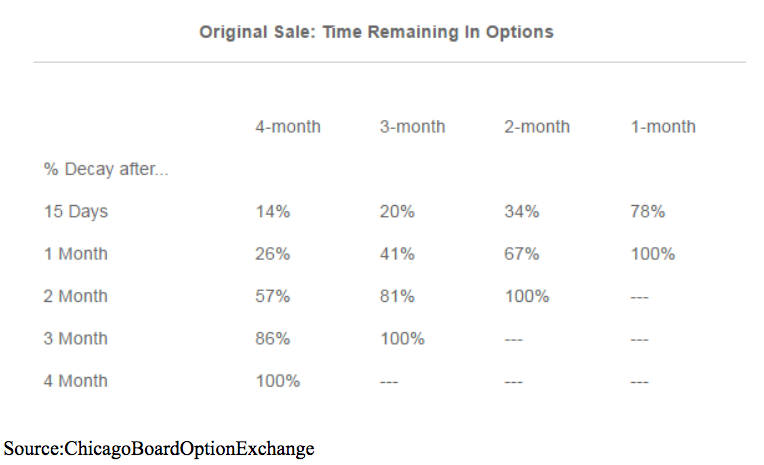
3. Allow sufficient time for your thesis to play out. If this a turnaround story, you’ll want options that have an expiration that is at least 8-12 months away.  If you just looking for a quick technical bounce or an earnings announcement using a shorter term of options, anywhere from two weeks to three weeks makes, will provide better returns.  

The bottom line: Managing risk is more important than trying to always be right.

.      


.


  • Home
  • Articles posted by Steve Smith
  • (Page 2)
  • Uncategorized

Options Trading: A Probability & Profitability Discussion

It’s a well-known investment maxim where risk is correlated to reward.  But, when it comes to options, it seems people are making claims to both consistently hitting singles while simultaneously being home run kings.

In the next three articles (this is one of three), I want to explore how returns should be calculated, whether it’s possible to achieve both a high percentage win rate along with high percentage returns. And finally, which options strategies offer the best probability of consistent profitability.  

Dollars to Donuts

First, we need to be clear on our terms.  Returns must be based on dollars at risk.  Too often, people mix and match these terms to put their results in the best light.  Meaning, if it’s a call option, they own increases in value from 50 cents to $1, they will tout the 100% return.  But, if it expires worthless, they will highlight that the loss was limited to just 50 cents or $50 per contract, not that it was a 100% loss.  Both of these are true of course. But, the varied emphasis can be misleading — at least when purchasing options, the accounting is fairly straightforward.  The capital required and the risk are limited to the cost or premium paid for the position. This is true for the straight purchase of single strike or spread done for a debit.   

Because of the leverage of options, many long premium positions can deliver returns in excess of 100%. Indeed if an option that goes from 20 cents to 50 cents — that is a 150% gain. But, if one only owns two contracts within a $10,000 portfolio that a $60 gain translates into. 

When it comes to selling options or positions done for credit, accounting can become a bit more creative.   If it expires worthless, a claim of a 100% return is often made. If the option position sold for a 50-cent credit is forced to cover and bought back for a $1, it was “only” a 50-cent loss.  But, even this does not accurately reflect the margin or capital required to establish that the short position could have been greater than 50 cents and therefore the loss was even greater than 100%.

Let’s look at a basic example in the Spyder 500 Trust (SPY).  With the SPY trading at $267, you can sell the $270 and buy the $273 call for $1.20 net credit for the spread in with a January expiration date.  

If shares of SPY are below $270 on the position expires January 19th worthless and you keep the $1.20 premium as a profit.  But this is NOT a 100% return. That’s because the margin or capital required to establish the position is $1.80. That is calculated by the width between the strikes, which is $3, minus the premium collected, $1.20.   That $1.80 represents your maximum risk or loss that would be incurred if SPY is above $273on the expiration date.

Therefore, the maximum profit of $1.20 represents a 66% return.  Not too shabby for a 30-day period, but not the 100% claimed.

But, that also means the potential loss of $1.80 translates into a 150%, or 1.5x the profit potential.  It is important to always keep in mind both the percentage and dollars at risk. This needs to be in the context of both each individual position and the overall portfolio.    

This concept of risk-adjusted returns is crucial when we begin to look at the risk/reward ratios of various options strategies.   In the next segment, I’ll look at how winning big can outweigh winning often, but can also bring its own pitfalls.


  • Home
  • Articles posted by Steve Smith
  • (Page 2)
  • Uncategorized

Understanding the Importance of Time Decay in Options Trading

After the steep decline and rapid rebound, the stock market seems ready to settle into a range.  Following such a period of big moves and high volatility, it wouldn’t be a surprise if it went nowhere for the next weeks. or until the next earnings period, which will begin mid-July

But as an options trader, one thing that never stands still is time. In trading options, the theta or time decay must be taken into account. Let’s take a look at how it works.   

Time is a key component in an option’s valuation.  Thankfully, it is applied equally to all options, regardless of the underlying security.  But, there is one nuance that needs to be understood. In the options world time curves, accelerating as expiration approaches.  Anyone that’s ever been on a deadline can relate to that. The tool that we use to define time is called theta, and it measures the rate of decay in the value of an option per unit of time.  

There’s a basic math formula used in the Black-Scholes model that’s a good starting point.  Basically, we use the square root of time to calculate and plot time decay. The math involved in the nitty-gritty of evaluating theta can be extremely complex, so focus on this: Time decay accelerates as expiration approaches, meaning that theta is defined on a slope.

120 day time decay options

For example, if a 30-day option is valued at $1.00, then the 60-day option would be calculated as $1 times the square root of 2 (2 because there is twice as much time remaining). So all else being equal, the value of the 60-day option is $1.41, or $1 times 1.41 (1.41 is the square root of 2). A 90-day option would be $1 times the square root of 3 (3 because there is three times as much time remaining) for an option value of $1.73. (1.71 is the square root of 3).

If you’ll notice, the premium of the 60-day over the 90-day ($0.32) is less than that of the 60- day over the 30-day ($0.41). So again, the important takeaway is to realize that the closer an option gets to expiration, the rate at which time value decays gets faster. 

This graph makes the math easier to visualize and also shows that rates of decay are different depending upon whether an option in-the-money, out-of-the-money or at-the-money.

theta euro call time maturity

Another conclusion that can be drawn from the above charts is that, if one sells out-of-the-money options with a slightly longer-term horizon, he might plan on covering them before expiration — perhaps just past the half-way point or so. He would do this because a large majority of the time value decay would already have taken place, and therefore, the remaining opportunity would not be as great.

For example, suppose XYZ is trading at 100, and you sell the out-of-the-money combo, utilizing the calls with strike 120 and the puts with strike 80. The following table shows how much (unrealized) profit you would have from the naked sell combo if the stock was still at 100 one month, two months, etc.

options trading times remaining chart

Here are some other basic concepts you need to know about theta:

  • An options theta can be calculated as follows: If a particular option’s theta is -10, and 0.01 of a year passes, the predicted decay in the option’s price is about $0.10 (-10 times 0.01 is 0.10).
  • At-the-money options have the highest theta. Theta decreases as the strike moves further into the money or further out of the money. In-the-money options are mostly composed of intrinsic value (the difference between the strike price of the option and the market price of the underlying), while out-of-the-money options have a larger implied volatility component.
  • Theta is higher when implied volatility is lower. This is because a high implied volatility suggests that the underlying stock is likely to have a significant change in price within a given time period. A high IV artificially expands the time remaining in the life of the option, helping it retain value.

Time is always moving.  In our daily lives, some days seem to pass quicker than others.  So too with options.


  • Home
  • Articles posted by Steve Smith
  • (Page 2)
  • Uncategorized

Why I’m bullish on Shares of Turning Point Brands Inc. (NYSE:TPB)

I’ve written about how I’m not huge on trading off of unusual option activity, as it can be difficult to decipher exactly what might account for the higher volume, such as whether the trade was initiated as a buy or sale? Was it hedging an existing position?  Or if it was simply closing out a current open position?

But, sometimes it’s pretty clear that someone is making a big directional bet, especially if the trade occurs in a less known name that doesn’t typically see much option activity on a day-to-day basis.   

Such was the case on Monday in Turning Point Brands (TPB),  which established a bullish position with a notional value of some $700,000.

The trade specifics were the sale of 1,000 contracts of the January 40 strike puts, which was used to finance the purchase of the 1,000 of January 50/60 call spreads.

As you can see, from the options chain — below the open interest in these strikes — stands in sharp contrast to the zero contracts open in nearly every other strike.

implied volatility chart etrade

This is not to say that I want to just blindly follow into a position. But, it does provide a trade idea on which to do some research. In this case, it unearthed a gem that I had been familiar with.

Turning Point Brands provides tobacco products through three segments; both smokeless and smoking, and its most promising for growth, NewGen products. 

Stoker’s brand is its lead smokeless tobacco brand with chew being a cash cow, and Moist, a growing brand in a $4B market.  In Smoking, Zig-Zag is a leading brand with significant product launches expected in 2019.  With products such rolling papers, this should get a tailwind as marijuana legalization has increased demand.

The NewGen unit is intriguing from a growth perspective.  It offers e-liquid, and e-cigarette products.  After acquiring IVG, a franchiser of vaping for $56 million, NextGen now accounts for nearly 40% of TPB sales. The company spent $56M in acquisitions and it’s focusing on vapor sales. 

TPB is also expected to begin rolling out proprietary CBD products through its Nu-X subsidiary in Q2. With the CBD industry estimated to grow to $10B to $25B in sales, by 2025, making TPB a potential way to have exposure to this growth area with limited investment options. 

Another part of the TPB growth story is market penetration. The company’s Stoker’s moist snuff, for example, accounts for just 2.9 percent of the overall market.  However, it accounts for 6.7 percent of sales in stores with distribution. This shows that there is plenty of latent demand for the company’s brands.

The company has moved to capitalize on this opportunity by beefing up its sales force. TPB recently sealed a deal to sell its moist snuff in Dollar General (DG) stores, and it sees tens of thousands of potential new distribution points for its products.

From a purely technical perspective, the chart also looks bullish.  The stock surged in early May, following a strong earnings report, and has been forming a bullish flag above $47 support level. Today, it appears to be breaking out and set to move higher.  

tpb turning point brands inc nyse

That option trade, while longer term with an expiration that is another 7 months away, is already paying off.

Turning Point is a rare gem in that it is a small player in a stable industry, with a lot of compound earnings potential, over the coming years.


  • Home
  • Articles posted by Steve Smith
  • (Page 2)
  • Uncategorized

Is This a Dead Cat Bounce, or Has the Bull Market Returned?

As of this midday writing, major stock indices are all up over 1.5%, — their best day in four months.  This comes on the heels of consecutive weeks down, six for the Dow, the longest losing streak in 6 years.  The question now: Is this a dead cat bounce from oversold conditions, or the renewal of the bull market?

To determine the difference, let’s drill into some of the market, technical and sentiment reading. No animals were harmed during this analysis.

The first thing I noticed over the past few weeks is that the decline has been very orderly.  A drop of about 6% over the past five weeks only had one day with a 2%-plus decline, and still left the indices up some-10% for the year-to-date. The selling was steady, but never showed signs of panic.

This was reflected in the VIX , which barely tipped 20 on the initial days of the sell-off, and is currently back at high school age.  While the declines in some sectors and stocks have been more severe (ie semi’s off 16%, energy down 27%), investors have mostly remained pretty calm, seemingly confident that the economy won’t be derailed. 

vix chart 2019

By contrast, the bond market, and to some extent currencies and some commodities, have been quite disorderly, bordering on panic, suggesting there’s a crisis on the horizon.  You can see the cascade in the 10- Year Treasury, as yields dropped to near 2%, before today’s retreat higher.

tnx cboe 2019 chart

It’s no surprise that the Nasdaq, which suffered some of the largest losses, with tech stocks tied to China’s supply chain and recent antitrust issues, which are enjoying a bigger bounce today with the index up over 2%

But, despite the recent decline it has never reached oversold levels. I’m concerned today’s bounce merely alleviates the near-term pressure and it will turn lower again in the coming days.

overbought oversold nasdaq

You can see that the new lows never hit an extreme that marked prior bottoms. Some of this may just be because many of the names had big 20%-50% gains, during the first few months of the year — even a 20% decline didn’t hit a new low.  That’s just math.

hi-lo indicator nasdaq

From a sentiment standpoint, investors have clearly become more cautious but are still far the capitulation levels of below 15 that the Fear & Greed Indicator typically hits at major market lows.  

fear and greed index

Given that none of the readings hit major extremes and the major indices are still just 6% off the all-time highs I’d view today’s action as simply a bounce from moderately oversold conditions.

Proceed with caution.


  • Home
  • Articles posted by Steve Smith
  • (Page 2)
  • Uncategorized

Why Foot Locker (FL) Is a Good Buying Opportunity

When athletic shoe retailer, Foot Locker (FL) reported earnings last week, the stock tumbled some 15% and has continued to slide over the following days.  I think it is now approaching a great buying opportunity from both a technical and fundamental standpoint.

The technical picture is fairly simple; FL is now back to its lowest levels in 18 months and approaching major support near the $40 level.

foot locker stock activity 2019

Of course, a decline in price to new lows doesn’t make the shares a bargain if companies fundamentals are deteriorating.

Foot Locker did post slightly worse-than-anticipated Q1 sales and earnings results. But, almost all metrics were still positive, and I think the market grossly overreacted to what was perceived as a ‘miss’ and some overriding concern that are plaguing retailers in general.

While many mall or outlet-based retailers are struggling, Foot Locker is outperforming competitors and still growing against a tough backdrop.  

Overall, revenue grew 8% and eps were up 7.5% year-over-year.  

Particularly impressive was the direct-to-consumer (DTC) online sales increased 14.8% y/y, driving online penetration to 15.4% of sales from 13.9% in the comparable quarter a year ago. The growth in this channel demonstrates Foot Locker’s ability to adapt to the digital world, which is crucial to any retailer hoping to remain competitive.

But, probably the most interesting number was the comp of physical stores, which was up 3.9% year-over-year demonstrating the underlying value of the Foot Locker model.

Investors seem to have a difficult time believing Foot Locker can thrive as an outlet/mall-based chain. But, as a company that serves younger customers often in areas with lower rates of online sales penetration, the physical store is an attractive asset.

Additionally, Foot Locker’s ability to display the product and partner with key vendors like Nike (NKE) creates a selling environment that induces purchases.

While online sales are still growing at 50% in-person sales still represent over 80% of all retail sales, meaning physical assets retain value. The nature of the footwear industry, with its market-specific allocations, high turns on premium product, and extensive product displays, allows Foot Locker to capture real value from its physical locations.

That said, Foot Locker still owns an excess of stores in the U.S. and Europe. As a result, the company closed 25 stores during the quarter, and it expects to continue shrinking its footprint by 6% over the next year — with underperforming units such as Lady Foot Locker, comprising the bulk of the closings.

Also, while China and tariffs were not mentioned on the earnings call, it’s clear that investors are worried about the impact of tariffs on Foot Locker’s earnings. The impact remains to be seen and at this point, it seems a worst-case scenario is priced in any resolution, which would be a positive catalyst.

All told the company’s numbers all stack up positively to reports over the prior eight quarters, which helped drive shares from $40 to a high of $70, just this past March, making this return to $40 unwarranted and great a buying opportunity.


  • Home
  • Articles posted by Steve Smith
  • (Page 2)
  • Uncategorized

Do You Want to Become a Better Options Trader?

The passing of Memorial Day, with its historical weight, is also a time to look forward — to the light and carefree days of summer.

While some have used this turning of the season to clear “sell in May and go away,” I think it’s a good time to brush up on your options knowledge.  Yeah, I know, I’m a wet blanket at the beach.

While I wouldn’t chop off your arm for reaching for the latest Jack Reacher novel, nor object to the suggestion of Grisham’s courtroom intrigue, or deny the deal-making put forth by Trump as someone who writes about and actively trades options I belong to the camp that believes your time could be better spent learning how options, when properly utilized, can both boost returns and reduce risk.

Instead, impress your neighbors, annoy your family and study yourself into a well-deserved siesta with some of the best books and resources on options. It may lack the drama of reading about Greece and central banks interventionist policies, but I promise the long-term benefit is better.   

I’ll tee up a few topics and offer some reading suggestions for those that want to delve deeper and don’t mind being spotted on the beach thumbing or swiping through an options book or tablet.

Operation Manual

As with any tool, before using options, make sure you are familiar with the basic rules and guidelines that govern their behavior. 

For starters, make sure you know the contract specifications of the product you are trading. Items such as margin requirements (pay special attention to leverage), the exercise and settlement procedures, and what strikes and expirations are currently listed for trading are important to know.

For example, you should be aware that index options, such as for those on the S&P 500 or SPX, can only be exercised on expiration day and are cash settled; also note that SPX options actually cease trading on the third Thursday of the month, a day earlier than equity options, though they officially expire on the third Saturday. 

By contrast, equity options, including those on the Spyder Trust (SPY), can be exercised at any time during the life of the contract. This is especially important when trading options on stocks that pay dividends. 

This information and more can easily be found at exchange websites such as the Chicago Board of Options Exchange (CBOE).   Another great educational source is the Options Industry Council.

A terrific book that covers all the basic concepts and strategies is Options as a Strategic Investment by Lawrence McMillan.  

The next level is Option Volatility and Pricing: Advanced Trading Strategies and Techniques by Shelton Natenberg.

Dealing in Dividends

If you own in-the-money calls on Exxon (XOM), make sure you know when the ex-dividend date occurs. You will need to exercise your calls if you want to qualify for the payment. Likewise, if you are short on an in-the-money call on a dividend-paying stock, be prepared for assignment and being short the actual shares the day before it goes ex-dividend.

Most ETFs pay dividends. Some, like the Spyders, payout on a quarterly basis, and for some reason, the ex-dividend date often falls on the Thursday prior to a quarterly expiration.   Meaning many people have failed to exercise an ITM call and lose out on the dividend while others are unwittingly assigned puts and forced to pay.

Others, like the Dow Jones Industrial Average (DIA) make monthly distributions. The point is, knowing the basic rules by which the various vehicles operate will help you avoid surprises such as an early assignment on an in-the-money call. 

Jargon Slashing

Options traders, like other professionals, love to use industry jargon. Talking the lingo serves several purposes: It connotes a high level of knowledge and expertise in one’s specific field, it accurately conveys complex concepts in a concise manner, and it just sounds so cool to say things like, “I’m long vol up the ying-yang and bleeding theta,” which basically means one owns options that are suffering from time decay. 

The downside of lingo is that sometimes it’s used to purposely conceal the true level of understanding, or it’s simply a means for the speaker to bolster his self-esteem and get the upper hand in a negotiation. 

This can be very off-putting to the layperson put in the position of deferring to the expert because he is reluctant to ask a “stupid question.”   So, with that in mind, while it’s not important to know all the jargon, it is imperative to understand the concepts so as not to make a needless costly error.   

Or that scalping gamma is a fancy way of saying, “I’m trying to buy low volatility and sell higher volatility as the price of the underlying stock moves back and forth within a trading range.” 

Some basic concepts of option pricing models such as Black-Scholes and “the greeks” especially, delta and theta, mean and how they measure options’ value.

For deeper dives, there are plenty of good books out there.  One of my favorites on harnessing Vega and Gamma is Options Volatility Trading: Strategies for Profiting from Market Swings by Adam Warner.  

A great site for finding and analyzing current and historical volatility, along with an amazing amount of free tools, is iVolatlity.com

Some of the best option books I’ve ever read, come to Charles Cottle whom I’ve had the pleasure of sharing a panel with on several occasions. His Options Trading: The Hidden Reality it blew my mind the first time that I had to go back and read it again. I still only understand only half of what he was saying.

That one will both enlighten and put you to sleep.  Enjoy the rest of your week!

For some lighter fare, and the best, quickest, and cheapest way to get an introduction to options, click here to access my free ebook: The Ultimate Guide to Trading Options.

  • Home
  • Articles posted by Steve Smith
  • (Page 2)
  • Uncategorized

A Slingshot Options Strategy for Income and Gains

In looking for ways to maintain a bullish stance and generate income while protecting from a downside disaster, the standard collar (long stock, long protective put and short a higher strike call to pay for the put) is the standard approach.  And while there is no reason to re-invent the wheel, there is a small twist we can apply to address the one obvious drawback of having profits capped to the upside.

By selling a call credit spread rather than writing a covered call, we can unlock the potential gains of a strong move higher. For lack of a better name, I’ll defer to Charles Cottle, one of the great option minds of this generation, who labeled this strategy a SlingShot.  Adding the protective put makes this a hedged position.

The basic construction of the Slingshot Hedge consists of for every 100 shares (for our purposes a long term at-the-money call), buy one long term out-of-the-money put to button up the risk to the downside. Next, sell two nearer-term out-of-the-money call vertical spreads.  Depending on how much time there is to go and implied volatility levels, you should generate enough of a credit to pay for the put you just bought.

Within a given range, the Slingshot acts much like a collar.  The benefit comes on a sharp move higher. Once the price moves above the long (higher) strike of the credit call spread, the position becomes similar to a “naked” long with delta approaching 1.0.  

Depending on the configuration, if the underlying stock doubled, a naked stock would make 100% profit from its current trading level. By comparison, the slingshot will generate approximately 50% to 75% on the same move.  And remember, the downside is still protected, limiting the losses on a large decline.

The main drawback or danger would be if the price of was in between the call credit strikes with the worst case landing at the higher strike on expiration.   Of course, if that scenario was playing out an adjustment would be in order.

The Slingshot Hedge is a versatile strategy that can be employed using a myriad of ratios, along with embedded calendar spreads to further enhance strategy selection

The Application

This strategy makes sense versus a typical collar — only if you think the underlying is capable of annual gains in excess of 20% or more.  At this point of the stock and economic recovery, it is unlikely the S&P 500, or any broad index, is unlikely to post such gains.

But there are certain sectors might have potential, and use the appropriate ETF.  I think the housing market presents such a possibility, and we can use the S&P Homebuilders (XHB) as our investment vehicle.  This assumes a higher level of risk but also stands to deliver alpha on a portion of the portfolio.

The Investment Thesis

The latest jobs data of 221,000 added to the payrolls, and more importantly, the rise in wages, suggests the employment picture is truly getting on a sound footing.  Job security is probably the number one factor when considering purchasing a home. This is coupled with the likelihood that rates will stay low by historical standards. For the foreseeable future, housing may be poised for a sustainable recovery beyond the speculative/investor-driven buying we witnessed over the past few years.    

The bull case is bolstered by the fact that household formations have now built up demand for reasons cited above affordability, especially given that the rental market has seen very large price increases, should finally motivate millennials to move out of their parents’ homes and start a family of their own.   

For those that cite the demographic trend toward a move into urban centers I say two things: It really doesn’t undermine a bullish housing thesis as many of the larger homebuilders and the XHB’s components have exposure to multi-family dwellings.  And, for anyone that has experienced the joy of watching a toddler find their feet and vocal chords that appeal to a high rise or urban loft, pales to the benefits of a backyard and ease of a bike ride around the block.

After a steep sell-off at the end of 2018, XHB is basically back to where it was a year ago.

xhb spdr chart 2019

Assuming interest rates stay low the above trends in jobs, and household formation takes place, I can see XHB enjoying double-digit percentage gains in the second half of the year.

The Position

With shares of XHB currently $39.25.

-Buy 1 January 2020 $39 call for $3.00 a contract

-Buy 1 January 2020 $32 put for $0.70 a contract

And

-Sell 2 July 2019 $41 calls at $0.55 a contract

-Buy 2 July 2019 $43 calls at $0.25 a contract

The two call spreads bring in a $0.60 net credit.   That covers 88% of the cost of the put. The total initial cost of the package is $3.10

The position’s current Delta is 0.15 but with a positive gamma.

The current Theta is +0.01.

While it’s never great to extrapolate or assume a repeatable event, it is indeed worth noting. The call spreads pays for 91% of the puts on the first quarterly cycle.  

Assuming an unchanged share price and executing writing three additional call spreads on quarterly rolls, this would finance 35% of the call purchase.

An approximate 5% quarterly return would be realized if XHB climbs to the lower, short strike (in this case $35) on each expiration cycle.

On a move above $43, the profit potential is theoretically unlimited.

The position will be managed through the rolling of the call spreads, depending on time and price.  


  • Home
  • Articles posted by Steve Smith
  • (Page 2)
  • Uncategorized

Will the New 5G Technology Lead to a New Cold War?

Underneath much of the rhetoric surrounding the U.S. trade war with China, is the very real and crucial battle over intellectual property, especially related to technology.

And the fiercest and possibly most crucial fight involves the coming 5G network, which is considered the next revolution of mobile internet connectivity.  Some are even calling it the start of a new type of cold war.

At the center is Huawei, the Chinese mobile phone company, which controls nearly 85% of the Chinese market and is the largest cell phone maker in the world.

It’s well accepted that Huawei, which started 5G development as early as 2009, is further ahead of both the U.S. and European companies such as Verizon (VZ), Apple (AAPL), Vodaphone or even Samsung.  But at issue is the fact that Huawei has been building its lead on the backs of intellectual property developed by U.S. based tech companies such as Qualcomm (QCOM) to Google (GOOGL), which had been subject to forced tech transfers if they want to do business in China.

President Trump has finally called for a stop to these practices and initially asked U.S. companies for selling parts and components to Huawei. That decision has now been put on hold in hopes some agreements can be reached.

From a practical point of view, 5G won’t really transform the individual’s use or applications of smart phones; they may run a bit faster and have a few more features, but will essentially still be WiFi-based devices for plugging into the internet.  

The real reason for hype and concern over Huawei and 5G networks is that it will lead to the huge and powerful leap in ‘the internet of things’ technology. That is where devices from cars, to robotic manufacturing, to household appliances, all communicate with each other.  All of these will be tied into mobile devices and share an incredible amount of business and personal data.

China’s interest in spying and hacking both personal and governments is well documented. Huawei is essentially a government controlled entity, meaning if it dominates 5G, it poses both a huge security and financial risk to companies and countries.  Beijing could soon have access to the most private data of billions of people, including social media, medical services, gaming, location services, payment, and banking information.

Huawei could set the tech landscape for the next 10-15 years if it got that foothold.

Mastering the next generation of technology and controlling the rollout of networks across the world would hand the victors a windfall for the ages.

The escalating dispute is a tech cold war that could see the world fracture into two economic camps, reversing the pattern that has seen China integrated into the world economy and set back the strides in the globalization of technology has made over the past 20 years


  • Home
  • Articles posted by Steve Smith
  • (Page 2)
  • Uncategorized

This Particular Pot Stock Has Global Ambitions

While most of the media coverage is focused on U.S.legalization initiatives and how companies can enter or position themselves in the U.S., a lot of investors are unaware that the European Union is a far larger market.

Aurora Cannabis (ACB), a Canadian based firm but with eyes firmly fixed overseas, sold just $2.8 million, or a mere 7% of its total revenue in dried cannabis, to the EU last quarter. While that was 40% above the prior quarter, it’s not much given that ACB’s has $8.2 billion in valuations, and is still posting quarterly losses.

However, the company believes Europe presents an equal, if not larger, and more immediate market than the U.S Not only does the EU combined have a lot more people in the U.S., with approximately 500 million, it’s also the largest economic bloc in the world as well.

The company is not ignoring or dismissing the U.S., but rather taking a wait-and-see attitude.  During its conference call the company explained, “ there are enormous challenges in the U.S. besides the obvious illegality of pot at the federal level. Right now, they have multiple state operators, multi-state operators that have small facilities in their various states. And that’s not really the Aurora way of doing things. And if we do go to the states, we will be focusing on large populations that are not fully established that have regulations that we are able to operate in with profit. If they erase the state lines, that whole picture changes. If you are able to cross those state lines, then it becomes a massive cannabis market.”

Instead, Aurora is allocating time and resources to what it views as important growth sectors of the global cannabis market.

In putting the various pieces of its production and distribution network with an eye on Europe, it is moving ahead of most of its Canadian and U.S. competitors. By building facilities and infrastructure in various markets, it will have a competitive advantage of larger harvests per square foot and lower costs.

Right now, Germany is its most important market. Aurora was one of three companies recently awarded the legal rights to grow and distribute medical marijuana in Germany.  It awarded the maximum number of 5 of the 13 lots over a period of four years with a minimum total supply of 4000 kg.

The cannabis produced will be sold to the German government and supplied to wholesalers for distribution to pharmacies.

Another key factor is that many patients also receive medical coverage for cannabis, making it a fairly predictable market to compete in and one with high margins.  

It estimates the market to be 850,000 users within the next two years.

That would be a 10-fold increase over the current 77,000 users it reported on earnings release last week.

Supplying the German market is important because it’s the largest market in Europe. By gaining success there, the brand of Aurora will gain recognition and trust across the continent.

Aurora is timing its production ramp-up to coincide with the pace of putting the infrastructure in place that will fuel meaningful growth.

If management’s forecasts are accurate, demand and profits should soar in the coming year and so should the stock price.  


‹ Older posts
Newer posts ›

©2025 StockNews.com
About Us | Contact Us | Performance | Privacy Policy | Terms of Use | Supplemental Terms

Copyright © 2025. Market data provided is at least 10-minutes delayed and hosted by Barchart Solutions.
Information is provided 'as-is' and solely for informational purposes, not for trading purposes or advice, and is delayed. To see all exchange delays and terms of use, please see disclaimer.

This site is protected by reCAPTCHA and the Google Privacy Policy and Terms of Service apply.

Information contained on this website maintained by Magnifi Communities LLC is provided for educational purposes only and are neither an offer nor a recommendation to buy or sell any security, options on equities, or cryptocurrency. Magnifi Communities LLC and its affiliates may hold a position in any of the companies mentioned. Magnifi Communities LLC is neither a registered investment adviser nor a broker-dealer and does not provide customized or personalized recommendations. Any one-on-one coaching or similar products or services offered by or through Magnifi Communities LLC does not provide or constitute personal advice, does not take into consideration and is not based on the unique or specific needs, objectives or financial circumstances of any person, and is intended for education purposes only. Past performance is not necessarily indicative of future results. No trading strategy is risk free. Trading and investing involve substantial risk, and you may lose the entire amount of your principal investment or more. You should trade or invest only “risk capital” - money you can afford to lose. Trading and investing is not appropriate for everyone. We urge you to conduct your own research and due diligence and obtain professional advice from your personal financial adviser or investment broker before making any investment decision.

StockNews, a division of TIFIN Group LLC, is affiliated with Magnifi LLC (“Magnifi”) via common ownership. Affiliates of Magnifi will receive cash compensation for referrals of clients who open accounts with Magnifi. Due to this compensation, a conflict of interest exists since StockNews has an incentive to recommend Magnifi. Please see Magnifi’s Form ADV for additional information about fees and charges that may apply.